1
A Work Project, presented as part of the requirements for the Award of a Master Degree in
Economics from the NOVA – School of Business and Economics
Deflation and Monetary Policy: A look into Japan and the Euro Area
Bien Janine Capua Balocating, 714
A project carried out on the Master in Economics Program, under the supervision of:
Professor Luis Campos e Cunha
2 Deflation and Monetary Policy: A look into Japan and the Euro Area
Bien Janine Balocating
January 2016
Abstract
With more than two decades of weak economic performance since the bubble burst in the ‘90s,
the Japanese deflationary scenario has become the economic fate every developed economy
fears to become. As the euro area continues to experience sustained low inflation, studying the
Japanese monetary policy may shed light on how to prevent persistent deflation. Using an
SVAR methodology to understand the monetary transmission mechanism, we find some
evidence that the euro area may possess characteristics that would eventually lead to a
deflationary scenario. The extent of whether it would suffer the same Japanese fate would
depend on how macroeconomic policies are timely coordinated as a response to its liquidity
problem and increasing public debt across member states.
Keywords: deflation, monetary policy, svar, zero interest rate policy, quantitative easing policy
1 Introduction
For the past 20 years, Japan has been characterised by slow growth, rising unemployment,
and deflation. This deflationary phenomenon continues to stimulate debates of what went
wrong in Japan, whether monetary policy has become impotent in improving the country’s
economic performance and how to escape from stagnation. Therefore, this study aims to
understand the Japanese monetary policy in light of its deflationary experience by evaluating
its interest rate targeting policy and quantitative easing (QE) policy after the bubble burst of the
3
Meanwhile, the recent decline of inflation measures across the euro area1 has increased fears of a deflationary spiral2, just as the Japanese case. The region continues to struggle in reviving its stagnating economy since the aftermath of the 2008 global financial crisis followed by the
euro debt crisis. A recent report from the Organization for Economic Cooperation and
Development (OECD, 2014) articulated that deflation risks in the euro area have risen, and the
European Central Bank (ECB) should keep its interest rates at near zero over the medium term
to cope with it. Likewise, BBVA’s 2015 first quarter global economic outlook found that the
European Monetary Union (EMU) has a greater risk of experiencing a deflationary spiral than
the US by comparing the debt-deflation tension indicators3 of the two economies with Japan. Using a money-based early warning model in analysing the risk of a low inflation regime in the
euro area, Japan, and the US, Amisano et al (2014) found that risks of a low inflation regime in
the euro area have been increasing in the last six quarters of the sample from 1992 to 2012.
As the euro area continues to fall short of its inflation rate target, measures to accommodate
monetary policy away from a sustained deflationary scenario is an important aspect
policymakers should look into, as well as strengthening other macroeconomic policies that
would harness a stable and continuous economic recovery. The Japanese economy is evidence
that once the economy is posed to a deflationary scenario, the process to economic growth will
be difficult to reverse. On the other hand, the United States deflation case (during the Great
Depression and the Great Recession) has shown that it is possible to avoid a Japanese-style
deflation. Therefore, this study also aims to look at whether the similarities or differences
1 The aggregated euro area official statistics have used different definitions of the euro area as an entity. However, the euro area wide model
database (Fagan, Henry and Mestre, 2001) we used employs a fixed composition (using the same group of countries throughout all periods) of the euro area with 19 members including Belgium, Germany, Ireland, Greece, Spain, France, Italy, Cyprus, Luxembourg, Malta, the Netherlands, Austria, Portugal, Slovenia, Slovakia, Finland, Estonia, Latvia, and Lithuania.
2 Deflationary spiral, coined by Irving Fisher (1930), refers to the persistent combination of deflation and stagnation in economic activity and
employment (BBVA, 2014).
3 Debt-inflation tension indicator is a combination of two other indicators: the debtor inflation index, which captures the general change in
4
between macroeconomic variable responses to monetary policy shocks in the euro area and
Japan are sufficient to dismiss or to act upon the possibility of a long-term deflation.
The paper is presented as follows: Section 2 presents an overview of the path that led to
Japan’s current deflationary situation and some literature on deflation and monetary policy,
Section 3 describes the methodology used, Section 4 presents the main results and comparison
between Japan and the euro area, and Section 5 provides conclusion and recommendation.
2 Literature Review 2.1 Bubble and Burst
A number of empirical research have studied and analysed the historical path (Ahearne et al,
2002; Ito and Mishkin, 2004; Harvey, 2014) that led to Japan’s lost decades. The asset bubble
of the 1980s is linked to the Japanese deflation spiral. Asset prices peaked at the end of 1989,
followed by a fall of more than 50% in the stock market over the next two years. Moreover, the
value of land prices fell in 1992 and continued to remain at lower levels. Despite the collapse
in money supply growth, the real economy did not immediately feel the burst of the asset
bubble. Meanwhile, nominal gross domestic product (GDP) continued to grow until 1997;
unemployment did not exceed 3% until 1995; and the consumer price index (CPI) remained
positive until September 1998 (Harvey, 2014).
While asset prices were doubling and tripling during the bubble period, the inflation rate
remained at 2.5% on the average, prompting a difficult choice for the Bank of Japan (BOJ) of
when to tighten monetary policy or remain at ease. The sharp appreciation of the yen in
February 1995 until the summer of 1996 caused a recession due to a slump of exports and
imported disinflation (Ito and Rose, 2006), considering that Japan is an export-oriented
economy. It was also in that time that the 1997 Asian financial crisis made it harder for the
5
19964 to prevent too much appreciation of the yen. However, the problem of implementing an appropriate monetary policy from the BOJ during the 1980s stemmed from low levels of
inflation5, while the stock and land prices were increasing at an annual rate of 30%. The low inflation rate, which is below the typical inflation target of around 2%, suggests that there is
room for monetary easing. On the other hand, stopping the asset price inflation requires tighter
monetary policy. Tightening monetary policy would endanger a deflationary scenario,
considering an inflation rate at par with the target, while loosening monetary policy would
further encourage the rapid increase in asset prices that may lead to successive inflation. Thus,
not one single solution for the monetary policy can be obtained to pursue both consumer price
stability and asset price stability at the onset of the bubble burst. Where then does the BOJ stand
on the appropriate monetary policy strategy to pursue?
On the other hand, looking at the historical path of the euro area aggregates, particularly
inflation, output, and short-term nominal interest rate, the average inflation continue to decline
the last 25 years; the average short-term nominal interest rate declined from 1992 onwards;
GDP growth rate continues to struggle since the 2008 global financial crisis. However, Europe’s
asset price crash was brought by an international crisis. It was Europe’s exposure to global trade
that caused a major decline in economic activity since the Lehman collapse6, and further exacerbated by the sovereign debt crisis. Moreover, the scale of the stock index drop, measured
by equity prices, was of a similar case to Japan. The EURO STOXX 50 Index7 has increased since 2013 and has reached levels above convention before the debt crisis.
4 Interest rates have been lowered from 2% (1995) to 0.50% (1996); prior to the bubble (from 1990 to 1995), interest rates are averaged at
8%.
5 CPI from 1991 to 1992 was 2.5% on the average; it was lowered to 1.5% in 1993. Inflation was lower than the target from 1994 to 1998 (with
a slight pick up during the three quarters of 1997) at 0.5% on the average. Meanwhile, negative inflation was evident starting at the end of 1998 (until the present).
6On September 15, 2008, Lehman Brothers Holdings, Inc filed for bankruptcy, initiating the largest proceeding in US history. Lehman was the fourth largest US investment bank at the time of its collapse. Lehman’s demise was the largest victim of the US subprime mortgage-induced financial crisis that swept through global financial markets in 2008. See Wiggins, Piontek, Metrick (2014) for further analysis of the Lehman collapse.
7It is Europe’s largest leading blue chip index for the euro area. The index covers 50 stocks from 12 euro area countries: Austria, Belgium,
6 2.2 Deflation and Monetary Policy
Deflation is defined as “a sustained decline in an aggregate measure of prices such as the
CPI or GDP deflator”. Technically, one or two quarters of price declines constitute a deflation
that is still manageable. However, according to Kumar et al (2003), even mild but continuous
deflation “may increase economic uncertainties, distort resource allocation, entail distributional
consequences, and lead to subpar growth performance”. Likewise, as noted by Greenspan8, “deflation can be detrimental for reasons that go beyond those that are also associated with
inflation. Nominal interest rates are bounded at zero9; hence deflation raises the possibility of potentially significant increases in real interest rates.”
The impact of large asset price declines on balance sheets and aggregate demand is often
associated with deflation – a phenomenon evident in the case of Japan and the US. In particular,
the US stock market crash in 1929 threatened a period of widespread bankruptcies and collapse
in demand and prices, and resulted in the Great Depression (Kumar et al, 2003). In the early
1990s, the decline in Japanese equity and land prices has been associated with a prolonged slide
in activity and deflation. According to Kiyotaki and Moore (1997), asset price declines have a
severe impact on credit-constrained firms which can spill over from one sector to another, and
the effects can persist over time and become magnified (as Japan is experiencing at present).
However, not all declines in asset prices constitute a deflation – as the ECB articulates, the euro
area is not facing a Japanese-style deflation – but rather, price level declines occur across a
significant number of countries, across a significant number of goods, and in a self-fulfilling10 way (Eurobank Research, 2014).
8 From Problems of Price Measurement, remarks at the Annual Meeting of the American Economic Association and the American Finance
Association, Chicago, Illinois, January 3, 1998
9 To the extent that both inflation and deflation hamper economic performance and are otherwise equally undesirable, the zero-bound constraint
effectively renders the risks of deviating from inflation rate of zero asymmetric (Coenen et al, 2003).
10 Self-fulfilling deflation is defined by Woodford (2003) as “inflation that is perpetually lower than the target rate that eventually leads to
7
Ito and Mishkin (2004) explain that when the economy falls into deflation, there is a problem
that arises from the zero bound of nominal interest rate. Lenders will not accept a negative
interest rate since hoarding cash provides a higher return. Investment will be curtailed and may
trigger a slow pace of growth. Thus, nominal interest rates cannot go below zero because the
economy may face a disequilibrium situation – an argument that started from Hicks’s
interpretation of the Keynesian liquidity trap. Summers (1991), as cited by Hunt and Laxton
(2001), stated that in a period in which interest rates are already at low levels, the zero interest
rate floor might significantly reduce the monetary authority’s ability to further loosen monetary
policy when output and inflation objectives are threatened by adverse deflationary shocks.
According to Bordo and Filardo (2004), “if a shock were to cause the price level to fall below
target, then the central bank would take an accommodative monetary stance to put upward
pressure on prices until the price level returned to target. If, however a shock were to cause the
price level to exceed the target, the central bank would respond by tightening monetary
conditions to return to target. If the central bank were sufficiently patient towards achieving its
target, the return of the price level could be achieved without engendering deflation, or at the
very least minimising the need to engender deflation.”
3 Methodology 3.1 SVAR Model
To understand the monetary policy transmission mechanism, we adopt a structural vector
autoregression (SVAR) model by imposing just enough restrictions to identify exogenous
policy shocks, without having to specify a complete model of the economy. Since the pioneer
work of Sims (1980), SVAR methodology has been widely applied to measure the effect of
monetary policy (see van Arle et al, 2003; Monticelli and Tristani, 1999; Ehrmann and
8
used to study the impact of monetary policy on macroeconomic variables and the “identification
of the effects of monetary policy shocks requires only a plausible identification of those shocks
(…) and does not require identification of the remainder of the macroeconomic model”.
Moreover, Bernanke and Blinder (1992), emphasise the role of short-term interest rate as the
significant factor of monetary policy with recursive identification frameworks for SVAR.
Results from SVAR models are known to be quite sensitive. However, a simple but standard
specification can contain a minimum set of variables necessary to deliver sensible impulse
response functions that is consistent with literature results (Boivin and Giannoni, 2003).
3.2 Empirical Structure
The SVAR is described in two components of the economy and the monetary policy, as
adopted from Boivin and Giannoni (2003):
(𝑍𝑅𝑡
𝑡) = 𝑐 + 𝐴(𝐿) (𝑍 𝑡−1
𝑅𝑡−1) + 𝑢𝑡
The non-policy block (Zt) is composed of the output and inflation rate. Output is measured
as the GDP growth rate. Inflation rate is the rate of change in CPI and harmonised index of
consumer prices (HICP), for Japan and the euro area respectively11. The monetary policy block (Rt) is described by the policy instrument12 used by the BOJ and the ECB, which is the
uncollateralised call rate and short-term nominal interest rate, accordingly. Moreover, 𝑢𝑡=
𝐴−1𝐵𝜀
𝑡 relates the reduced-form 𝑢𝑡 disturbances to the underlying structural shocks 𝜀𝑡.
Monetary policy shocks, as defined in Rotemberg and Woodford (1998), are exogenous
stochastic shifts in the feedback rule used by central banks to set their interest rates. The focus
on these shift effects is not derived from the belief that “they have played an important role in
11 Data description is provided in Appendix 1.
12 We limit the identification of shocks to conventional monetary policy instruments stated above (as Ahearne 2002), while further measure of
9
the generation of fluctuations in either output or inflation”, but rather “they can be
econometrically identified without having to commit to detailed assumptions about the true
structural relations that determine output and inflation”. Moreover, monetary policy rules are
explicitly estimated in SVAR models. The focus is not on the rules but on deviations from the
rules, which is an argument to the criticism that VAR approaches view central banks as ‘random
number generators’, “since only when central banks deviate from their rules it becomes possible
to collect information on the response of macroeconomic variables to monetary policy
impulses” (Favero, 2001).
Meanwhile, Christiano et al (1998) have explored various strategies in isolating monetary
policy shocks. One of the strategies proposed is that assumptions must be made about the nature
of the interaction of the policy shock with the variables in the interest rate (ie, the policy shock
is orthogonal to these variables), which is referred to as the recursiveness13 assumption. Therefore, our identification restriction can be obtained from a timing scheme for the shocks.
Similarly, we adopt a just-identification scheme proposed by Sims (1980), based on the
Choleski decomposition of matrices, where the identification of structural shocks depends on
the ordering of variables. It corresponds to a recursive economic structure, with the most
endogenous variable ordered last. Thus, under the recursiveness assumption, the SVAR can be
expressed as:
𝑍𝑡 = 𝑏 + ∑ 𝐵𝑖𝑍 𝑃
𝑖=1
𝑍𝑡−𝑖+ ∑ 𝐵𝑖𝑅 𝑃
𝑖=1
𝑅𝑡−𝑖+ 𝑢𝑡𝑍
𝑅𝑡 = ∅0+ ∑ 𝐶𝑖𝑍 𝑃
𝑖=0
𝑍𝑡−𝑖+ ∑ 𝐶𝑖𝑅 𝑃
𝑖=1
𝑅𝑡−𝑖+ 𝑢𝑡𝑅
13 It assumes that the structural errors are orthogonal and the contemporaneous relations matrix between the variables in the VAR is block
10
Adopted from Leigh (2004) and Boivin and Giannoni (2003), output (Y) and inflation (P), under
the non-policy block (Zt), are ordered before the monetary instrument (R) on the assumptions
that the monetary authority acknowledges current output and inflation when it decides the level
of monetary instrument, and that output and inflation respond to a policy shock with a lag.
Consistent with the recent SVAR analyses, the policy reaction function and the policy shocks
from the VAR specification are based on the assumption that the non-policy block of the
economy responds only with a lag to changes in the interest rate, which constitutes an
unrestricted specification of the policy reaction function and can be estimated directly by
Ordinary Least Squares. Therefore, monetary policy shock at date t has no effect on either
output or inflation during period t, which accounts for decision lags as an identifying
assumption (Rotemberg and Woodford, 1998).
3.3 Model Extension
Majority of previous studies about the assessment of monetary policy in Japan has
commonly used the uncollateralised call rate as the BOJ’s operating variable, except in the
period of QE policy14. However, this does not mean that the BOJ limits its policy decision from other variables. As stated by Nakahira (2009), although appropriate guidance of the short-term
money market rate through market operations is the main concern of the central bank in the
short run, it would also be important to observe what happens with information variables, such
as the money stock15, in achieving the central bank’s goal of price stability. As cited by Nakahira (2009), Shioji (2000) suggested that, “if the monetary authority does not fully
14 Under the QE policy, the BOJ used the purchases of Japanese government bonds as the main instrument in reaching their operating target of
current account balances held by financial institutions at the BOJ (bank reserves) (Berkmen, 2012). Adopted from Berkmen (2012) and Nakahira (2009), we use the current account balances at the BOJ (in percent of GDP) as our monetary policy measure under our QE policy evaluation.
15 Another extension of this model is including an index of sensitive prices in order to capture the response of the policymaker to anticipated
11
accommodate demand for reserve or monetary base16 immediately, the policy reaction curve is not always horizontal. In such a case, the central bank may not perfectly adjust the short-term
interest rate level to the target level all at once because of the need to avoid abrupt fluctuation
in bank reserves and monetary base”.
To further understand the Japanese monetary policy following the unexpected state of the
economy after the bubble burst – where the BOJ implemented two different types of monetary
policy: the zero interest rate policy (February 1991 to August 2000) and the QE policy (March
2001 to March 2006) – we depart from a five-variable SVAR model. A five-variable VAR17 is run using growth rate, CPI, interest rate policy instrument, monetary base (defined by the
reserve requirement rate change adjusted 𝑀𝑡), and current account balances of bank
reserves18 (𝑅𝑆𝑡). As suggested by Favero (2001), using narrower monetary aggregate measure19 makes it easier to identify shocks that are driven mainly by the behaviour of the central bank. Although there is no explicit treatment of the zero lower bound on the interest
rate, the contemporaneous impact of the changes in the quantitative monetary policy measures
on interest rate is assumed to be zero, adopting the recent study of Berkmen (2012).
4 Results and Discussion
The regressions for Japan were done for the period of 1990-2008, which covers the period
of the end of the bubble economy; the zero interest rate policy from 1999 to 2000; the QE period
between 2001 and 2006; and the period prior to the Lehman collapse in 2008. Meanwhile, the
sample period for the euro area is restricted from 1995:Q1 to 2008:Q420.
16
Although the neutrality and superneutrality of money proposes that changes in this measure do not affect real variables, the inclusion of a monetary base can be integrated into the analysis. The Sidrauski model introduces money into the analysis, where utility depends not just on consumption but also on the holding of real money balances (see Sidrauski, 1967; Groth, 2011).
17The system is identified with the restrictions previously mentioned using the order of variables presented above: growth rate, CPI,
uncollateralised call rate, monetary base, and current account balances.
18 This measure is adopted from the study of Nakahira (2009) and Berkmen (2012), which is reflected as the operating variable under the QE
policy regime, and measured in rates.
19Therefore, we follow Nakahira’s (2009) measure of the money stock as the monetary base.
20 The sample period accounts only the time where the EMU has been set to place, including a few years prior to its official commencement.
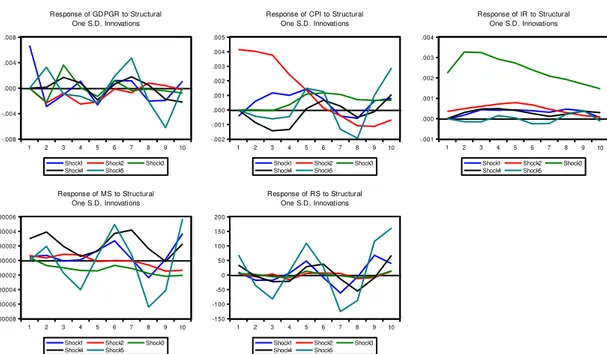
12 4.1 Baseline Model21
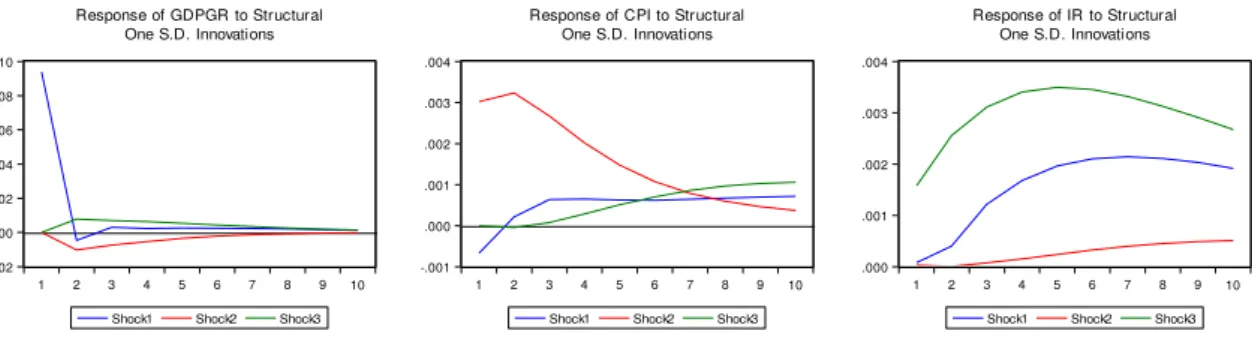
Looking at Japan, Figure 1 shows that a contractionary monetary policy shock (shock 3)
appears to raise output22 but lower inflation measure. However, output seems to contradict the stylised fact23 to a contractionary monetary policy shock response but eventually follows a decreasing trend. This may explain how the real economy did not immediately adjust to the
bubble burst despite the collapse in money supply growth, where nominal GDP continued to
grow until 1997; unemployment did not exceed 3% until 1995; and consumer price inflation
remained above zero until September 1998.
-.002 .000 .002 .004 .006 .008 .010
1 2 3 4 5 6 7 8 9 10 Shock1 Shock2 Shock3
Response of GDPGR to Structural One S.D. Innovations
-.001 .000 .001 .002 .003 .004
1 2 3 4 5 6 7 8 9 10 Shock1 Shock2 Shock3
Response of CPI to Structural One S.D. Innovations
.000 .001 .002 .003 .004
1 2 3 4 5 6 7 8 9 10 Shock1 Shock2 Shock3
Response of IR to Structural One S.D. Innovations
Households see price increases as rather temporary so they adjust their expectations
accordingly, given the central bank’s commitment to price stability. Moreover, the collapse in
money supply may be an evidence of a tight monetary policy from the BOJ – a view that is in
agreement with the finding of Bernanke and Getler (1999) that the BOJ implemented tighter
monetary policy from 1992 to 1995. An abrupt monetary policy easing was not an option for
the BOJ given the historical behaviour of its interest rates, which are already at lower levels,
and the advent of the asset price bubble, which can further increase inflation.
21 A series of tests have been conducted in order to determine the adequacy of the model, which were no longer presented elaborately. Residuals
of the series appear to be of white noise, although the CPI measure has a period overlapping the mean zero. Correlograms and roots of the characteristic polynomial analysis show that autocorrelation is not a problem and that no root lies outside the unit circle. LM autocorrelation tests also suggest that there is no serial correlation. Lag length used is based on the Schwarz criteria which identify one or two lags.
22 Although we take caution in interpreting the response as output is not statistically significant.
23 A contractionary monetary policy shock leads to an initial rise in short-term interest rates, a decrease in aggregate output and a relatively
small decrease in aggregate price level. Furthermore, the following shock terminologies used throughout the paper are as follows: shock 1 denotes an exogenous output (demand) shock; shock 2 denotes an exogenous inflation (supply) shock; and shock 3 denotes an exogenous monetary disturbance. In addition, shock 4 denotes an exogenous monetary base shock, while shock 5 denotes an exogenous bank reserves shock.
13
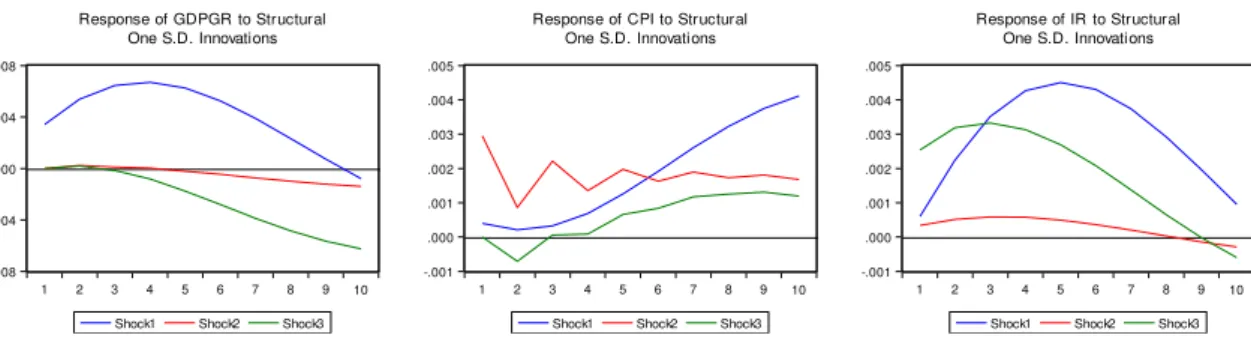
We now look at the impulse responses in the euro area as seen in Figure 2. The response of
output, prices and interest rate with a contractionary monetary policy shock (shock 3) is in
congruence with the stylised fact aforementioned, similar to the Japanese response. It appears
that an unexpected positive shock in the interest rates curtails economic activity and decrease
inflation, but prices tend to increase after four quarters. In line with the view of Monticelli and
Tristani (1999), we may find an evidence of ‘Eurosclerosis’24 since the effect on output takes time to materialise with a weak impact in boosting economic activity. Price response further
suggests inflation in the medium to long run, implying that a restrictive policy may not be
conducive to a disinflationary pressure. In the long run, deflation may not be a problem as prices
eventually increase, suggesting that short-term expectations lean toward consistently lower
prices while long-term expectations positively lean toward reaching the inflation target.
-.008 -.004 .000 .004 .008
1 2 3 4 5 6 7 8 9 10 Shock1 Shock2 Shock3
Response of GDPGR to Structural One S.D. Innovations
-.001 .000 .001 .002 .003 .004 .005
1 2 3 4 5 6 7 8 9 10 Shock1 Shock2 Shock3
Response of CPI to Structural One S.D. Innovations
-.001 .000 .001 .002 .003 .004 .005
1 2 3 4 5 6 7 8 9 10 Shock1 Shock2 Shock3
Response of IR to Structural One S.D. Innovations
However, recent annual rates of change for the euro area headline inflation issued by
Eurostat show a -0.1% rate in September 2015. This low inflation, according to the International
Monetary Fund (IMF), coincides with weak domestic demand in the euro area. According to
the findings of Kilian and Manganelli (2005), there is an increasing risk that the euro area will
fall into deflation. But Mario Draghi, President of the ECB, described deflation as “a situation
where price declines across a significant number of countries”, and the euro area is far from
24 A term introduced by the German economist Herbert Giersch referring to Europe’s slow job growth and slow pace towards European
integration. Currently, it is used to describe economic stagnation due to the adaptation of overly generous social benefits and government overregulation.
14
that scenario. Although longer-term inflation expectations are stable, the fall in short-term
expectations is something to be vigilant about, as the first four quarters of price response is
negative or zero.
As argued by IMF authors (2014), “one should not take too much comfort in the fact that
long-term inflation expectations are positive” as they may change overnight. This has been the
case in Japan where long-term inflation expectations where reassuringly positive. Shiratsuka
(2003) articulated that it was excessive optimism and not consistent projection of fundamentals
that mainly supported temporarily higher asset prices. Prevailing expectations in Japan during
the 1980s at the onset of the asset price bubble was due to an era of growing economic
development that corresponded with an optimistic expectation for potential growth, a trajectory
that was not able to forecast an economic downturn. Therefore, it was short-term expectations
that became troublesome in the economy which then led to drops in prices and wages, enabling
deflation to exist. In addition, there is passivity in the Japanese financial system, where almost
90% of its household keeps its financial assets in bank accounts or life insurance (Posen, 2003),
reflecting a risk averse society. Like Japan, the euro area has higher household savings rate than
household investment rate25. More so, these savers26 hold their money into bank accounts curtailing investment growth.
Moreover, the Japanese deflationary slump was not predicted by policymakers or
macroeconomic forecasts, and the euro area should take caution in the short run given the
economic outlooks. The euro area may be far off from an eventual deflationary spiral, as Mario
Draghi would insist, but monetary policy should be able to cushion expectations strengthening
average inflation in surplus countries enough to compensate for the adjusting countries.
Expectations are crucial to the allocation of resources, where households decide how much to
25 See Eurostat News release Euro Indicators (2015)
26For instance, Germany’s deposit-to-GDP ratio is the highest in Europe and total deposits have grown larger in the last 20 years, while the
15
consume and save which in turn determines capital accumulation and sequence of factor prices
(Blanchard and Fischer, 1989). As Blanchard and Fischer (1989) point out, “when the
divergence between actual and expected events causes households to revise their expectations,
they will choose a new path that is optimal given their expectations”, and that may be different
from expectations set forth by the monetary authority.
4.2 Model Extension
We further explore the model with the inclusion of the money stock as an investigation of
what happens with such information variables in achieving the central bank’s goal of price
stability. We estimate a four-variable SVAR with the inclusion of the monetary base measure.
We no longer present the results for Japan27, since the results of the second specification follow a similar response from the baseline model.
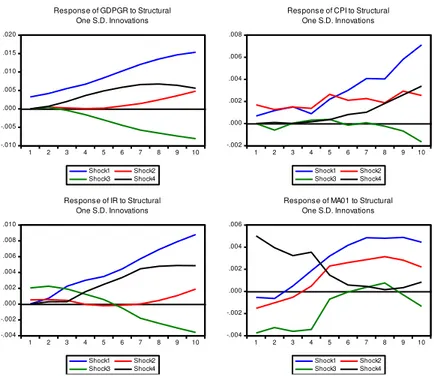
Instead, we look further at the euro area results. A positive shock to interest rates (shock 3)
appears to slow down economic activity and price response seems to be disinflationary in the
medium to long run. In addition, the response of the monetary base appear to suggest a liquidity
puzzle28 (see Figure 3), wherein a contractionary monetary policy increases the monetary base when it should hold a negative relationship, implying that dealers are shutting down and banks
are short on capital. Moreover, this may imply that the ECB has a declining ability to supply
the liquidity needed by the financial system, which then fails to satisfy the equilibrium demand
for liquidity resulting in cases of liquidity deficits. This liquidity risk29 can be manifested in the inability of the market to sell an asset, driving its market price lower or undetermined.
27The monetary base increases with a contractionary monetary policy shock by a negligible value, and does not suffer from a liquidity puzzle. 28According to Leeper and Gordon (1992), “the response of interest rates to a money growth innovation frequently becomes positive and is
never negative when the correlations are conditioned on past interest rates, money growth, prices, and output.”
29 There are two kinds of liquidity risks: market liquidity risk (the risk that the market liquidity worsens when you need to trade), and funding
16 -.010 -.005 .000 .005 .010 .015 .020
1 2 3 4 5 6 7 8 9 10 Shock1 Shock2 Shock3 Shock4
Response of GDPGR to Structural One S.D. Innovations
-.002 .000 .002 .004 .006 .008
1 2 3 4 5 6 7 8 9 10 Shock1 Shock2 Shock3 Shock4
Response of CPI to Structural One S.D. Innovations
-.004 -.002 .000 .002 .004 .006 .008 .010
1 2 3 4 5 6 7 8 9 10 Shock1 Shock2 Shock3 Shock4
Response of IR to Structural One S.D. Innovations
-.004 -.002 .000 .002 .004 .006
1 2 3 4 5 6 7 8 9 10 Shock1 Shock2 Shock3 Shock4
Response of MA01 to Structural One S.D. Innovations
In addition, the long-run liquidity problem evident in the impulse response function may
explain why euro policymakers see an issue of liquidity. Since the 2008 global financial crisis,
euro area long-term government bond yields have been rising. From the rescue of the largest
Irish banks, Greece’s severe fiscal problems, and expansion of budget deficit, sovereign spreads
rose sharply for most of the euro area countries (De Santis, 2012). Growth levels of the majority
of loans made to both governments and private organisations failed to materialise, thus the
problem of repaying and servicing debts became problematic. Loss of confidence in countries
such as Portugal, Ireland, Greece, and Spain has led to rises in the bond yields required on their
government debt. Such skepticism extends to the inability of their respective governments to
service their debt.
Moreover, the liquidity problem may be a result of a looming deflation. Bernanke, Laubach,
Mishkin, and Posen (1999) note that persistent deflation can lead to liquidity and solvency
problems that might aggravate contractions (Reifschneider and Williams, 2000). Similarly,
Japan’s economy experienced a liquidity crisis in 1997-1998 as well as the failure of its
financial institutions that led to its loss in international credibility (Ueda, 2001), which was Figure 3. EURO AREA: Impulse response functions of output, inflation, interest rate and monetary base to
17
further exacerbated by a decline in bank lending and spending. Therefore, the liquidity problem
from our results may be indicative of a looming deflation possibility in the euro area considering
a similar liquidity crisis in Japan.
In addition, the Fisher debt effect30 emphasises the adverse effect of lower prices on debtors through increased real debt burdens, which can then lower the aggregate demand because
debtors have a higher propensity to spend than creditors (Palley, 2008). The EU’s Stability and
Growth Pact creates room for destabilisation on the assumption that the larger the recession,
the more likely it is for an economy to fail the 3% deficit cap. Failure of the mandate would
require euro area countries to increase taxes or cut spending to avoid necessary penalties – a
measure to rapidly revert back to the 3% deficit will be detrimental in terms of tightening
monetary policy as growth and tax revenues start increasing. This creates room for burdening
taxpayers, who in turn cut their spending to accommodate further increase in taxes.
When there is a lot of money in the system, it should be observed that interest rate goes
down. However, a positive shock to the monetary base (shock 4) follows an increasing response
of the interest rate. This may be a case where expected deflation increases the demand for real
money balances because deflation increases the real value of money balance31; households shift the consumption of their portfolios towards money that may curtail spending and investment.
Increase in deflation lowers the aggregate demand and output because it increases money
demand, leading to lower nominal and higher real interest rates (Palley, 2008). This result adds
more weight to the possibility that the euro area may be facing a deflationary scenario, dragging
output and inflation downside. But whether it is headed to the most avoided Japanese stagnation
would depend on how monetary policy stance in the euro area is conducted and how quick it is
to loosening monetary policy. Other than the ECB’s mandate of ensuring price stability, it
30The Fisher effect states that the real interest rate equals the nominal interest rate minus the expected inflation rate. Therefore, real interest
rates fall as inflation increases, unless nominal rates increase at the same rate as inflation. Irving Fisher (1932) named two dominant factors
that played a more important role during the great booms and depressions in the economy, “… the debt disease and the price level disease are more important causes than all others put together”.
18
should also account for the risks brought by deflation. As articulated by Ahearne et al (2002),
when inflation and interest rates have fallen close to zero, and the risk of deflation is high,
“fiscal and monetary stimulus should be flexible beyond conventional targets set by future
inflation and economic activity forecasts.” This provides an avenue for the euro area to
strengthen its fiscal policy in coordination with monetary policy reducing the need to rely on a
single policy and moderating drawbacks from policy overuse, creating a strong foundation of
its macroeconomic policies.
4.3 Japanese Monetary Policy
As the deflationary scenario continues to persist in Japan, we try to evaluate the Japanese
monetary policy in its response to generate economic activity and inflation through the interest
rate targeting policy and QE policy, and extract possible lessons from this experience.
Japan conducted the zero interest rate policy by guiding the uncollateralised overnight call
rate as close as zero percent, while it implemented the QE policy by guiding the outstanding
balance of the private financial institutions’ current reserve account held at the BOJ (Nakahira,
2009). We therefore, dissect the sample period accordingly, which we define in the next section,
with the different policies and adopt the model structure specification32 of Nakahira (2009) to evaluate the interest rate targeting policy and of Berkmen (2012) for the reserve targeting policy
of the BOJ.
4.3.1 Interest Rate Target Policy
Departing from the second specification to evaluate the interest rate targeting policy, we
restrict the sample period from 1991:Q1 to 2000:Q4. We further make two different periods to
19
investigate the period from the end of the bubble economy33 to the quarter just before the introduction of the zero interest rate policy (1991:Q2 to 1999:Q1) and the period from the end
of the bubble economy to the termination of the zero interest rate policy (1991:Q2 to 2000:Q3).
-.004 -.002 .000 .002 .004 .006 .008 .010
1 2 3 4 5 6 7 8 9 10
Shock1 Shock2 Shock3 Shock4 Shock5
Response of GDPGR to Structural One S.D. Innovations
-.001 .000 .001 .002 .003 .004 .005
1 2 3 4 5 6 7 8 9 10
Shock1 Shock2 Shock3 Shock4 Shock5
Response of CPI to Structural One S.D. Innovations
-.0005 .0000 .0005 .0010 .0015 .0020 .0025 .0030
1 2 3 4 5 6 7 8 9 10
Shock1 Shock2 Shock3 Shock4 Shock5
Response of IR to Structural One S.D. Innovations
-.00003 -.00002 -.00001 .00000 .00001 .00002 .00003
1 2 3 4 5 6 7 8 9 10
Shock1 Shock2 Shock3 Shock4 Shock5
Response of MS to Structural One S.D. Innovations
-15 -10 -5 0 5 10 15
1 2 3 4 5 6 7 8 9 10
Shock1 Shock2 Shock3 Shock4 Shock5
Response of RS to Structural One S.D. Innovations
Figure 4a. JAPAN: Impulse response functions to structural one S.D. innovations, period from the end of the bubble economy to the quarter just before the introduction of the zero interest rate policy
Figure 4a shows that restricting the sample period to account for the period from the end of
the bubble economy to the quarter just before the introduction of the zero interest rate policy
and including the monetary base and bank reserves appear to have weaker impact relative to
the prior model. Although a positive shock to monetary policy (shock 3) and bank reserves
(shock 5) appear to have a weak impact in boosting economic activity and increasing price
levels, shocks to the interest rates appear to have more impact relative to shocks to the bank
reserves. Ruling out the price puzzle is suggestive; the model does not suffer from a liquidity
puzzle as the monetary base gradually declines with a positive monetary policy shock.
Extending the sample period until the termination of the zero interest rate policy, Figure 4b
depicts a weak response of output and inflation measure with a monetary policy shock (shock
3), implying that interest rate policy may not be sufficient to stimulate economic activity and
33For the purpose of this study, we use the Cabinet Office’s estimates following Nakahira (2009). As determined by the Working Group of
20
prices. Both the money stock measures, which are monetary base and bank reserves, show a
decreasing response. However, the response of macroeconomic variables with the inclusion of
the zero interest rate policy is quite stronger prior to its implementation, which implies that the
economy may have responded by further lowering the interest rates.
-.008 -.004 .000 .004 .008
1 2 3 4 5 6 7 8 9 10
Shock1 Shock2 Shock3
Shock4 Shock5 Response of GDPGR to Structural
One S.D. Innovations
-.002 -.001 .000 .001 .002 .003 .004 .005
1 2 3 4 5 6 7 8 9 10
Shock1 Shock2 Shock3 Shock4 Shock5 Response of CPI to Structural
One S.D. Innovations
-.001 .000 .001 .002 .003 .004
1 2 3 4 5 6 7 8 9 10
Shock1 Shock2 Shock3
Shock4 Shock5 Response of IR to Structural
One S.D. Innovations
-.00008 -.00006 -.00004 -.00002 .00000 .00002 .00004 .00006
1 2 3 4 5 6 7 8 9 10
Shock1 Shock2 Shock3
Shock4 Shock5 Response of MS to Structural
One S.D. Innovations
-150 -100 -50 0 50 100 150 200
1 2 3 4 5 6 7 8 9 10
Shock1 Shock2 Shock3 Shock4 Shock5 Response of RS to Structural
One S.D. Innovations
Because the BOJ aimed at factoring market expectations under the premise that monetary
easing would be maintained over time and that the zero interest rate policy would continue until
deflationary pressure is ruled out, increase in the money stock hampers inflation expectations
since the market fails to recognise that the natural rate of interest will likely be positive in the
future. As stipulated by the BOJ (2001), the marginal utility of holding money is zero given
that interest rates are artificially set at zero. In this case, further monetary stimulus becomes
ineffective because the nominal interest rate is bounded at zero.
From the estimation results, the shocks to the interest rate can be seen as having relatively
more impact on the variables compared with the shocks to the bank reserves in boosting
economic activity and inflation. This may be an implication that the BOJ’s interest rate targeting
policy under the call rate operating variable is acceptable in addressing the shocks to the Figure 4b. JAPAN: Impulse response functions to structural one SD innovations, period from the end of the
21
economy. Likewise, Ahearne et al (2002) articulated that the Japanese monetary policy during
1991-1995 appeared appropriate based on the economic expectations that time34, although loosening monetary policy was not enough to escape deflation, thus the weak impact to improve
economic performance. However, implementing the zero interest rate policy in 1999 until 2000,
coupled with adverse asset price and interest rate expectations that make holding money
attractive (Palley, 2008), may have triggered the economy into a liquidity trap which deems
monetary policy ineffective. The nominal interest rate is stuck at its floor level, which adds
more pressure in the deflationary scenario.
This becomes problematic in the sense that increases in the deflation rate no longer generate
offsetting declines in the nominal interest rate through price level effects on the real money
supply. The sluggish response to a contractionary monetary policy shock of output and prices
may be an implication of the zero interest rate policy that became more detrimental to the
economy in a way that people would rather hold money than invest in interest-bearing assets,
curtailing investment growth that would rather improve economic activity. Deflation
expectations in this sense give households the incentive to delay consumption and investment
expenditures today in order to benefit from lower prices in the future. These future prices are
extrapolated based on their deflation expectations, where intertemporal substitution effects
reduce current spending. Likewise, this adds more to deflationary pressures given the
passiveness of the Japanese households35. Moreover, Posen (2012) argues that the Japanese population “appears to fear major changes in established relationships more than economic
stagnation at their current high level of wealth”.
34However, inadequate allowance for downside risk was built into monetary policy, as evidenced by the fact that once actual inflation and
growth numbers came in weaker than expected, interest rates ended up being higher than were called for under the Taylor rule (Ahearne et al, 2002).
35 A recent article by The Japan Timesstated that “Japanese companies and households prefer to sit on their cash rather than spend it”, which
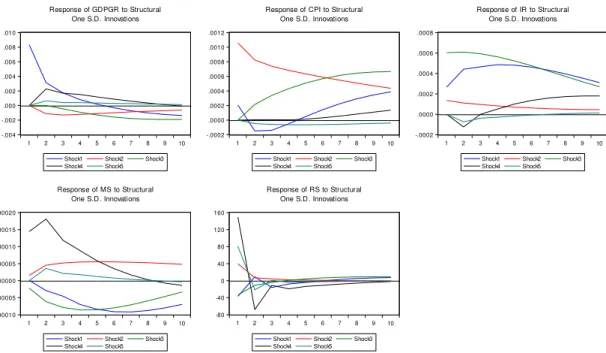
22 4.4 QE Policy
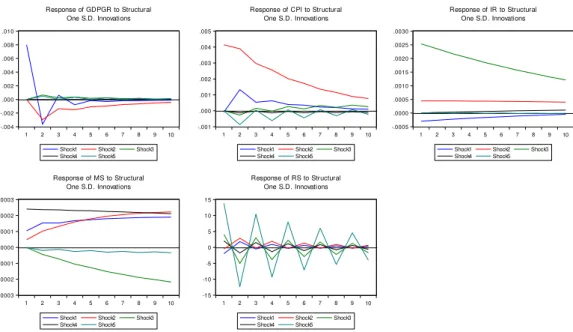
To evaluate the QE policy, we restrict the sample period from 2001:Q2 to 2008:Q436, as shown in Figure 5. A positive shock to bank reserves (shock 5) appears to improve economic
activity, albeit with a relatively small impact, while inflation appears to be on the downside.
This response may be an explanation of the deflationary pressure during the early 2000s and an
outcome of Japan’s lost decade during the 1990s, where prices started to pick up after seven
quarters given the QE policy.
-.004 -.002 .000 .002 .004 .006 .008 .010
1 2 3 4 5 6 7 8 9 10
Shock1 Shock2 Shock3
Shock4 Shock5 Response of GDPGR to Structural
One S.D. Innovations
-.0002 .0000 .0002 .0004 .0006 .0008 .0010 .0012
1 2 3 4 5 6 7 8 9 10
Shock1 Shock2 Shock3 Shock4 Shock5 Response of CPI to Structural
One S.D. Innovations
-.0002 .0000 .0002 .0004 .0006 .0008
1 2 3 4 5 6 7 8 9 10
Shock1 Shock2 Shock3
Shock4 Shock5 Response of IR to Structural
One S.D. Innovations
-.00010 -.00005 .00000 .00005 .00010 .00015 .00020
1 2 3 4 5 6 7 8 9 10
Shock1 Shock2 Shock3
Shock4 Shock5 Response of MS to Structural
One S.D. Innovations
-80 -40 0 40 80 120 160
1 2 3 4 5 6 7 8 9 10
Shock1 Shock2 Shock3 Shock4 Shock5 Response of RS to Structural
One S.D. Innovations
Figure 5. JAPAN: Impulse response functions to structural one S.D. innovations, period of QE policy
As prices start declining, particularly due to a demand shock, risk of adverse dynamics
increases and nominal interest rates will likely decline. As long as households believe that
money supply will be changed in the future, they will not respond to increases in money supply
today which they see as temporary changes (Krugman, 1998). Households would prefer to hold
money instead of interest-bearing financial assets as they derive utility from the liquidity of
money. Thus, when interest rates are artificially at zero levels, the marginal utility of holding
36 Although the initial QE policy ended in 2006, we extend the sample period until 2008 to account for the lag effect of the policy as well as
23
more money is likewise almost zero. The classic liquidity trap presupposes that monetary policy
becomes less effective since demand for money is more likely or less infinitely elastic at interest
rates close to or at zero.
On the other hand, a study by Berkmen (2012) agrees with our finding that the QE policy
does not seem to boost economic activity and inflation. As Krugman (1998) states, additional
monetary easing would be less effective when interest rates are almost zero; the monetary base
and bonds become perfect substitutes. Even if the BOJ increases its money stock given the
declines in prices, economic activity would not jump off because nominal interest rates are
already at zero and can no longer be reduced further. This can be suggestive of the validity and
effectiveness of the policy measure, where Japan was the first proponent of an unconventional
monetary policy in solution to its deflation and economic growth dilemma. It has been using
dramatic numbers of bond purchases as part of a massive experiment37 to wrestle the economy out of its long slump.
According to a research by the Mizuho Research Institute (The Japan Times, 2015), the BOJ
will probably be forced to stop its qualitative and QE policy by 2020 because it will have bought
most of the long-term Japanese bonds held by banks. Yukio Noguchi, an adviser to the Institute
of Financial Studies of Waseda University in Tokyo (2015), stated that “monetary easing is not
working. It has not increased money stock as much. There is an apparent lack of fund demand
in the economy, banks have only increased the balance of their own current accounts, but not
using them to increase loans to business that would expand the economy.” Monetary stimulus
does not seem to trickle down at the household level that would then boost domestic demand
or firms.
37 The series of burst of bond buying is the first arrow of Abenomics, a planned launched by Prime Minister Shinzo Abe in April 2013 that
24
Unlike Japan, the euro area, which has been indecisive on monetary policy easing, may have
to speed up its QE policy as it continues to face average growth and near-zero inflation. The
euro area may be running a current account surplus but a further downturn in China’s growth
may pose a threat considering that its economy is overly dependent on external demand (The
Japan Times, 2015). The euro area should be able to counter such decrease by generating
domestic demand, within and among member states.
According to Eggertsson and Woodford (2003), to credibly promise to raise the price level
– in the present and the future – is one of the fundamental challenges faced by policymakers in
a deflationary environment. Thus, another policy option, the duration effect, can be employed
under the commitment to maintain near zero interest rates far into the future or to make it a
permanent supply of liquidity as suggested by Krugman (1998). Such commitment, as Ueda
(2001) states, “will contain expectations of a future rise in short-term interest rates”, and
households would then revise their expectations towards increasing prices, thus, the need to
spend now that leads to reviving inflation and improving economic activity.
However, then BOJ Governor Masaru Hayami (1998) stated that “the BOJ’s policy is to seek
stable prices, not inflation or deflation”38, implying a credibility problem of its policy stance.
Therefore, households do not see further price increases which then impede increases in
domestic demand and continuous slack in economic activity. More so, there has been an
uncoordinated deflationary macroeconomic policy in Japan. The Ministry of Finance and BOJ
have been passive in dealing with financial regulators, pointing to who needs to act first. In
relation, Posen (2003) argues that “Japan’s economic troubles are the result of politically driven
and economically self-defeating policy decisions that turned the normal recession into a severe
and accelerating decline”.
25
Similarly, this lack of coordination is quite the case happening in the euro area today. Posen
(2003) sees how the ECB fails to loosen monetary policy or believe that stronger growth is
sustainable with inflation until structural reforms are met by member states. In addition, there
is difficulty in dealing with euro area members with significantly diverging performance when
it comes to lowering interest rates and meeting its harmonised inflation rates. Posen (2003)
argues three inherent difficulties of the ECB’s 2% inflation target: (1) the ‘or less’39 target
creates room for deflationary bias, where the ECB is more aggressive in offsetting price rises
than declines; (2) target level is too low for a euro area average40; and (3) some countries will suffer from divergence between ECB policy and their own cyclical needs41. Studies such as Reifschneider and Williams (2000), Blinder (2000), Kato and Nishiyama (2001) and the IMF
(2003) would likewise suggest to set targets that provide ‘buffer zones’ against deflation risks
leaning towards increasing inflation rate targets. Hunt and Laxton (2001) adds that as the
inflation rate target increases, the probability of reaching the zero bound would decline
significantly.
5 Conclusion
Posen (2003) articulated that “it is possible for an advanced economy to have a bad time but
still not fall into a Japanese-style ongoing stagnation”. Looking at Posen’s (2003) identification
of the characteristics42 of Japan’s ‘negative economic syndrome’, we see similarities in the variable responses to a contractionary monetary policy shock, which may suggest similarity of
the path the euro area may take if it will not be vigilant on how monetary policy is conducted
given its past and current situation, as well as the future implications of its action or inaction
39 As long as the inflation target is above 2%, implying that lower is always better, even near or below the 2% target
40 Smaller and structurally reforming EU economies should have higher inflation, and larger and developed economies could be less than 2%. 41 Given the lack of sychronisation between the business cycles of euro area economies and fiscal transfers among the economies; especially
with countries like Ireland, the Netherlands, and Spain on sustained trends of improvement and unemployment, while countries like Germany and Italy are on secular growth downtrends, monetary policy will not simply balance out over time.
42 The four elements would include: incomplete financial liberalisation, macroeconomic policy and division and deflationary bias, financially
26
today. Monetary easing would result in stronger demand for goods and services that would push
wages and other costs higher, which may influence the rate of inflation. However, monetary
tightening can be pursued to limit inflation but severe tightening would result in deflation, when
sustained price declines may result in layoffs or bankruptcies from the lack of business profit.
In addition, with the continuous debt situation in the euro area, the link of debt and deflation
causes complicated disturbances in the interest rate, particularly a fall in the nominal interest
rates and a rise in the real interest rates. Given the sustained weakness on private spending and
budget shortfalls, fiscal and monetary policy coordination can be sufficient to boost economic
activity and keep inflation at positive rates. Likewise, the stability of its financial system should
be further strengthened allowing for improved credit worthiness of firms and households.
On the other hand, an important avenue for future research is to look at how the demographic
composition of these two entities affects monetary policy effectiveness. For example, Carvalho
and Ferrero (2014) argue that demographic transition puts downward pressure on the natural
real interest rate, which some monetary policy rules do not internalise to capture the effect of
an increase in life expectancy. Although the euro area, on the average, has not yet reached an
ageing population similar to Japan, a graying society in the recent years is becoming evident in
Italy, Portugal and Spain with a shrinking population, while Germany holds the lowest birthrate
in the world.
REFERENCES
van Aarle, Bas, Harry Garretsen, and Niko Gobbin. 2003. “Monetary and Fiscal Policy Transmission in the
Euro-area: Evidence from a Structural VAR analysis.” Luxembourg: Office for Official Publications of the
European Communities.
Ahearne, Alan, Joseph Gagnon, Jane Haltmaier, and Steve Kamin, and Christoper Erceg, Jon Faust, Luca Guerrieri, Carter Hemphill, Linda Kole, Jennifer Roush, John Rogers, Nathan Sheets and Jonathan Wright. 2002. “Preventing Deflation: Lessons from Japan’s Experience in the 1990s.” International Finance Discussion Papers, Board of Governors of the Federal Reserve System.
Amisano, Gianni, Roberta Colavecchio, and Gabriel Fagan. 2014. “A money-based indicator for deflation
risk.” DEP (Socioeconomics) Discussion Papers, Macroeconomic Series, University of Hamburg.
Berkmen, Pelin. 2012. “Bank of Japan’s Quantitative and Credit Easing: Are They Now More Effective?” IMF Working Paper.
27
Bernanke, Ben, Jean Boivin, and Piotr Eliasz. 2005. “Measuring the Effects of Monetary Policy: A Factor
-Augmented Vector Autoregressive (FAVAR) Approach.” NBER Working Paper No. 10220.
Blomberg, S Brock and Ethan Harris. 1995. “The Commodity-Consumer Price Connection: Fact or Fable?” Economic Policy Review, Federal Reserve Bank of New York.
Boianovsky, Mauro. “The IS-LM Model and the Liquidity Trap Concept: From Hicks to Krugman.”
Boivin, Jean and Marc Giannoni. 2003. “Has Monetary Policy Become More Effective?” NBER Working Paper 9459.
Boivin, Jean and Marc Giannoni. 2002. “Assessing Changes in the Monetary Transmission Mechanism: A VAR
Approach.” Federal Reserve Bank of New York, Economic Policy Review 8(1):97-112.
Bordo, Michael and Andrew Filardo. 2004. “Deflation and Monetary Policy in a Historical Perspective:
Remembering the Past or Being Condemned to Repeat It?” Working Paper 10833, National Bureau of
Economic Research.
Christiano, Lawrence, Martin Eichenbaum, and Charles Evans. 1998. “Monetary Policy Shocks: What Have
We Learned and to What End?” National Bureau of Economic Research.
Clarida, Richard, Jordi Gali, and Mark Getler. 2000. “Monetary Policy Rules and Macroeconomic Stability:
Evidence and Some Theory.” Quarterly Journal of Economics 115(1):147-80.
Coenen, Gunter and Volker Wieland. 2000. “A Small Estimated Euro Area Model with Rational Expectations
and Nominal Rigidities,” European Central Bank Working Paper Series No 30.
Coenen, Gunter, Athanasios Orphanides, and Volker Wieland. 2003. “Price Stability and Monetary
Effectiveness when Nominal Interest Rates are Bounded at Zero.” CEPR Discussion Papers 3892.
Cubero, Julián, Rodrigo Fabio, Rodolfo Mendez Marcano, Sara Balina Vieites, Diana Posada Restrepo, Alejandro Buesa Olavarrieta and Alberto Ranedo Blanco. 2015. “Risk of Deflationary Spiral and Monetary
Policy”. Global Economic Outlook, First Quarter 2015. BBVA Research.
Demiralp, Selva, Kevin Hoover, and Stephen Perez. 2012. “Still puzzling: Evaluating the Price Puzzle in an
Empirically Identified Structural Vector Autoregression.” Social Science Research Network.
De Santis, Roberto. 2012. “The Euro Area Sovereign Debt Crisis: Safe Haven, Credit Rating Agencies and the
Spread of the Fever from Greece, Ireland and Portugal.” Working Paper Series No. 1419, European Central
Bank.
Eggertsson, Gauti and Michael Woodford. 2003. The Zero Bound on Interest Rates and Optimal Monetary Policy. Brookings Papers on Economic Activity.
Fagan, Gabriel, Jerome Henry, and Ricardo Mestre. 2001. “An Area-Wide Model (AWM) for the Euro Area”. European Central Bank Working Paper Series No 42.
Favero, Carlo. 2001. Applied Macroeconometrics. Princeton University Press.
Fisher, Irving. 1933. The Debt-Deflation Theory of Great Depressions. Digitised copy from the Federal Reserve Bank of St Louis.
Gali, Jordi, and Mark Getker. 1999. “Inflation Dynamics: A Structural Econometric Analysis.” 44(2): 195-222. Groth, C. 2011. Lecture notes in macroeconomics. Chapter 17: Inflation and Capital Accumulation: The Sidrauski
Model.
Harvey, Martin. 2014. “Is Europe heading for Japanese-style deflation?” Threadneedle International Limited, Columbia Management.
Hunt, Benjamin and Douglas Laxton. 2001. “The Zero Interest Rate Floor (ZIF) and Its Implications for
Monetary Policy in Japan.” IMF Working Paper 01/186.
Ito, Takatoshi and Frederic Mishkin. 2004. “Two Decades of Japanese Monetary Policy and the Deflation
Problem.” NBER Working Paper No 10878.
Ito, Takatoshi and Andrew K Rose. 2006. Monetary Policy under Very Low Inflation in the Pacific Rim. NBER-East Asia Seminar on Economics. Volume 15.
Kelly, Logan, William Barnett, and John Keating. 2010. “Rethinking the Liquidity Puzzle: Application of a
New Measure of the Economic Money Stock.” Working Paper Series in Theoretical and Applied Economics
No. 201002. University of Kansan, Department of Economics.
Kilian, Lutz and Simone Manganelli. 2007. “Quantifying the Risk of Deflation.” Journal of Money, Credit and Banking, Volume 39, Issue 2-3, pp. 561-590.
Kiyotaki, Nobuhiro and John Moore. 1997. “Credit Cycles.” The Journal of Political Economy, Vol. 105, No. 2, pp 211-248, The University of Chicago Press.
Kumar, Manmohan, Taimur Baig, Jorg Decressin, Chris Faulkner-MacDonagh, and Tarhan Feyzioglu.
2003. “Deflation: Determinants, Risks, and Policy Options – Findings of an Interdepartmental Task Force.”
International Monetary Fund.
Leeper, Eric and David Gordon. 1992. “In Search of the Liquidity Effect.” Journal of Monetary Economics 29, pp. 341-369.
28
Lütkepohl, Helmut and Markus Krätzig. 2004. Applied Time Series Econometrics. Cambridge University Press. Mihira, Tsuyoshi and Shigeru Sugihara. 2000. “A Structural VAR Analysis of the Monetary Policy in Japan.”
Discussion Paper No. 94, Economic Research Institute, Economic Planning Agency.
Monticelli, Carlo and Oreste Tristani. 1999. “What Does the Single Monetary Policy Do? A SVAR Benchmark
for the European Central Bank.” Working Paper Series No. 2, European Central Bank.
Nakahira, Kazuhiko. 2009. “A Structural VAR Analysis of the Monetary Policy Stance in Japan.” The International Journal of Economic Policy Studies.
Oda, Nobuyuki and Kazuo Ueda. 2005. “The Effects of the Bank of Japan’s Zero Interest Rate Commitment
and Quantitative Monetary Easing on the Yield Curve: A Macro-Finance Approach.” Bank of Japan Working
Paper Series No. 04-E-6.
Palley, Thomas. 2008. “Keynesian Models of Deflation and Depression Revisited: Inside Debt and Price
Flexibility.” University of Massachusetts Amherst, Political Economy Research Institute, Working Paper
Series No. 169.
Piazza, Roberto. 2015. “Self-fulfilling deflations.” Bank of Italy.
Posen, Adam. 2003. “Is Germany Turning Japanese?” Institute for International Economics Working Paper No. 03-2.
Raddatz, Claudio and Roberto Rigobon. 2003. “Monetary Policy and Sectoral Shocks: Did the FED react
properly to the High-Tech Crisis?” NBER Working Paper No 9835.
Reifschneider, David and John Williams. 2000. “Three Lessons for Monetary Policy in a Low-Inflation Era.” Journal of Money, Credit and Banking Vol. 32 No. 4, Ohio State University Press.
Rotemberg, Julio J., and Michael Woodford. 1998. “An Optimization-Based Econometric Framework for the
Evaluation of Monetary Policy: Expanded Version.” NBER Technical Working Paper Series.
Shiratsuka, Shigenori. 2003. “Asset Price Bubble in Japan in the 1980s: Lessons for Financial and
Macroeconomic Stability.” Discussion Paper No. 2003-E-15, Institute for Monetary and Economic Studies, Bank of Japan.
Sidrauski, Miguel. 1967. “Rational Choice and Patterns of Growth in a Monetary Economy.” The American Economic Review, Volume 57, Issue 2, pp 534-544.
Stevis, Matina. 2014. “OECD Warns Euro Area of Higher Deflation Risks.” The Wall Street Journal, Accessed on September 3, 2015.
Svensson, Lars. 2006. “Monetary Policy and Japan’s Liquidity Trap.” Princeton University CEPR and NBER. Tasos, Anastasatos and Theodoros Stamatiou. 2014. “Is Deflation a Risk for Greece?” Economy and Markets,
Volume 9, Issue 3. Eurobank Research.