Abstract
The mineral exploration activity consists of a set of successive stages that are interdependent on each other, in which the main goal is to discover and subsequently evaluate a mineral deposit for the feasibility of its extraction. This process involves setting the shape, dimensions and grades for eventual production. Geological model-ing determines the orebody’s possible format in subsoil, which can be done by two approaches: vertical sections (deterministic methods) or geostatistical methods. The latter approach is currently being preferred, as it is a more accurate alternative and therefore, more reliable for establishing the physical format of orebodies, especially in instances where geologic boundaries are soft and/or with widely spaced sample information. This study uses the concept of indicator kriging (IK) to model the geo-logic boundaries of a limestone deposit located at Indiara city, Goiás State, Brazil. In general, the results indicated a good adherence in relation to samples. However, there are reasonable differences, particularly in lithological domains with a small number of samples in relation to the total amount sampled. Therefore, the results showed that there is a need for additional sampling to better delineate the geological contacts, espe-cially between carbonate and non-carbonate rocks. Uncertainty maps conirmed this necessity and also indicated potential sites for future sampling; information that would not be obtained by usage of deterministic methods.
Keywords: mineral exploration, modeling, indicator kriging, uncertainty.
Paulo Elias Carneiro Pereira
Professor Auxiliar
Universidade Federal de Goiás - UFG Unidade Acadêmica Especial de Engenharia Catalão – Goiás – Brasil
Marcos Napoleão Rabelo
Professor Adjunto II
Universidade Federal de Goiás - UFG Unidade Acadêmica Especial de Matemática e Tecnologia Catalão – Goiás – Brasil [email protected]
Carlos Cordeiro Ribeiro
Professor Adjunto
Universidade Federal de Goiás - UFG Unidade Acadêmica Especial de Engenharia Catalão – Goiás – Brasil
Henrique Senna Diniz-Pinto
Professor Associado
Universidade Federal de Goiás - UFG Unidade Acadêmica Especial de Engenharia Catalão – Goiás – Brasil
Geological modeling by
an indicator kriging approach
applied to a limestone deposit
in Indiara city - Goiás
Mining
Mineração
http://dx.doi.org/10.1590/0370-44672016700113
1. Introduction
A mining project consists of a set of successive and interdependent stages, culminating or not in mineral deposit exploitation. It begins with an exploration phase classiied into several consecutive and interconnected stages. According to its progress, this phase involves increases in spending and decreases in associated geological risk (Moon and Whateley, 2006).
Characterization of the miner-alized zones and surroundings are controlled by the knowledge of their internal characteristics, which are understood with sampling and surface outcrop analyses. These provide
infor-mation for the deposit’s detailed assess-ment, known as delineation (Sinclair and Blackwell, 2004); this step is also called geological modeling by authors such as Rossi and Deutsch (2014).
A geologic model can be obtained through various approaches. The tra-ditional one is based on the interpre-tation of geological variables in cross sections and planning maps, where such interpretations are extended to three-dimensional solids. This pro-cess is called deterministic geological modeling, since it does not involve
quantifying the uncertainty associated with the model. Another approach that
is particularly used when data is too widely spaced to reliably delineate the model, is to obtain a geologic model from mathematical methods (polygons or nearest neighbor), or geostatistical ones that can follow two treatments: (i) a deterministic model that estimates the category in each location; and (ii) a model that gives the probability of each category occuring in each location within the deposit or domain (Rossi and Deutsch, 2014).
characterization of geological domains and reduce uncertainty about geological contact positions. One of these tech-niques is indicator kriging (IK) (Emery and González, 2007). Indicator-based techniques that involve the linking of an indicator to each geological attribute (i.e. geological domain), provide the probability of each geological variable to be present at each unsampled location
(Rossi and Deutsch, 2014). From this information (probability), it is possible to establish the uncertainty, treated also by simulation techniques. This matter can be found, among others, in the works of Souza and Costa, (2013) and Yamamoto et al., (2015).
Herein the indicator kriging ap-proach was used for the geological modeling of a limestone deposit located
in the city of Indiara, State of Goiás, Brazil. The Calcário Ouro Branco and Fillercal companies, belonging to the Pirineus business group that owns the mining rights on site, provided the data used. The purpose of this article is to apply a geostatistical method approach (indicator kriging) to geological model-ing to propose an alternative geologic model for the mining enterprise.
The study’s site is located approxi-mately 15 km from Indiara’s city center, along the BR-060 margins, towards Goiânia, the capital of Goiás State. The samples collected, provided by Calcário Ouro Branco and Fillercal, were taken from the current Francisco Pereira mine, with its approximate coordinates being 17°7'45.87"S and 49°52'13.85"W (Fig-ure 1). The enterprise, Pirineus group, has administrative installations, mineral processing and storage facilities, and three mines in operation, each of them mined using the open pit method.
Calcário Ouro Branco has an in-frastructure for producing agricultural limestone, while Fillercal has one for iber cement, animal feed, texture, ine
and superine production lines; the last two apply to the paint industry. Pre-dominantly, current extraction takes place in the Francisco Pereira mine, which is the area to be analyzed herein.
The current mine (Francisco Pereira) was established from a mineral reserve based on estimates realized by the Inverse Squared Distance (ISD) method. The geologic model was previously obtained by the company through the method of vertical sections (union of geological sec-tions to form three-dimensional solids), a model that did not adequately reproduce the geological bodies.
The local site, according to Figure 1, belongs to the Anicuns-Itaberaí Se-quence. Studies from Lacerda Filho et
al., (1999), Pimentel et al., (2000),
Bar-bosa, (1987) apud Laux, (2004), Laux
et al., (2001, 2002) apud Laux, (2004),
Laux et al., (2010), Hasui, (2012) and
Navarro et al., (2015) indicate that the
Anicuns-Itaberaí Sequence (890-830 Ma) is a metavolcano-sedimentary sequence, neoproterozoic, belonging to the Goiás Magmatic Arc. This sequence is exposed along the contact between the eastern part of Goiás Magmatic Arc and the Anápolis-Itauçu high-grade ter-rain, and is represented predominantly by amphibolites and metapelites, with iron formations, cherts, marbles and ultramaic rock subordinations. There is also a presence of limestone and marble lenses interlayered with schists.
2. Study Area
Figure 1
Study area location and position of the samples (Modified from Araújo
et al., 1980 referenced Fumes, 2014).
3. Materials and methods
The sampled data consisted of 455 samples obtained from 15 rotary drilled holes and 13 trenches/channels, with a pre-dominant sample length of 5 m, coincident with the average bench height of the
cur-rent mine geometry. The drillhole samples are arranged in a grid with an average spacing of 230m x 200m, oriented to NE and SE, respectively. Available analytical data – CaO and MgO grades – are derived
a quantitative information improvement. The sampled data were irst submit-ted to validation and similarity analyses, comparing analytical results with their geological descriptions; the latter being primordial in supporting the classiication of lithological domains.
Information concerning compa-ny-adopted classification for its prod-ucts, mainly chemical (CaO and MgO), amongst the carbonate rock classiications proposed by Machado (2016), was used as basement for the lithological unit clas-siication (Table 1). The domains were
classiied as Calcitic Limestone (CLC), Magnesium Limestone (MAG), Dolomitic Limestone (DOL), Impure Limestone (CLI) and Volcanic or Metavolcanic (VMV). The last two represent limestone interlayered carbonate rocks and non-carbonate rocks respectively.
Domain/Category Chemical Criteria
CLC Impurity < 25%, CaO + MgO > 38% and MgO < 5%
MAG Impurity < 25% CaO + MgO > 38% and MgO ≥ 5% and MgO ≤ 12% DOL Impurity < 25%, CaO + MgO > 38% and MgO > 12%
CLI Impurity ≥ 25% and ≤ 50%
VMV Impurity > 50%
Table 1 Classification criteria for lithological unities/categories.
A statistical analysis of both variables was performed on each unit to learn about the statistical distribu-tion of each and verify the presence of outliers. This analysis identiied two outliers, both in the DOL unit, which
were removed. Therefore, subsequent steps were carried out on 453 samples.
Lithological domains were coded and then their indicator variables were elaborated, one for each unit. In this step, a value of 1 was assigned to
in-dicate the presence of a domain, and 0 to indicate the unit absence. For the lithological domain LDi at location x, the indicator variable transformation was performed according to the follow-ing equation:
I
i(x) =
1
if
x
∈
LD
i0 otherwise
Where i, in this case, varies from domain 1 to domain 5.
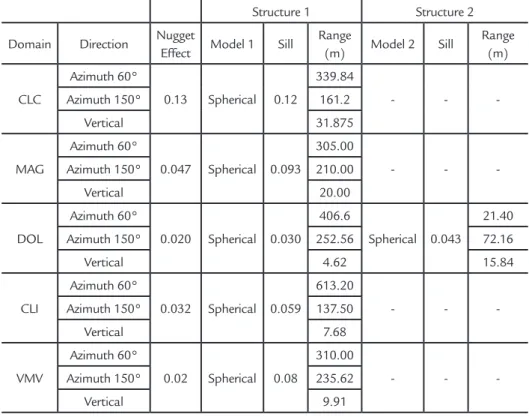
For each indicator variable, three semivariograms were calculated and modeled; two in the XY plane, that is, a horizontal plane, and one in the vertical plane, that is, with a 90º dip. Such step is fundamental because it quantiies the geological continuity of each lithological
domain. All experimental semivariogram model ittings (Figure 2) were performed by a simple spherical structure, except for the indicator variable assigned to the dolo-mitic limestone domain, whose itting was performed by two spherical structures. Table 2 shows the indicator semivario-gram parameters for each domain.
The ik3d resulting model was
re-ined in SGeMS by a script to calculate: (i) the highest probability – between ive probabilities – at each point estimate and assign to this value, the corre-sponding domain code; and (ii) the un-certainty associated with the estimate, calculated as the subtraction between the maximum probability (one) and the highest probability.
(1)
Structure 1 Structure 2
Domain Direction Nugget
Effect Model 1 Sill
Range
(m) Model 2 Sill
Range (m)
CLC
Azimuth 60°
0.13 Spherical 0.12
339.84
- -
-Azimuth 150° 161.2
Vertical 31.875
MAG
Azimuth 60°
0.047 Spherical 0.093
305.00
- -
-Azimuth 150° 210.00
Vertical 20.00
DOL
Azimuth 60°
0.020 Spherical 0.030 406.6
Spherical 0.043
21.40
Azimuth 150° 252.56 72.16
Vertical 4.62 15.84
CLI
Azimuth 60°
0.032 Spherical 0.059
613.20
- -
-Azimuth 150° 137.50
Vertical 7.68
VMV
Azimuth 60°
0.02 Spherical 0.08
310.00
- -
-Azimuth 150° 235.62
Vertical 9.91
Figure 2
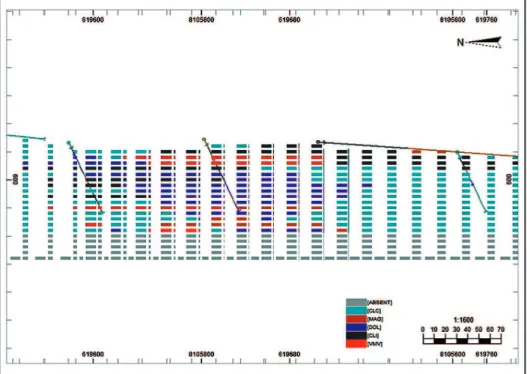
Figure 3 Example of a cross section
with comparison between lithological domains of the samples and the block model.
When comparing sample propor-tions/relative frequencies with respective proportions obtained by the probabilistic model (Table 3), there was supposedly an overestimation of the CLC domain, while the remaining domains are apparently underestimated. The differences between estimated and sampled domains are higher in units with small relative frequencies, in both the probabilistic geological model and
sampling. The biggest difference is assigned to the CLI domain, whose modeled relative frequency was 50% lower than the sampled relative frequency/proportion. By calculat-ing the average deviation from the sample data, it has been observed that the model proportions, on average, differ 23.7%, negative, from the sample proportions.
Differences between the proba-bilistic model and the observed reality
(samples) can be a consequence of the semivariogram models used, which showed high values of the Nugget Effect, mainly due to the small amount of data available. By increasing the amount of samples, particularly in areas with high incidence of geological contacts – between carbonate and non-carbonate rock – there might be a substantial improvement in the geologic model.
The estimates of the probabilities by indicator kriging were made from a block model with 10 m x 10 m x 5 m dimensions. These dimensions were deined on X and Y in order to have a higher detail level in the geological contacts. The value used is close to half
the width of the blocks in the current mine’s geologic model (25 m). The block dimension in Z was chosen this way for being: (i) the most frequent sample length value; (ii) less than all ranges in the semivariograms; and (iii) a multiple of the current bench
height (10 m).
The information contained in the resulting geologic model demonstrates: probability of occurrence in each do-main – estimated by indicator kriging; domain code with the highest prob-ability of occurrence; and uncertainty.
4.Results and discussions
Comparative analysis in each geo-logical model cross section between es-timated lithological domain and sample lithological domain evidences good concordance between them. Thus, in general terms, the probabilistic approach was efficient in describing orebody
shapes. Moreover, the limestone rocks are installed in the Anicuns-Itaberaí metavolcano-sedimentary sequence (neoproterozoic) in the form of lenses. Structurally, these lenses are positioned on the lank of a large anticline whose axis plunges gently to the west. In the
geologi-cal model generated by indicator kriging, the geometry of the calcareous bodies is compatible with the geometry of the local geology of the limestone lenses. Figure 3 shows an example of a cross section with the block model obtained by indicator kriging and the samples.
Domain Proportions Difference (%)
Samples Model
CLC 0.51 0.71 +39.2
MAG 0.17 0.10 -41.2
DOL 0.10 0.07 -30.0
CLI 0.10 0.05 -50.0
VMV 0.11 0.07 -36.4
Figure 4
Example of a geologic
model cross section with values of uncertainty, which represents the uncertainty in geologic delineation.
5. Conclusions
The indicator kriging geological modeling approach has proved more ef-icient than the traditional cross section method, since it allows more consistent elaboration of the model, especially in limited sample information cases. In such situations the establishment of geo-logical continuity between sections is an interpretative task, very dependent on the professional’s prior knowledge. Moreover, it is speculative, since it is based only on subjective inferences, often based on scarce evidence.
The comparative analysis of the
resulting geologic model against the ob-served reality (i.e. samples) demonstrated a reasonable deviation, particularly in the less proportionately signiicant lithological domains (MAG, DOL, CLI and VMV). This fact is partially a consequence of the widely spaced sampling grid used (230 m x 200 m) that was insuficient for describ-ing geological variations at smaller scales and provide semivariogram models with smaller Nugget Effects. Therefore, it is sug-gested that additional samples be collected in order to reine the resulting model.
The uncertainty model allowed the
establishment of sites with high geological risk. This provides guidelines for future sampling programs to deine geological contacts with more accuracy, particularly between carbonate and non-carbonate rocks. The information about uncertainty and a non-subjective modeling, based on geological continuity quantiication (semivariograms), are the differential of this approach, particularly when widely spaced samples are available. Moreover, uncertainty quantiication would not be obtained from the traditional cross sec-tion method.
Three-dimensional mapping of the uncertainties indicates a need to conduct additional sampling to achieve a more reliable delineation of
geological contacts. Such additional sampling would be required even in the mine operation area, as seen in the Figure 4 example, which shows a cross
section perpendicular to operation benches. It is observed in this section that uncertainty levels reach 71%.
References
EMERY, X., GONZÁLEZ, K. E. Probabilistic modelling of of lithological domains and its application to resource evaluation. The Journal of the South African Institute of Mining and Metallurgy, v. 107, p. 803-809, 2007.
FUMES, R. A. Caracterização petrográica, estrutural e metamórica das rochas da região de Indiara (GO). Rio Claro: UNESP, 2014.
HASUI, Y. Sistema Orogênico Tocantins. In: HASUI, Y. et alli. (Orgs). Geologia do Brasil. São Paulo: Beca, 2012. 900 p. (Cap. 14a, p. 289-325).
LACERDA FILHO, J. V. de, REZENDE, A., SILVA, A. da. (Orgs). Geologia e Recursos Minerais do Estado de Goiás e Distrito Federal. Goiânia: CPRM, SMET,
METAGO, 1999.
LAUX, J. H. Evolução do Arco Magmático de Goiás com base em dados geocro-nológicos U-Pb e Sm-Nd. (Evolution of Goiás Magmatic Arc based on geochronological
data U-Pb and Sm-Nd). Brasília: Instituto de Geociências, Universidade de Brasília, 2004. 113 f. (Tese de Doutorado).
Received: 1 August 2016 - Accepted: 7 March 2017.
Anicuns-Itaberaí volcano-sedimentary sequence, Goiás Magmatic Arc: new geochemical and Nd-S isotopic data. Geochimica Brasiliensis, v. 24, n. 1, p. 13-28, 2010.
MACHADO, F. B. Calcário. Brazil: UNESP. 2016 <http://www.rc.unesp.br/
museudpm/rochas/sedimentares/calcarios.html>. Accessed 25 May 2016.
MOON, C. J., WHATELEY, M. K. G. Reconnaissance Exploration. In: ____.
Introduction to Mineral Exploration. (2 ed.). India: Blackwell Publishing, 2006.
496 p. (Cap. 4, p. 52-69).
NAVARRO, G. R. B., FUMES, R. A., ZANARDO, A., OLIVEIRA, M. A. F. de, LUVIZOTTO, G. L. Petrograia e geoquímica das rochas metamóricas intercaladas em gnaisses do Arco Magmático de Goiás na região de Indiara (GO). Revista do Instituto de Geociências Série Cientíica – USP, v. 15, n. 1, p. 29-44, 2015.
PIMENTEL, M. M., FUCK, R. A., GIOIA, S. M. C. L. The neoproterozoic Goiás Magmatic Arc, central Brazil: a review and new Sm-Nd isotopic data. Revista Brasileira de Geociências, v. 30, n. 1, p. 35-39, 2000.
ROSSI, M. E. & DEUTSCH, C. V. Geological controls and block model-ing. In: ____. Mineral Resource Estimation. Dordrecht: Springer, 2014. 332 p.
(Cap. 3, p. 29-50).
SINCLAIR, A. J., BLACKWELL, G. H. Geologic control of mineral inventory estimation. In: ____. Applied Mineral Inventory Estimation. Cambridge: Cambridge
University Press, 2004. 377 p. (Cap. 2, p. 31-58).
SOUZA, L. E. de, COSTA, J. F. C. L. Sample weighted variograms on the se-quential indicator simulation of coal deposits. International Journal of Coal Geology,
v. 112, p. 154-163, 2013.