Abstract
The estimation of the ship hull girder ultimate strength under vertical bending moments as close to real behavior is vital both for design stage or seagoing life. The maximum load carrying capacity of ship hulls called ultimate strength depends on a number of factors including the strength of the structural material, initial distortions, dimensions and layout of the structural components, the component discretization (idealization) of hull girder section. In this study, the main target is to evaluate the effects of hull girder section component discretization, initial deflection of plates and residual welding stress and 50% corrosion margin for individ-ual structural components on the ultimate hull girder strength. Within this context, hull girder ultimate strength calculations are carried out for ten benchmark ships’ cross sections for validation of HULT developed by authors, firstly. Next, to reflect the effect of diverse key factors, selected ships among ten are analysed for different scenarios using progressive collapse analysis based meth-od HULT and with IACS-CSR formulations. Critical collapse moment values of ten mid-ship cross sections are calculated and shown to agree well with the results of previous studies. As a result, both the accuracy of HULT, as well as the effects of diverse key factors on ultimate strength are shown clearly by case studies.
Keywords
Ultimate Strength, Progressive Collapse, Smith Method, Ortho-tropic Panel, Component Discretization, Initial Distortions.
Effects of Key Factors on Hull Girder Ultimate Strength
Estimation by Progressive Collapse Calculations
1 INTRODUCTION
Unlike most land based structures, ships and offshore structures operates in a dynamic and unstable sea environment. For the most part of loads caused by sea conditions and own cargos are much less
than the structural capacity of the ship’s hull girder. However, these structures must not only be
Hasan Ölmez a
Ertekin Bayraktarkatal b
a Karadeniz Technical University
Trabzon, Turkey, [email protected]
bİstanbul Technical University İstanbul,
Turkey, [email protected]
http://dx.doi.org/10.1590/1679-78252509
designed according to be capable of withstanding normal loads, but also with extreme sea condition scenarios.
At this point, the ultimate strength theme that show us maximum load carrying capacity of hull girder under bending moment is considered very important in the academic area and classification societies. The structural components that form the ships and offshore structures are exposed to large vertical bending moments and especially compression or tension forces in the longitudinal axis in case of hogging and sagging under bad sea conditions. At this point, the ultimate load carrying capacity of the ship is critical measure. If the vessel exposed to primary loads over this critical value during hog-ging and saghog-ging actions, the hull girder may collapse like breaking in two or something more cata-strophic losses (see Figure 1). During these actions, a ship experiences many types of loads divided into specific categories. The two most critical loads in terms of the overall hull girder strength are static calm water loads and the low frequency dynamic loads caused by waves. These loads produce a distribution of longitudinal bending moments and compression/tension loads. If the bending moment value exceeds the ultimate strength value of the hull girder, the ship can fail due to buckling and pro-gressive collapse of the compressed part (Smith, 1997). In recent years, the practical, fast and reliable estimation of the maximum load carrying capacity (ultimate strength) of the ships just before breaks in two under worst conditions becomes vital. The optimum (accuracy, time, practicality) estimation of these values is depends on how accurate the stress-strain behavior of the structural components are established. Published researches about progressive collapse analysis of hull girder can be classified three categories such as (1) derivation of theoretical methods to estimate progressive collapse or ulti-mate strength; (2) results from theoretical modelling of sections using FEM approaches and (3) re-porting of physical experiments on box girders or ship structures. The well-known and most effective methods using for globally progressive collapse analysis of hull girders by different component types are Smith Method (Smith, 1977) and ISUM by (Ueda and Rashed, 1991).
Figure 1: MOL Comfort - 313 m length container ship broke in two in June 2013 (Vesselfinder.com, 2013).
A series of tests and FEM analysis on full scale welded steel grillages subjected to a combina-tion of axial compression and lateral pressure is presented by (Smith, 1976).
Efforts on experimental investigation for stiffened panel collapse behaviors were made by many researchers. The early works extended by (Paik et al., 2001, 2002, 2008) provide an extensive con-tribution to the ultimate strength evaluations for stiffened panels and hull girders by developing practical methods, codes and empirical formulas. (Benson, 2011) investigated aluminum stiffened
panels’ and ships’ behaviors under uniaxial compressive loads and developed a semi-analytical
method by using FEA and orthotropic plate theory.
2 METHODOLOGY
The progressive collapse method applied to ship hull girders by Smith Method (Smith, 1977), also basis of our solution methodology, is one of the simplified and most well recognized methods in the marine field to estimate the global strength of a hull girder. For a progressive collapse type analysis by Smith Method, the hull girder is usually discretized into plate-stiffener combination beam-column components. Failure of the hull girder in overall bending occurs by inter-frame failure of these components.
Another successful method to estimate the ultimate hull girder strength is idealized structural unit method (ISUM) developed by Ueda and Rashed (1991). For an ISUM type analysis the hull girder is usually discretized into several different types of structural members such as support members (single stiffeners), beam-columns, rectangular plates and stiffened panels.
The Smith method is developed into various registered computer codes by researchers. These codes use the same underlying methodology but differ in their approach to derive the load-end shortening curves.
The considered method presented in this study is composed from ISUM based component dis-cretization and Smith Method based progressive collapse analysis. Unlike the application of conven-tional Smith method, single plate, single stiffener and stiffened panel components are also used in-stead of using just plate-stiffener combination beam-column components.
Developed systematic calculation method has two main advantages. First, large deflection or-thotropic plate approach is extended by changing calculation technique. The traditional oror-thotropic
plate method is closed form and it just give the result of ultimate strength. It doesn’t directly
calcu-late the historical load-shortening behavior of the panel under progressively increasing compressive load. Briefly, the extended calculation derives the complete panel load-shortening curve by different methods and uses the orthotropic panel approach to define the curve peak value. Second, depending on first advantage, using stiffened panel components instead of discretizing the complex hull entire-ly to stiffener-plate combination beam-column components, provide small number of discretized element. The small number components means small number load-shortening curves to be consid-ered. This case reduces the analysis time. Thus, the disadvantage of using less component for pro-gressive collapse analysis is also eliminated by considering the stress-strain behavior of stiffener and plate component individually during calculations.
Besides, another important point should be underlined that considering all collapse modes for stiffened panels by extended orthotropic plate large deflection approach provides the opportunity to make more realistic assessments.
In this study, according to HULT solution methodology all five modes for stiffened panel col-lapse are considered separately and accepted that colcol-lapse of stiffened panels occurs at the lowest value among the various ultimate loads.
In HULT, the load-end shortening curve relationships of structural components of hull girders under vertical bending moment are determined by numerically, empirically and semi-analytically. For these calculations "limit state design approach", "membrane stress approach", orthotropic pan-el approach" and the rules of IACS-CSR, 2012 are used. The stress-strain behaviors of initially de-flected single plates, single stiffeners, plate-stiffener combination components with different type and geometry and stiffened panel components are obtained by von-Karman & Marguerre plate equa-tions, IACS-CSR single step procedure with simplified analytical formulas and updated orthotropic panel approach calculations, respectively. Then, the progressive collapse calculations are performed using the determined load-end shortening curves.
Within the method, the historical single stiffener strength values are determined by comparison of standard stress-strain curves derived from IACS-CSR equations and non-linear FEM analysis. The historical unstiffened plate strength values are determined by comparison of standard stress-strain curves derived by using Marguerre governing large deflection nonlinear equations of initially
deflected single plate theory extended from von Karman’s original equilibrium and compatibility
equations and non-linear FEM analysis. The plate-stiffener combination beam-column components’
strength values are determined by combining the plate and stiffener strength obtained from above mentioned curves and a comparison is conducted with plate-stiffener combination buckling strength evaluation using standard stress-strain curves derived from IACS-CSR equations and non-linear FEM analysis.
The stiffened panel components’ load-end shortening (stress-strain) behaviors behind and
be-yond ultimate strength are obtained by updated orthotropic panel calculation procedure but using historical combined stress-strain curves of several type single stiffeners and single plates mentioned in paragraph above. The overall panel strength between two adjacent frames (not for whole ship) is evaluated by large deflection orthotropic panel approach but using renewed instantaneous longitu-dinal geometric properties like Ex, Dx determined by instantaneous tangent modulus ET,p and Et,s from the plate components' and stiffener components' load shortening curves, respectively. Details of this procedure and obtaining the load-end shortening curves of other single components can be find from study of (Benson, 2011) and (Ölmez, 2014). The sample of calculation flowchart for or-thotropic panel historical P-du derivation can be seen from Fig. 2.
The distance between neutral axis and intersection point of original and rotated cross sections gives curvature radius. The definition sketch for the forced curvature principle under the case of pure bending is shown in Fig 3.
Figure 2: Calculation flowchart for orthotropic panel historical P-du derivation.
Figure 3: Definition sketch for the forced curvature principle in the case of pure bending (Özgüç, 2006).
Determination of initial hull elastic section modulus and neutral axis position (zna)
Determination of first curvature value (also first step) (κ,Δκ)
Hull Girder Section Component Discretization and Numbering (j)
(Longitudinal Stiffeners, Single Plates, Hard Corners, Stiffened Plates, Stiffened Panels)
Calculation of component strain (εij) and axial shortening (duij) under instantaneous (κi) and new neutral axis
position
Determination of component load values (Pij) for that axial end
shortening value
P-du curves of each local components
Total instantaneous load calculation Pi =
Σ
σj× AjLoad Equilibrium Changing the neutral
axis position
No
Determination of total instantaneous vertical bending moment of hull section
Σ
Mi under load equilibrium (Σ
Pi = 0) YesDetermining the top point of curve as ultimate strength Mult
Determination of instantaneous neutral
axis position with Excels’ Goal Seek
Start
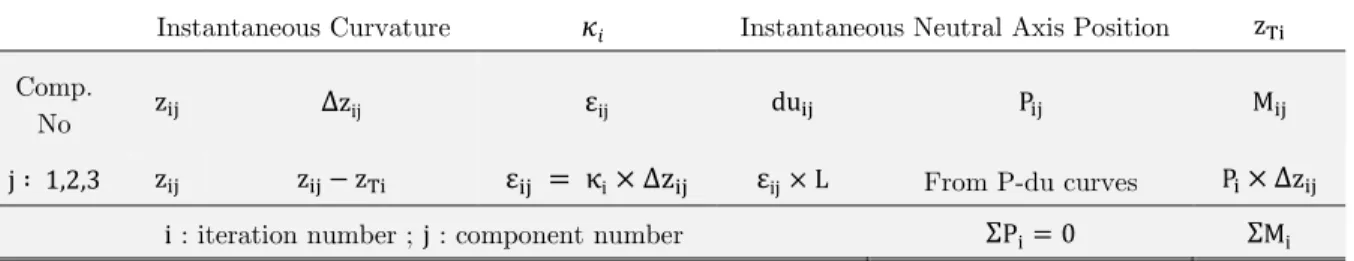
The load-end shortening curves obtained previously will be used instead of average stress- aver-age strain curves for the progressive hull collapse calculations to plot moment-curvature curve. Physically, these curves shows that how much internal forces will be created by axial straining of that structural component. After large deflection analysis of components, the progressive collapse calculation starts with approximately calculated curvature depending on vertical bending moment given by a linear elastic bending stress of yield, modulus of elasticity and specified minimum yield stress of the material. Next, the strain distribution (ε = κi × ∆zij) can be calculated depending on
the curvature (i) and distance from neutral axis (zij). Afterwards, the axial end shortening (duij)
can be calculated with the aid of strain distribution on the section. The instantaneous load corre-sponds to the axial displacement value of the component is read from load-shortening (P-du) curve and written in the calculation Table 1 prepared for progressive hull collapse analysis.
Instantaneous Curvature �� Instantaneous Neutral Axis Position zT Comp.
No z ∆zij εij du P M
j ∶ , , z z − zT ε = κi× ∆z εij× L From P-du curves P× ∆z
i : iteration number ; j : component number ΣPi= ΣMi
Table 1: Progressive hull collapse analysis calculation table.
During the calculation process with Table 1, in each calculation step (each curvature increment) the total internal loads (ΣPi) of each components (Pij) of the hull section have to be zero for
equilib-rium. If the balance has not been achieved, it indicates that the position of the neutral axis should be changed to calculate the strain values correctly under instantaneous curvature. To determine the position of neutral axis providing equilibrium, the sub-calculation is made with Excel Goal Seek. Next, the moments (Mij) are calculated by multiplying the load (Pij) and vertical distance of
compo-nent from neutral axis (zij) and the total hull section bending moment (ΣMi) is obtained by sum of
each components moment values.
3 SHIPS OF VERIFICATION BENCHMARK STUDIES ON ULTIMATE HULL GIRDER STRENGTH
The accuracy of ultimate strength estimations of ship hull girders is now examined with the objec-tive of validating HULT’s ultimate strength procedures for ship and offshore structures. This is accomplished through evaluations of ten benchmark case studies for which detailed structural in-formation and associated numerical or measured results are reported in literature. The main geo-metric properties and mid-ship sections of considered ten benchmark ships are represented in next subsections.
3.1 Cross Sections and Structural Characteristics
No Ship Type Abbreviation Reference
1 1/3 Scale Frigate FRG Dow, 1991
2 Single Hull VLCC Oil Tanker (Energy Concentration) SHOT Rutherford and Calwell,1990
3 3,500 TEU Container CNT35 ISSC, 2000
4 47,326 DWT Double Hull Oil Tanker DHOT1 Dalma, 2009
5 105,000 DWT Double Hull Oil Tanker DHOT2 Paik et al., 2002
6 313,000 DWT Double Hull Oil Tanker DHOT3 Paik et al., 2002
7 170,000 DWT Single Sided Bulk Carrier SSBC Paik et al., 2002
8 169,000 DWT Double Sided Bulk Carrier DSBC Paik et al., 2002
9 9,000 TEU Container CNT90 Paik et al., 2002
10 113,000 DWT Floating Production Storage and Offload FPSO Paik et al., 2002
Table 2: Considered ten benchmark typical ships.
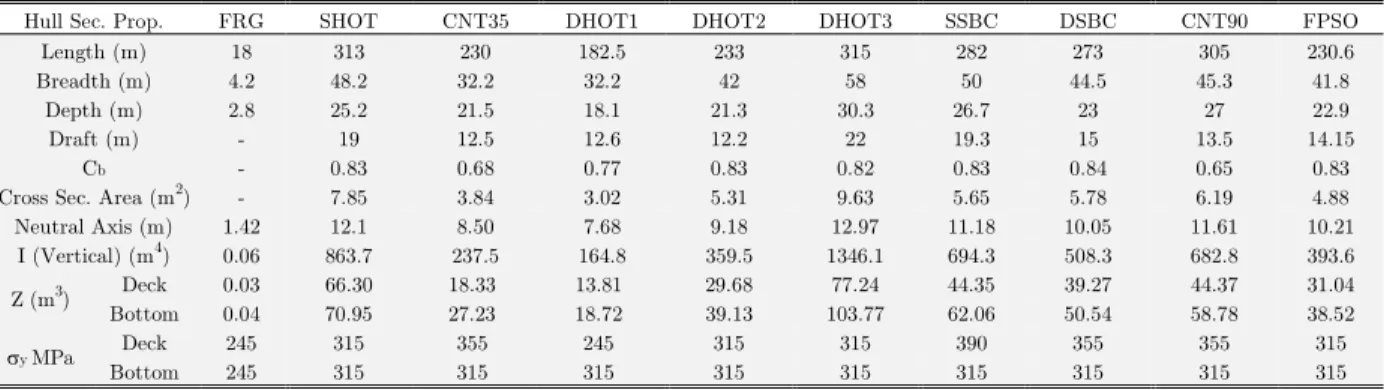
The cross sections of ten ships and main hull section properties are shown in Fig. 4 and Table 3, respectively.
-1- -2-
-3- -4-
-5- -6-
-7- -8-
-9- -10-
Figure 4 Cont.: Mid-ship cross sections of ten benchmark ships (5 - 10).
Hull Sec. Prop. FRG SHOT CNT35 DHOT1 DHOT2 DHOT3 SSBC DSBC CNT90 FPSO
Length (m) 18 313 230 182.5 233 315 282 273 305 230.6
Breadth (m) 4.2 48.2 32.2 32.2 42 58 50 44.5 45.3 41.8
Depth (m) 2.8 25.2 21.5 18.1 21.3 30.3 26.7 23 27 22.9
Draft (m) - 19 12.5 12.6 12.2 22 19.3 15 13.5 14.15
Cb - 0.83 0.68 0.77 0.83 0.82 0.83 0.84 0.65 0.83
Cross Sec. Area (m2) - 7.85 3.84 3.02 5.31 9.63 5.65 5.78 6.19 4.88
Neutral Axis (m) 1.42 12.1 8.50 7.68 9.18 12.97 11.18 10.05 11.61 10.21
I (Vertical) (m4) 0.06 863.7 237.5 164.8 359.5 1346.1 694.3 508.3 682.8 393.6
Z (m3) Deck 0.03 66.30 18.33 13.81 29.68 77.24 44.35 39.27 44.37 31.04
Bottom 0.04 70.95 27.23 18.72 39.13 103.77 62.06 50.54 58.78 38.52
y MPa Deck 245 315 355 245 315 315 390 355 355 315
Bottom 245 315 315 315 315 315 315 315 315 315
3.2 Progressive Hull Collapse Analysis and Calculated Results
The ultimate vertical bending moment of the ten hull structures are estimated using HULT and IACS-CSR/KTU (Ölmez, 2014). The results are compared with published results (Dow, 1991), (ISSC, 2000), (Paik et al., 2002), (Özgüç, 2006), (Dalma, 2009), (Tayyar, 2011), (Benson, 2011), (ISSC 2012), (Andric et al., 2014). It is noted that the hull structural dimensions applied for all analysis were defined by including 50% corrosion margin (0.5 x tcorr) values of individual structural
components as specified by IACS-CSR (2012), which ensures obtained results as incomparable with all other results. Fig. 5 shows three of discretized IACS-CSR and HULT models employed for the progressive hull collapse analysis under vertical bending within this study. A small but enough to represent part of hull cross-section model between two adjacent transverse frames at mid-ship is adopted as the extent of the analysis. For HULT code modelling, structural components between support members are idealized such as single stiffeners (longitudinal support members excluding attached plating), single plates, single stiffeners with attached plating (beam-column components), hard corners and identically stiffened panels. Firstly, 45 beam-column (PSC), 2 hard corner (K) and 3 single plate (P) components are used in FRG/IACS-CSR and 1 stiffened plate (SP), 2 beam-column, 37 single stiffener (S), 33 single plate and 5 hard corner components are used in FRG-HULT. Second, 110 beam-column, 6 single plate and 16 hard corner components are used in SHOT/IACS-CSR and 25 stiffened plate, 30 single plate, 22 single stiffener and 33 hard corner component are used in SHOT/HULT. At last, 82 beam-column and 62 hard corner components are used in CNT35/IACS-CSR and 32 stiffened plate, 8 single plate, 10 single stiffener and 60 hard corner components are used in CNT35/HULT.
The main assumptions used for ten hull girder progressive collapse calculations are: 1-Analysis are carried out between two adjacent transverse frames.
2-Plane sections remains plane after bending (Euler-Bernoulli Bending Theory).
3-The neutral axis of the hull cross section changed as the collapse of individual structural components progressively occurs. For example, if the discretized structural components from deck are collapse first, the neutral axis position moves downwards to provide equilibrium and stability at current load step. The opposite is also true. Decrease or increase of the neutral axis position according to hogging or sagging case is taken into account as the vertical bend-ing moment is increasbend-ingly applied.
4-Average level ( . 5 × σy l ) welding residual stress is considered (Smith et al., 1988) in benchmark study of ten ships and benchmark study of component discretization effects for validation. Next, two more welding residual stress levels (slight and severe) are considered in benchmark study of initial distortion effects to investigate their effects on structural
compo-nents’ behaviors and ultimate strength results.
SP1
K1
P1
S1 S2 S3 S4
S5 S6 S7 S8 S9 S10 S12 S13 S14 S15 S16 S17 S18 S19 S20 S21 S22 S23 S24 S25 S26 S27 S28 S29 S30 S31 S32 S33 S34 S35 S36 P2 P6 P3 P4 P5 P7 P8 P9 P10 P11 P12 P13 P14 P15 P16 P17 P18 P19
P23 P22 P21 P20 P24 P25 P26 P27 P28 P29 P30 P31 P32 P33 S37 K2 K3 K4 K5 PSC2 PSC1
Figure 5: Component discretization of FRG, SHOT and CNT35 with HULT and IACS-CSR.
FRG / IACS-CSR FRG / HULT
SHOT HULT SP1 SP2 SP3 SP4 SP5
SP6 SP7
SP8 SP9 SP10 SP11 SP12 SP13
SP14 SP15 SP16 SP17
SP18 SP20 SP19 SP21 SP22 SP23 SP24 SP25 P30 P29 P28 P27
P26 P25
P24 P23 P22 P21 P20 P19 P18 P17 P16 P15 P14 P13 P12 P11 P10 P9 P8 P7 P6 P5 P4 P3 P2 P1 S1
S2 S3 S5 S6 S4 S7 S8 S9 S10 S11 S12 S13 S14 S15 S16 S17 S18 S19 S20 S21 S22 K33 K32 K2
K3 K1
K4 K5 K6 K7 K8 K9 K10 K11 K12 K13 K14
K15 K16
K17
K18 K19 K20 K21 K22 K23 K24 K 25 K26 K27 K31 K28 K29 K30 N.A. K1
K2 K3 K4 K5 K6 K7 K8 K9 K10 K11 K12 K13 K14 K15 K16 K17 K18 K21 K20 K19 K26 K25
K27
K24 K23 K22 K30
K29 K28 K31 K32 K33 K34 K35 K36 K38 K39 K37 K40 K42 K41 K43 K45 K44 K47 K46 K48 K49 K52 K50 K51 K55 K53 K54 K56 K58 K57
SP1 SP2 SP3 SP4 SP8 SP7 SP6 SP5 SP10 SP9
SP11 SP12 SP13 SP14 SP18 SP17 SP16 SP15 SP19 SP20 SP21 SP22 SP23 SP24 SP25 SP26 SP27 S1
SP29 SP28 SP30 SP31 SP32 S2 S3 S4 S5 S6 S7 S8 S9 S10
P1 P2
P3 P4 P5 P6 P7 P8
K60 K59
1 2 3
4 5 6 7 8 9 10 11 12 13 14 15 16 17 18 19 20 21 22 23 24 25 26
27 28 32 29 30 31 33 34 35 36 41 42 40 39 38 37 47 49 48 46 45 44 43 55 50 51 52 53 54 62 61 56 57 58 59 60 81 80 79 78 77 72 71 73 74 75 76 66 64 65 67 68 69 70 63 82 83 85 84 86 87 89 88 91 90 92 93 94 95 96 97 98 99 100 101 102 109 106
107 108
103 104 105 111 110 112 115 114 113 116 117
118 119 120 121 122 123 124 126 127 125 128 129 130
131 132 133 134 135 136 137 138 139 140 141 142 143 144
CNT35 / HULT CNT35 / IACS-CSR
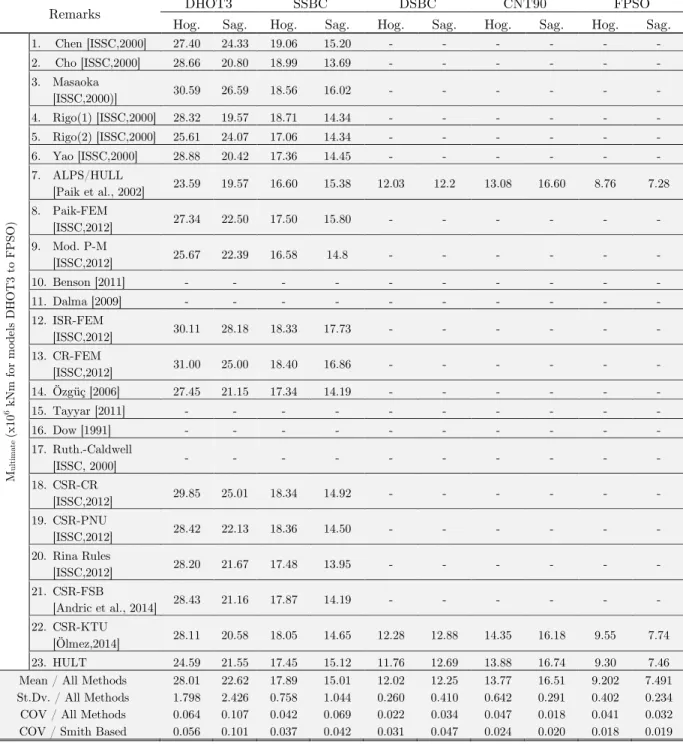
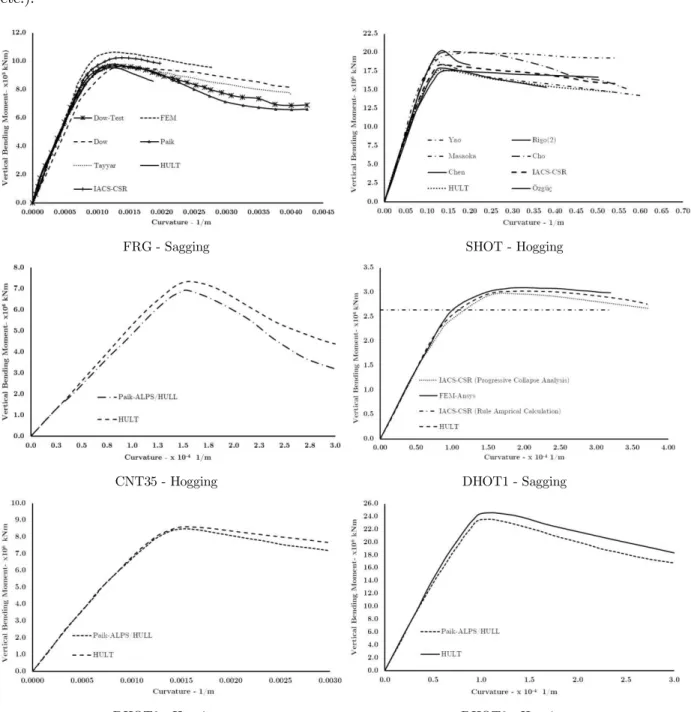
The result comparison of hogging and sagging condition ultimate strength calculations with HULT, IACS-CSR and published other results obtained by different authors using various methods are comparatively represented in Table 4 and Fig. 6, respectively. Next, effects of hull girder section component discretization, initial deflection of plates and residual welding stress as initial distortions, and 50% corrosion margin for individual structural components on ultimate hull girder strength are represented by table and graphs in benchmark studies below.
Remarks FRG SHOT CNT35 DHOT1 DHOT2
Hog. Sag. Hog. Sag. Hog. Sag. Hog. Sag. Hog. Sag.
Mu
lt
im
at
e
(x
10
3 k
N
m
f
or
m
od
el
F
R
G
&
x1
0
6 k
N
m
f
or
m
od
el
s
SH
OT
to
D
H
OT
2)
1. Chen [ISSC,2000] 12.49 9.54 20.23 18.54 6.56 5.47 - - - -
2. Cho [ISSC,2000] 11.32 9.48 20.09 16.75 6.69 5.13 - - - -
3. Masaoka
[ISSC,2000)] 12.49 11.50 20.01 19.00 8.07 7.95 - - - -
4. Rigo(1) [ISSC,2000] 13.26 9.47 18.46 17.90 7.60 6.51 - - - -
5. Rigo(2) [ISSC,2000] 12.12 9.88 17.54 17.10 7.20 6.91 - - - -
6. Yao [ISSC,2000] 10.90 8.58 19.03 16.84 6.72 6.72 - - - -
7. ALPS/HULL
[Paik,2002] 10.45 9.94 16.77 15.83 6.92 6.64 - - 8.49 6.90
8. Paik-FEM
[ISSC,2012] - 9.62 17.36 16.18 6.97 6.95 - - - -
9. Mod. P-M
[ISSC,2012] - - 18.70 17.83 6.4 7.08 - - - -
10. Benson [2011] - 10.20 - - - -
11. Dalma [2009] - - - 3.09 - -
12. ISR-FEM
[ISSC,2012] - - 21.2 20.2 7.49 7.18 - - - -
13. CR-FEM
[ISSC,2012] - - 21.86 20.63 7.66 7.63 - - - -
14. Özgüç [2006] 12.01 9.60 17.89 16.45 6.79 6.70 - - - -
15. Tayyar [2011] - 9.74 17.02 - - - -
16. Dow [1991] 11.39 9.64 18.80 - - - -
17. Ruth-Caldwell
[ISSC,2000] - - 17.94 - - - -
18. CSR-CR
[ISSC,2012] - - 20.71 18.59 7.88 7.59 - -
19. CSR-PNU
[ISSC,2012] - - 20.10 18.71 7.76 6.85 - -
20. Rina Rules
[ISSC,2012] - - 19.84 18.47 6.86 5.90 - -
21. CSR-FSB [Andric
et al., ,2014] - - 19.41 18.30 7.58 6.82 - -
22. CSR-KTU
[Ölmez,2014] 12.11 10.25 19.30 18.03 7.25 6.65 4.88 2.97 8.75 6.95
23. HULT 12.18 9.53 17.66 16.95 7.34 6.68 5.26 3.25 8.61 7.08
Mean / All Methods 11.86 9.784 19.04 17.91 7.21 6.74 5.07 3.10 8.62 6.98
St.Dv. / All Methods 0.841 0.633 1.416 1.314 0.492 0.702 0.269 0.140 0.13 0.09
COV / All Methods 0.071 0.065 0.074 0.073 0.068 0.104 0.053 0.045 0.013 0.018
COV / Smith Based 0.060 0.087 0.062 0.049 0.069 0.115 0.053 0.064 0.014 0.013
Remarks DHOT3 SSBC DSBC CNT90 FPSO
Hog. Sag. Hog. Sag. Hog. Sag. Hog. Sag. Hog. Sag.
Mu
lt
im
at
e
(x
10
6 k
N
m
f
or
m
od
el
s
D
H
OT
3
to
F
P
SO
)
1. Chen [ISSC,2000] 27.40 24.33 19.06 15.20 - - - -
2. Cho [ISSC,2000] 28.66 20.80 18.99 13.69 - - - -
3. Masaoka
[ISSC,2000)] 30.59 26.59 18.56 16.02 - - - -
4. Rigo(1) [ISSC,2000] 28.32 19.57 18.71 14.34 - - - -
5. Rigo(2) [ISSC,2000] 25.61 24.07 17.06 14.34 - - - -
6. Yao [ISSC,2000] 28.88 20.42 17.36 14.45 - - - -
7. ALPS/HULL
[Paik et al., 2002] 23.59 19.57 16.60 15.38 12.03 12.2 13.08 16.60 8.76 7.28 8. Paik-FEM
[ISSC,2012] 27.34 22.50 17.50 15.80 - - - -
9. Mod. P-M
[ISSC,2012] 25.67 22.39 16.58 14.8 - - - -
10. Benson [2011] - - - -
11. Dalma [2009] - - - -
12. ISR-FEM
[ISSC,2012] 30.11 28.18 18.33 17.73 - - - -
13. CR-FEM
[ISSC,2012] 31.00 25.00 18.40 16.86 - - - -
14. Özgüç [2006] 27.45 21.15 17.34 14.19 - - - -
15. Tayyar [2011] - - - -
16. Dow [1991] - - - -
17. Ruth.-Caldwell
[ISSC, 2000] - - - -
18. CSR-CR
[ISSC,2012] 29.85 25.01 18.34 14.92 - - - -
19. CSR-PNU
[ISSC,2012] 28.42 22.13 18.36 14.50 - - - -
20. Rina Rules
[ISSC,2012] 28.20 21.67 17.48 13.95 - - - -
21. CSR-FSB
[Andric et al., 2014] 28.43 21.16 17.87 14.19 - - - -
22. CSR-KTU
[Ölmez,2014] 28.11 20.58 18.05 14.65 12.28 12.88 14.35 16.18 9.55 7.74
23. HULT 24.59 21.55 17.45 15.12 11.76 12.69 13.88 16.74 9.30 7.46
Mean / All Methods 28.01 22.62 17.89 15.01 12.02 12.25 13.77 16.51 9.202 7.491
St.Dv. / All Methods 1.798 2.426 0.758 1.044 0.260 0.410 0.642 0.291 0.402 0.234
COV / All Methods 0.064 0.107 0.042 0.069 0.022 0.034 0.047 0.018 0.041 0.032
COV / Smith Based 0.056 0.101 0.037 0.042 0.031 0.047 0.024 0.020 0.018 0.019
Table 4 Cont.: Summary of benchmark ship’s ultimate bending moment results for all methods.
0.053 and 0.049, respectively. This decreasing on average COV shows that similarity of methods increases as expected. It can also be noted that closed results are obtained by various Smith based methods (1 to 6, 10, 14, 15, 20 and 23) and the IACS-CSR method implementations use same for-mulations for load-end shortening curves (18, 19, 21 and 22).
Although standard formulations for standard component idealization, there are small differences among CSR results due to researcher factors (code algorithm, structural discretization, assumptions, etc.).
FRG - Sagging SHOT - Hogging
CNT35 - Hogging DHOT1 - Sagging
DHOT2 - Hogging DHOT3 - Hogging
SSBC - Sagging DSBC - Sagging
CNT90 - Sagging / Hogging FPSO - Sagging / Hogging
Figure 6 Cont.: Moment-curvature curves of model 7 to 10.
3.3 Benchmark Study for Component Discretization Effect
The ultimate vertical bending moment of the five hull structures are estimated using HULT with three different component discretization, then the results are compared with each other and pub-lished results. It is noted that the hull structural dimensions applied for the all analysis were de-fined by including 50% corrosion margin (0.5 × tcorr) values of individual structural components as
specified by IACS-2012, which ensures obtained results as incomparable with all other results. Also, average level welding residual stresses (0.15x0) and buckling mode average level initial
deflection (0.1 × 2 × t) is considered. Based on the structural idealization techniques (Hughes and
The result comparison of hogging and sagging condition ultimate strength calculations with HULT, IACS-CSR and published other results obtained by different authors using various methods are comparatively represented in Table 5 and Fig. 7, respectively.
Remarks FRG SHOT CNT35 DHOT2 SSBC
Hog Sag Hog Sag Hog Sag Hog Sag Hog Sag
Mul
ti
m
ate
(x
10
3 k
Nm
f
or
m
od
el
FR
G
&
x
10
6 k
Nm
f
or
m
od
el
s
SH
O
T
to
S
SBC
)
1. Chen
[ISSC,2000] 12.49 9.54 20.23 18.54 6.56 5.47 - - 19.06 15.20
2. Cho
[ISSC,2000] 11.32 9.48 20.09 16.75 6.69 5.13 - - 18.99 13.69
3. Masaoka
[ISSC,2000] 12.49 11.5 20.01 19.00 8.07 7.95 - - 18.56 16.02
4. Rigo (2)
[ISSC,2000] 12.12 9.88 17.54 17.10 7.20 6.91 - - 17.06 14.34
5. Yao
[ISSC,2000] 10.90 8.58 19.03 16.84 6.72 6.72 - - 17.36 14.45
6. ALPS/HULL
[Paik et al.,2002] 10.45 9.94 16.77 15.83 6.92 6.64 8.49 6.90 16.60 14.28
7. Paik-FEM
[ISSC,2012] - 9.62 17.36 16.18 6.97 6.95 - - 17.50 15.80
8. Modified P-M
[ISSC,2012] - - 18.70 17.83 6.4 7.08 - - 16.58 14.8
9. ISR-FEM
[ISSC,2012] - - 21.2 20.2 7.49 7.18 - - 17.06 14.34
10. CR-FEM
[ISSC,2012] - - 21.86 20.63 7.66 7.63 - - 17.36 14.45
11. Ozguc [2006] 12.01 9.60 17.89 16.45 6.79 6.70 - - 16.60 15.38
12. Tayyar [2011] - 9.74 17.02 - - - 17.50 15.80
13. Dow [1991] 11.39 9.64 18.80 - - - 16.58 14.8
14. Ruth.-Caldwell
[ISSC, 2000] - - 17.94 - - - 17.06 14.34
15. CSR-CR
[ISSC,2012] - - 20.71 18.59 7.88 7.59 - - 17.36 14.45
16. CSR-PNU
[ISSC,2012] - - 20.10 18.71 7.76 6.85 - - 16.60 15.38
17. Rina Rules
[ISSC, 2012] - - 19.84 18.47 6.86 5.90 - - 17.50 15.80
18. CSR-FSB
[Andric et al.,2014] - - 19.41 18.30 7.58 6.82 - - 16.58 14.8
19. CSR-KTU
[Olmez, 2014] 12.11 10.2 19.30 18.03 7.25 6.65 8.75 6.95 17.06 14.34
HULT- Model I 12.35 9.61 18.09 17.15 7.47 6.85 8.79 7.21 17.88 15.68
HULT-Model II 12.05 9.46 17.38 16.80 7.29 6.55 8.25 6.84 16.75 14.73
HULT-Model III 12.18 9.53 17.66 16.95 7.34 6.68 8.61 7.08 17.45 15.12
Mean 11.82 9.737 18.95 17.81 7.205 6.750 8.578 6.99 17.32 14.91
St.Dv. 0.656 0.621 1.435 1.311 0.473 0.682 0.218 0.14 0.743 0.642
COV 0.055 0.064 0.076 0.074 0.066 0.101 0.025 0.02 0.043 0.043
FRG - Sagging SHOT - Hogging
CNT35 - Hogging DHOT2 - Hogging
SSBC - Sagging
Figure 7: Moment-curvature curves of five benchmark ships.
3.4 Benchmark Study for Initial Distortion Effects
Scenario No w0 rcx tcomponent
1 0.025 ×2× t
p -0.15 ×Yp tcor-ABS
2 0.1 ×2× t
p -0.15 ×Yp tcor-ABS
3 0.3 ×2× t
p -0.15 ×Yp tcor-ABS
4 0.1 ×2× t
p -0.05 ×Yp tcor-ABS
2 0.1 ×2× t
p -0.15 ×Yp tcor-ABS
5 0.1 ×2× t
p -0.3 ×Yp tcor-ABS
Table 6: Progressive collapse analysis scenarios.
A mid-ship section and perspective view of a typical double sided - double bottom container ship can be seen in Figure 8. The real mid-ship section of container ship with numbered structural components that the progressive collapse strength of the ship is calculated can be seen in Figure 9. Also, the geometrical and material specifications of longitudinal stiffener components of the mid-ship cross section are given in Table 7.
Figure 8: Typical 3,500 TEU double sided - double bottom container ship.
Stf. No
Web mm
Flange mm
Stif. Type
Mat. Yield MPa
Stf. No
Web mm
Flange mm
Stif. Type
Mat. Yield MPa
1 300 x 38 Flat 352.8 9 230 x 10 Flat 313.6
2 300 x 28 Flat 313.6 10 300 x 13 90 x 17 L 313.6
3 250 x 10 90 x 15 L 313.6 11 150 x 12 90 x 12 L 313.6
4 250 x 12 90 x 16 L 313.6 12 250 x 12 90 x 15 L 313.6
5 300 x 11 90 x 16 L 313.6 13 150 x 12 Flat 313.6
6 300 x 13 90 x 17 L 313.6 14 150 x 9 90 x 9 L 313.6
7 350 x 12 100 x 17 L 313.6 15 150 x 10 Flat 313.6
8 400 x 11.5 100 x 16 L 313.6 16 300 x 11 90 x 16 L 313.6
Figure 9: Mid-ship section of considered container ship.
High strength steel (Y = 352.8 MPa) was used in deck, side and top two components portion
of the double side. Relatively low-strength steel (Y = 313.6 MPa) in the longitudinal members of
the double side, bottom and double bottom was preferred. The length between two transverse sup-port components that analysis conducted is 3.27 m. The distance between two stiffeners in upper part of the double-sides is preferred as 820 mm, in other parts of the double-side 860 mm and in double bottom 880 mm. Thickness of all structural components are determined by considering the corrosion effects and net thickness approach represented in IACS-CSR. The considered mid-ship section with 144 components by IACS-CSR and with 110 components by HULT are represented in Figure 10.
Figure 10: Two different component discretization of the mid-ship section.
K1
K2 K3 K4 K5 K6 K7 K8 K9 K10 K11 K12 K13 K14 K15 K16 K17 K18 K21 K20 K19 K26 K25
K27
K24 K23 K22 K30 K29 K28
K31 K32 K33 K34 K35 K36 K38 K39 K37 K40 K42 K41 K43 K45 K44 K47 K46 K48 K49 K52 K50 K51 K55 K53 K54 K56 K58 K57
SP1 SP2 SP3 SP4 SP8 SP7 SP6 SP5 SP10 SP9
SP11 SP12 SP13 SP14 SP18 SP17 SP16 SP15 SP19 SP20 SP21 SP22
SP23 SP24 SP25 SP26 SP27 S1
SP29 SP28 SP30 SP31 SP32 S2 S3 S4 S5 S6 S7 S8 S9 S10
P1 P2
P3 P4 P5 P6 P7 P8
K60 K59
1 2 3
4 5 6 7 8 9 10 11 12 13 14 15 16 17 18 19 20 21 22 23 24 25
26 27 28 32 29 30 31 33 34 35 36 41 42 40 39 38 37 47 49 48 46 45 44 43 55 50 51 52 53 54 62 61 56 57 58 59 60 81 80 79 78 77 72 71 73 74 75 76 66 64 65 67 68 69 70 63 82 83 85 84 86 87 89 88 91 90 92 93 94 95 96 97 98 99 100 101 102 109 106
107 108 103 104 105 111 110 112 115 114 113 116 117 118 119 120 121 122 123 124
126 127 125 128 129 130
131 132 133
134 135 136 137 138 139 140 141 142 143 144
After different component discretization, first of all, progressive collapse analysis are conducted by IACS-CSR and HULT in order to make comparison with results from literature. Average initial deflection and average residual welding strength values are preferred for components in progressive collapse analysis both hogging and sagging positions.
Comparative results with literature are given in Table 8. Next, considering Table 5, the pro-gressive collapse calculations are repeated for different scenarios and comparative results (effects of initial deflections and residual welding strength) are represented in Figure 11.
IACS-CSR Chen ALPS/HULL FEM Rina Rules Rigo-2 Yao HULT
(S
ag
gi
ng
) Mu x106
kN.m 6.81 5.47 6.64 6.95 5.89 6.91 6.72 6.68
u 1.65x10⁻⁴ 1.13x10⁻⁴ 1.5x10⁻⁴ 2.7x10⁻⁴ 2.09x10⁻⁴ 1.58x10⁻⁴ 1.41x10⁻⁴ 1.52x10⁻⁴
(H
og
gi
ng
) Mu x106
kN.m 6.65 6.56 6.92 6.97 6.86 7.20 6.72 6.83
u 1.94x10⁻⁴ 2.49x10⁻⁴ 1.87x10⁻⁴ 2.17x10⁻⁴ 2.49x10⁻⁴ 1.62x10⁻⁴ 1.63x10⁻⁴ 1.57x10⁻⁴
Table 8: Moment and curvature values at ultimate strength of container ship (CNT35).
The values from literature in the table were digitized by related software programmes from graphs obtained in ISSC-2000 and ISSC-2012 benchmark studies. As seen from table, the results are well agreed with literature. Collapse strength results in hogging differs from 6.56 to 7.20 and can be accepted approximately close to each other. In sagging, results differs from 5.47 to 6.95 and can be accepted widely distributed. Two reasons can be said about this discrepancy in hogging and sagging results. First, mostly slender plate ratios of the components above the neutral axis that likely to Euler buckling collapse first in comparison with thick bottom components. Second, the local
buck-ling strength of bottom panel components’ is close to yield strength.
In the post-processing (results evaluation) part of the HULT, component by component collapse is able to be observed during progressive collapse calculations until hull girder section collapsed. For
example, in sagging case, the calculation step that the vertical bending moment is 6.12x10⁶ kNm
-a- -b-
Figure 11: (a) Effect of initial deflections (b) Effect of residual welding strength on ultimate strength of hull girder.
According to the graphs given in Fig. 11, it can be observed that the effect of initial deflection is higher than effect of welding residual strength. There are clear decrease for collapse strength when initial deflection values increased while welding residual strength is constant. Given its strong influence, the initial deflections should be considered in progressive collapse analysis of ship hull girder.
This decrease effect can also be seen when welding residual strength is increased while initial de-flection is constant. However, this effect has no significance to taken into account, so it can be ne-glected in calculations. In this case, welding residual strength have to be taken into account for a young new built (1-3 age) ship. Contrary, unless the ship have structural renovations, this effect can be neglected for 4+ aged ships, thinking that the effects of welding has gone.
4 CONCLUSIONS
In this paper, developed systematic calculation for hull girder ultimate strength analysis by authors, namely HULT is presented briefly and its reliability is tested by benchmark analysis for ten ships, firstly. The main target of the first part of this study is to bring out the reliability and applicability of progressive hull girder collapse calculations by HULT.
Next, HULT is used clearly representing the effect of hull section component discretization is tested by benchmark analysis for five different type ships. The main target of the second part of study is to bring out the effect of component discretization on progressive hull girder collapse calcu-lations by HULT.
At the last part, the effects of initial distortions on progressive hull girder collapse calculations results by HULT is observed by using a typical double sided-double bottom container ship.
which collapse first even for hogging case are the most critical and determinant portion of the hull girder transverse section.
Figure 7 compares the progressive collapse behavior of the ship hull under vertical bending moment, as obtained by the three type discretized models. It is observed that the results obtained from the various types of structural modelling considered are similar both hogging and sagging. Results of Model III for all ships are obtained nearly between and closer Model I and Model II re-sults. In this regard, the simpler model (including small number component as possible as) extend-ing between two adjacent transverse web frames may usually be appropriate for the progressive
collapse analysis of ship’s hulls. In this way, the less load-axial end shortening curve will be needed
and this will decrease the computation time.
Results obtained by different methods and for different models were considered for calculation of Mean, St. Dv. and COV values of progressive collapse calculations. Coefficient of variation (COV) calculated for all methods and models are given in Table 4 for component discretization effects. COV for all methods varies from 0.021 to 0.101. Also, it can be observed that the results from Model I for all ships are close but have small differences from CSR-KTU results.
Last of all, according to the results of verification case studies, it can be observed that calcula-tions with HULT and implementation of IACS-CSR method used by authors closely compatible with overall mean values for all benchmark ship hull girder models. Also, as a main consequence, developed calculation flow including stress-strain curves for single plate, stiffener and stiffened panel can be reliably merged to progressive hull girder collapse analysis with different component discreti-zation in terms of the resulting approximations. Hereby, HULT has adequate reliability to estimate hull girder ultimate bending moment and determining the collapse sequence of structural compo-nents for all models.
Beside the good correlations among HULT and other results, the HULT should continue to be developed further taking into consideration some important effects such as transversely axial in plane loads, lateral out of plane loads (wave loads) and more realistic boundary conditions (elas-tically restrained edges) between plate-plate or plate-stiffener structural components.
References
Andric, J., Kitarovic, S., Bicak, M. (2014). IACS incremental - iterative method in progressive collapse analysis of various hull girder structures, Brodogradnja/Shıpbuıldıng 65/1: 65-78.
Benson, S. (2011). Progressive collapse assessment of lightweight ship structures, Ph.D. Thesis, Newcastle University, UK.
Caldwell, J. B. (1965). Ultimate longitudinal strength, Transactions RINA 107: 411-30.
Dalma, E. (2009). Ultimate hull girder strength assessment using semi-analytical and computational methods, PhD Thesis, National Technical University of Athens, Greece.
Dow, R. S. (1991). Testing and analysis of a 1/3 scale welded steel frigate model, Proc. Int. Conf. on Advances in Marine Structures, ARE, 749-773.
Hughes, O. and Paik, J. K. (2010). Ship Structural Analysis and Design, SNAME, New Jersey.
Marguerre, K. (1938). Zur theorie der gekrümmmter platte grosser formanderung proc. 5th Int. Congress Appl. Mech.93.
Ölmez, H. (2014). Ultimate strength estimation of ship hull girders by progressive collapse analysis approach, PhD Thesis, Karadeniz Technical University, Trabzon-Turkey.
Özgüç, Ö. (2006). Hull girder ultimate strength and fracture toughness of damaged marine structures, PhD Thesis, Universities of Glasgow and Strathclyde, UK.
Paik, J. K., Kim, B. J., Seo, J. K. (2008). Methods for ultimate limit state assessment of ships and ship-shaped off-shore structures: part III-hull girders, Elsevier Science Direct Ocean Engineering 35: 281-286.
Paik, J. K., Wang, G., Kim, B. J., Thayamballi, A. K. (2002). Ultimate limit state design of ship hulls, SNAME Transactions 110: 85-114.
Paik, J.K., Hughes, O.F., Mansour, A.E. (2001). Advanced closed-form ultimate strength formulation for ships, Journal of Ship Research, 45/2: 111-32.
Rutherford, S.E. and Caldwell, J.B. (1990). Ultimate longitudinal strength of ships: a case study, SNAME Transac-tions. 98: 441-471.
Smith, C. S. (1976). Compressive strength of welded steel ship grillages, Transactions of the Royal Institution of Naval Architects 118: 325–359.
Smith, C. S. (1977). Influence of local compressive failure on ultimate longitudinal strength of a ship's hull, PRADS-International Symposium on Practical Design in Ship Building 73-79, Tokyo-Japan.
Smith, C. S., Davidson, P. C., Chapman, J. C., and Dowling, P. J. (1988). Strength and stiffness of ships’ plating under in-plane compression and tension, RINA Transactions, 130: 277-296.
Smith, M. J. (2008). Ultimate strength assessment of naval and commercial ships. Defence R&D Canada – Technical Report DRDC Atlantic TR 2008-059.
Tayyar, G. T. (2011). Determination of ultimate strength of the ship girder, PhD Thesis, İstanbul Technical Univer-sity, İstanbul-Turkey.
Technical Committee III.1. (2012). Ultimate strength, Proceedings of the 18th International Ship and Offshore Struc-tures Congress, Rostock 1.
Technical Committee VI.2 (2000). Ultimate hull girder strength, Proceedings of the 14th International Ship and Offshore Structures Congress 2 Nagasaki.
Ueda, Y., Rashed, S. M. H. (1991). ISUM (Idealized Structural Unit Method) Applied to Marine Structures, Trans-actions of JWRI 20/1: 123-136.
URL-I (2013). http://www.vesselfinder.com/news/1223-UPDATE-MOL-Comfort-Sank,
Von Karman, T., Sechler, E. E., Donnell, L. H. (1932). Strength of thin plates in compression, ASME Trans, 54: 553-557.