Article
J. Braz. Chem. Soc., Vol. 26, No. 9, 1838-1847, 2015. Printed in Brazil - ©2015 Sociedade Brasileira de Química 0103 - 5053 $6.00+0.00
A
*e-mail: [email protected]
Ruthenium(II) Complexes Containing Anti-Inflammatory Drugs as Ligands:
Synthesis, Characterization and
in vitro
Cytotoxicity Activities on Cancer Cell Lines
Junai C. S. Lopes,a,b Jaqueline L. Damasceno,c Pollyanna F. Oliveira,c
Adriana P. M. Guedes,d Denise C. Tavares,c Victor M. Deflon,e Norberto P. Lopes,f
Marcos Pivatto,b Alzir A. Batista,d Pedro I. S. Maiag and Gustavo Von Poelhsitz*,b
aInstituto Federal Norte de Minas Gerais, Campus Pirapora, CP 54, 39270-000 Pirapora-MG, Brazil
bInstituto de Química, Universidade Federal de Uberlândia, CP 593, 38400-902 Uberlândia-MG, Brazil
cUniversidade de Franca, 14404-600 Franca-SP, Brazil
dDepartamento de Química, Universidade Federal de São Carlos, CP 676, 13561-901 São Carlos-SP, Brazil
eInstituto de Química de São Carlos, Universidade de São Paulo, CP 780, 13566-590 São Carlos-SP, Brazil
fNúcleo de Pesquisa em Produtos Naturais e Sintéticos (NPPNS), Faculdade de Ciências Farmacêuticas de Ribeirão
Preto, Universidade de São Paulo, 14040-903 Ribeirão Preto-SP, Brazil
gInstituto de Ciências Naturais, Exatas e Educação, Universidade Federal do Triângulo Mineiro,
38064-200 Uberaba-MG, Brazil
The synthesis, characterization and cytotoxic activity of cis-[Ru(dicl)(dppm)2]PF6 and
cis-[Ru(ibu)(dppm)2]PF6, (dppm = 1,1-bis(diphenylphosphine)methane; dicl = diclofenac anion
and ibu = ibuprofen anion), are described in this work. Complexes were characterized by elemental analysis, Fourier transform infrared spectroscopy (FTIR), UV-Vis, 31P{1H} nuclear magnetic
resonance (NMR) and high-resolution mass spectrometry (HRESIMS). X-ray structure of cis-[Ru(ibu)(dppm)2]PF6 is also described. Preliminary calf thymus DNA (ct-DNA) binding studies
were carried out by UV-Vis and viscosity experiments, with results suggesting the existence of electrostatic interactions between ruthenium complexes and ct-DNA. Cytotoxicity assays were carried out on a panel of human cancer cell lines and a human normal cell line. Complexes displayed a high to moderate cytotoxicity with IC50 ranging from 5 to 47 µmol L
-1. cis-[Ru(ibu)
(dppm)2]PF6 was found to be the most active, with IC50 values lower than cisplatin. The degree of
cytotoxicity was maintained for the normal cell line, although cis-[Ru(ibu)(dppm)2]PF6 exhibited
a similar selectivity to that of cisplatin but with a higher activity for at least two tumor cell lines which evidences a promising anticancer candidate and selects this complex for further experiments.
Keywords: ruthenium(II) complexes, cytotoxic activity, sodium diclofenac, sodium ibuprofen, dppm
Introduction
The disseminated use of cisplatin and other platinum based metallodrugs as chemotherapeutic agents against ovarian, bladder and testicular cancers, among others, is still a key aspect for the development of the medicinal inorganic
chemistry.1-6 In the search for coordination compounds
which are active against tumors and less toxic than cisplatin, ruthenium compounds emerge as the most promising
candidates.5-7 Their interesting biological features include
the mechanism of action, toxicity and biodistribution which differ from those of classical platinum compounds and might therefore be active against cisplatin resistant
human cancers.5,7-11 In the last years, three ruthenium
complexes (Figure 1) have entered in clinical trials:
[InH][trans-RuCl4(In)2] (KP1019) and Na[trans-RuCl4(In)2]
(In = indazole) (NKP1339) that displayed high activity in
primary tumor models and [ImH][trans-RuCl4(DMSO)(Im)]
(NAMI-A) which showed effect against solid tumor
A previous work from our group presented biological results from the diphosphinic ruthenium(II)
precursor cis-[RuCl2(dppm)2] and its derivative with
2-pyridinecarboxylic acid anion (pic−), the complex
[Ru(pic)(dppm)2]PF6, where the pic− ligand coordinates
on N,O-bidentate mode. The antimycobacterial activity
against MTB H37Rv of this complex was evaluated and
the minimum inhibitory concentration (MIC) value was
in the low micromolar range.16 Some additional studies
performed with the analogous [Ru(pic)(dppe)2]PF6,
dppe = 1,2-bis(diphenylphosphine)ethane, revealed a
high antibacterial activity against S. aureus, C. albicans
and M. smegmatis.17 This last complex also presented a
relatively low acute oral toxicity in mice.17
Due to this background of promising biological
results for complexes containing the cis-[Ru(P–P)2]
unit, P–P = diphosphine, our current strategy consists in evaluating derivatives with different chelating moiety by replacing the chlorido ligands in order to select new cytotoxic agents against tumor cells. In the present work anti-inflammatory molecules were chosen as co-ligands to explore the possible synergic effect between
the cis-[Ru(dppm)2] unit and these biologically active
ligands. Diclofenac and ibuprofen are non-steroidal anti-inflammatory drugs (NSAIDs) currently used in clinical medicine due to their antipyretic, antiarthritic, analgesic and anti-inflammatory properties, acting by inhibition of
cyclooxygenases (COX-1 and COX-2).18-20
In this work the synthesis and characterization of two new ruthenium(II) derivatives with formula
[Ru(dicl)(dppm)2]PF6 (1) and [Ru(ibu)(dppm)2]PF6 (2) are
reported. Furthermore, preliminary binding properties to
calf thymus DNA (ct-DNA) and in vitro tests of cytotoxic
activities against a panel of human cell lines are presented and discussed.
Experimental
General
Solvents were purified by standard methods. All chemicals used were of reagent grade or comparable purity.
The RuCl3·3H2O and the ligands 1,1-bis(diphenylphosphino)
methane (dppm), sodium diclofenac and racemic sodium ibuprofen were used as received from Aldrich. The ct-DNA was purchased from Sigma Chemical Co. Ltd.
The cis-[RuCl2(dppm)2] precursor complex was prepared
according to the literature method.21
Instrumentation
Infrared spectra (IR) were obtained on a PerkinElmer Spectrum Two spectrophotometer equipped with an attenuated total reflectance (ATR) sample holder and ZnSe crystal. The spectra were recorded in the range
of 4000-600 cm-1 with a 4 cm-1 resolution. UV-Vis
spectroscopy was performed on a Shimadzu UV2501 PC spectrophotometer using cuvettes with a 1 cm
path length and methanol as solvent. 31P{1H} nuclear
magnetic resonance (NMR) was performed on a Bruker DRX 400 MHz spectrometer with a BBO 5 mm probe at
298 K. The NMR spectra were recorded in CH2Cl2 using a
capillary of D2O to get the lock and with H3PO4 (85%) as
external reference. Conductance data, obtained at 298 K
on 1 × 10⁻³ mol L-1 methanol solutions of the complexes,
were measured with a Tecnopon MCA 150 conductometer. Elemental analyses were performed on a Perkin Elmer 2400 Series II CHNS/O microanalyser. High-resolution mass spectra (HRESIMS) with electrospray ionization were measured on an ultrOTOF (Bruker Daltonics) spectrometer, operating in the positive mode. Methanol was
RuIII
S N
Cl
Cl Cl
Cl
CH3
O CH3
NAMI-A NH
NH H N
RuI II
N N
Cl
Cl Cl
Cl
KP1019
H N HN NH
HN
RuII I
N N
Cl
Cl Cl
Cl
NKP1339 NH
HN
Na
used as solvent system and the samples were infused into the ESI source at a flow rate of 5 µL min-1. The calculated values for the charged complex ions were made by using ChemBioDraw Ultra 14.0.
Synthesis
The precursor cis-[RuCl2(dppm)2] (0.103 mmol; 100 mg) was solubilized in 50 mL of methanol, followed by the direct addition of sodium diclofenac (0.120 mmol; 37.2 mg) or sodium ibuprofen (0.120 mmol; 26.6 mg), respectively, for synthesis of the complexes 1 and 2. The
resulting solution was stirred at room temperature for a 6 h period. The final solution was concentrated to ca. 5 mL and an aqueous solution of NH4PF6 (0.150 mmol; 24.4 mg) was added for the precipitation of a yellow solid. The solid was filtered off and washed with water (3 × 5 mL) and diethyl ether (3 × 5 mL) and dried under reduced pressure.
[Ru(dicl)(dppm)2]PF6 (1)
Yield: 60.0 mg (85.5%); anal. calcd. for C64H54Cl2F6NO2P5Ru: exptl. (calcd.) C 58.68 (58.57), H 4.16 (4.26), N 1.07 (1.18); λ / nm (ε / L mol-1 cm-1) 229 (4.60 × 10⁴), 257 (2.90 × 10⁴), 288 (7.60 × 10³), 338 (2.10 × 10³); IR (ATR) ν / cm-1 3344, 3058, 3026, 2925, 2854, 1565, 1522, 1484, 1468, 1452, 1436, 1392, 1366, 1314, 1100, 1000, 949, 876, 837, 778, 731, 715, 694; 31P {1H} NMR (162.0 MHz, CH2Cl2/D2O) d 8.2 (t, 2P, J 39.0 Hz), –12.8 (t, 2P, J 39.0 Hz); –144.7 (sep, 1P, J 711 MHz, PF6–); HRESIMS m/z calcd. for C64H54Cl2NO2P4Ru [M – PF6]+: 1164.1520; found: 1164.1520.
[Ru(ibu)(dppm)2]PF6 (2)
Yield: 57.0 mg (65.4%); anal. calcd. for C63H61F6O2P5Ru: exptl. (calcd.) C 61.84 (62.02), H 5.47 (5.04); λ / nm (ε / L mol-1 cm-1) 227 (5.60 × 10⁴), 257 (3.50 × 10⁴), 340 (2.90 × 10³); IR (ATR) ν / cm-1 3057, 2951, 2927, 2864, 1516, 1485, 1461, 1436, 1420, 1373, 1282, 1191, 1161, 1145, 1121, 1092, 1026, 1000, 905, 873, 834, 784, 763, 735, 727, 714, 694; 31P{1H} NMR (162.0 MHz, CH
2Cl2/D2O) d 8.3 (t, 2P, J 38.0 Hz), –12.3 (t, 2P, J 38 Hz); –144.7
(sep, 1P, J 711 Hz, PF6–); HRESIMS m/z calcd. for C63H61O2P4Ru [M – PF6]+: 1075.2660; found: 1075.2660.
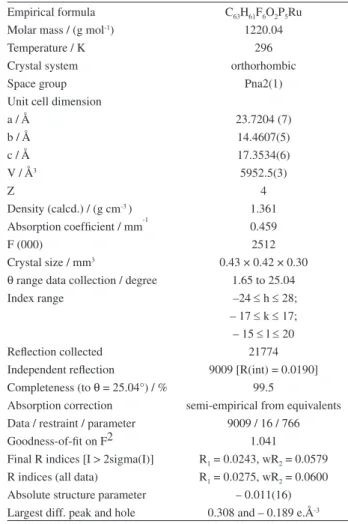
X-ray crystallography
Yellow crystals of the complex 2 were grown by
slow evaporation of a dichloromethane solution at room temperature. The data collection was performed using
Mo-Kα radiation (λ = 0.71073 Å) on a BRUKER APEX
II Duo diffractometer. Standard procedures were applied
for data reduction and absorption correction. The structure was solved with SHELXS97 using direct methods22 and all non-hydrogen atoms were refined with anisotropic displacement parameters with SHELXL97.23 The hydrogen atoms were calculated at idealized positions using the riding model option of SHELXL97.23 Table 1 presents detailed information about the structural determination.
DNA titration and viscosity experiments
A standard solution of ct-DNA was prepared in tris-HCl buffer (5 mol L-1 tris-HCl, pH 7.2). The concentration of this ct-DNA solution was measured from its absorption intensity at 260 nm using the molar absorption coefficient value of 6600 mol-1 L cm-1. Solutions of ruthenium complexes 1 and 2 used in the experiments were prepared in Tris-HCl buffer
containing 2% of dimethyl sulfoxide (DMSO). In the titration experiments, different concentrations of the ct-DNA were used while the ruthenium complex was at 20 µmol L-1.
Viscosity experiments were carried out using an Ostwald viscometer maintained at a constant temperature of 25 °C in Table 1. Crystallographic data and structural refinement details for
complex 2
Empirical formula C63H61F6O2P5Ru
Molar mass / (g mol-1) 1220.04
Temperature / K 296
Crystal system orthorhombic
Space group Pna2(1)
Unit cell dimension
a / Å 23.7204 (7)
b / Å 14.4607(5)
c / Å 17.3534(6)
V / Å3 5952.5(3)
Z 4
Density (calcd.) / (g cm-3 ) 1.361
Absorption coefficient / mm-1 0.459
F (000) 2512
Crystal size / mm3 0.43 × 0.42 × 0.30
θ range data collection / degree 1.65 to 25.04
Index range –24 ≤ h ≤ 28;
– 17 ≤ k ≤ 17;
– 15 ≤ l ≤ 20
Reflection collected 21774
Independent reflection 9009 [R(int) = 0.0190]
Completeness (to θ = 25.04°) / % 99.5
Absorption correction semi-empirical from equivalents
Data / restraint / parameter 9009 / 16 / 766
Goodness-of-fit on F2 1.041
Final R indices [I > 2sigma(I)] R1 = 0.0243, wR2 = 0.0579
R indices (all data) R1 = 0.0275, wR2 = 0.0600
Absolute structure parameter – 0.011(16)
a thermostatic bath. The viscosity of the ct-DNA solution was measured in the presence of increasing amounts of the complexes 1 and 2. The flow times were measured
with an automated timer. Each sample was measured three times, and an average flow time was calculated. The obtained data are presented as (η/η0)1/3versus binding ratio ([Ru]/[DNA]), where η is the viscosity of ct-DNA in the presence of the complexes and η0 is the viscosity of ct-DNA alone in buffer solution.24-26
Human cell lines and culture conditions
For the experiments, four different human cell lines from the 4th through 12th passages were used: HepG2 (hepatocellular carcinoma), MCF-7 (breast adenocarcinoma), MO59J (glioblastoma) and GM07492A (normal lung fibroblasts). The different cell lines were maintained as monolayers in plastic culture flasks (25 cm2) containing HAM-F10 plus Dulbecco’s Modified Eagle Medium (DMEM), 1:1 (Sigma-Aldrich) or only DMEM, depending on the cell line, supplemented with 10% foetal bovine serum (Nutricell) and 2.38 mg mL-1 Hepes (Sigma-Aldrich) at 37 °C in a humidified
5% CO2 atmosphere. Antibiotics (0.01 mg mL-1
streptomycin and 0.005 mg mL-1 penicillin;
Sigma-Aldrich) were added to the medium to prevent bacterial growth.
Cell viability assay related to human cell lines
Cytotoxic activity on the cell lines was assessed using the Colorimetric Assay in vitro Toxicology-XTT Kit (Roche
Diagnostics) according to the manufacturer’s instructions. For the experiments, 1 × 10⁴ cells were seeded into microplates with 100 µL of culture medium (1:1 HAM F10 + DMEM or DMEM alone) supplemented with 10% fetal bovine serum containing concentrations of the ruthenium complexes ranging from 1.5625 to 1600 µg mL-1. Negative (no treatment), solvent (0.02% DMSO) and positive (25% DMSO) controls were included. Positive controls comprising cisplatin (Sigma-Aldrich, ≥ 98% purity) were included. After incubation at 36.5 °C for 24 h, the culture medium was removed and cells were washed with 100 µL of phosphate-buffered saline (PBS) to remove the treatments, after which they were exposed to 100 µL of HAM-F10 culture medium without phenol red. Then, 25 µL of XTT were added and the cells were incubated at 36.5 °C for 17 h. The absorbance of the samples was determined using a multi-plate reader (ELISA-Tecan-SW Magellan vs 5.03 STD 2P) at a wavelength of 450 nm and a reference length of 620 nm.
Statistical analysis related to human cell line assays
Cytotoxicity was assessed using the IC50 response parameter (50% cell growth inhibition) calculated with the GraphPad Prism program, plotting cell survival against the respective concentrations of the treatments. One-way ANOVA was used for the comparison of means (p < 0.05).
The selectivity index was calculated by dividing the IC50 value of the isolated compounds on GM07492-A cells by the IC50 value determined for human cancer cells.
Results and Discussion
Synthesis
The reaction of sodium salts of diclofenac and ibuprofen with the ruthenium(II) diphosphine precursor complex cis
-[RuCl2(dppm)2] resulted in the products 1 and 2 by chlorido exchange under mild conditions as showed in Scheme 1.
The yellow ruthenium(II) complexes 1 and 2 were
isolated as pure solids from methanol, in reasonable to good yields. The elemental analyses are described in experimental section and they agreed well with the proposed formulations. The molar conductance values measured in methanol at room temperature range from 98 to 104 S cm2 mol-1, revealing the 1:1 electrolytic nature of these complexes.27 Complexes are air stable both in the solid state and in DMSO solutions as evaluated by 31P{1H} NMR and UV-Vis experiments for a period of 48 h.
Infrared spectroscopy
The infrared spectra (IR) of complexes 1 and 2 shows
the typical asymmetric νas(COO–) and symmetric νs(COO–) carboxylate stretching frequencies at 1522; 1452 cm-1 (1) and 1516; 1461 cm-1 (2), respectively, as showed in Figure 2.
The Dν values of 70 cm-1 for complex 1 and 55 cm-1 for 2 are indicative of a η2 binding mode of the carboxylate group.21 In addition, for complex 1, characteristic vibrational modes of the diclofenac ligand at 3344 and 1100 cm-1 were observed, corresponding to νNH and νPh−Cl, respectively. For both compounds the characteristic P–F stretch of the PF6– counterion was seen at 837 cm-1.28 Most of the vibrational modes observed were characteristic of the dppm ligands occurring practically at same frequencies observed for the precursor cis-[RuCl2(dppm)2].
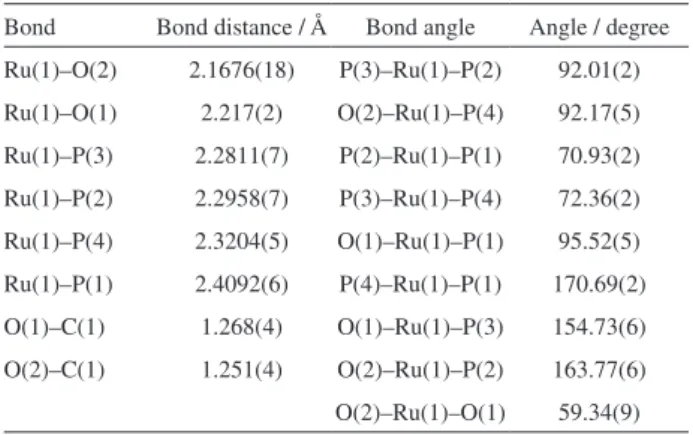
X-ray structure analyses
X-ray structure analyses of the complex 2 confirm the
atom numbering scheme is depicted in Figure 3. Selected bond lengths and angles are presented in Table 2.
Two disordered positions were refined for the fragment which includes the chiral center C(2) as well as the methyl and hydrogen groups attached to it. The two sites are shown together in Figure 3. The solid lines (labeled A) indicate the bonds between the atoms with higher occupation factor (68.4%), whereas the dashed lines (labeled B) represent the species with the lower occupation (31.6%). Plots showing the major and minor components of the disordered structure observed in 2 separately can be found
as supplementary information (Figures S1 and S2). The
reason for the disorder can clearly be derived from the orientation of the ligand due to the presence of the chiral center C(2), and consequently, two complex species with the ligand in R (major component) and S (minor
component) configurations could be detected in the solid structure of the compound. Since the ligand used was a racemic mixture of ibuprofen, it is reasonable that both
R and S isomers react with ruthenium(II) precursor. In
fact, the 31P{1H} NMR of a powder of complex 2 also shows two set of signals with relative integration 60:40, revealing that these species are also preserved in solution Scheme 1. Route for the synthesis of complexes 1 and 2.
Ru
Cl P
P
Cl P
P
NH4PF6, CH3OH
−NH4Cl, NaCl
PF6
Ru
O P
P
O P
P O
NaO
H N
Cl Cl
H3C
NaO O
CH3 CH3
1
2
PF6
Ru
O P
P
O P
P
CH3 H3C
H3C Ligands
H N
Cl Cl
sodium diclofenac
sodium ibuprofen
cis-[RuCl2(dppm)2] NH4PF6, CH3OH
−NH4Cl, NaCl
1560 1540 1520 1500 1480 1460 1440 1420 1400
90 95 100 105
ν
s(COO
-)
T
ra
n
s
m
it
ta
n
c
e
/
%
Wavenumber / cm-1
cis-[Ru(dicl)(dppm)2]PF6 cis-[Ru(ibu)(dppm)2]PF6 cis-[RuCl2(dppm)2]
ν
as(COO
-)
Figure 2. IR spectra of cis-[Ru(dicl)(dppm)2]PF6 (1), cis-[Ru(ibu)(dppm)2]
PF6 (2) and cis-[RuCl2(dppm)2] in the range of 1560-1400 cm-1.
Figure 3. ORTEP view of the cation complex cis-[Ru(ibu)(dppm)2]+ (2)
showing thetwo disordered forms of ibuprofen ligand. The PF6– counterion
(see solution studies). Furthermore, the observation of the two types of isomers in the same crystal is not very common. This can be explained as a case of static disorder where 2 presents the R and S configurations distributed
among different unit cells.29
This compound crystallizes in the orthorhombic system, space group Pna2(1), with the Ru center adopting a distorted octahedral coordination geometry formed by two cis-chelating diphosphine ligands and the bidentate (η2) carboxylate group of the ibuprofen ligand. The distortions are caused by chelation angles of 70.93(2) and 72.36(2)o imposed by the methylene bridge of dppm ligands and especially by the carboxylate group with an O(1)–Ru–O(2) angle of only 59.34(9)o. This small angle found for the carboxylate group is very similar to that observed for ruthenium(II) complexes containing coordinated acetate and other carboxylates in the bidentate fashion.30-32 The Ru–P bond lengths vary from 2.3204(5) to 2.4092(6) Å for mutually trans disposed phosphorus atoms and from
2.2811(7) to 2.2958(7) Å for phosphorus atoms trans
positioned to oxygen atoms from de carboxylate group. These marked differences clearly illustrate the greater
trans-influence of phosphorus when compared with
oxygen.31-33 The carboxylate ligand is coordinated with a certain degree of asymmetry as illustrated by the Ru–O distances of 2.1676(18) and 2.217(2) Å. These values are in the range reported for similar compounds.30-35 This asymmetry probably is due some weak interactions of the phenyl group of ibuprofen with adjacent phenyl rings of dppm. This kind of asymmetry was previously observed for ruthenium(II) ferrocenylcarboxylates.34
31P{1H} Nuclear magnetic resonance (NMR) spectroscopy
The 31P{1H} NMR spectra of complexes 1 and 2 show typical patterns of species containing two cis positioned
diphosphines and equal ligands completing the octahedral
coordination sphere. For complex 1 a pair of triplets
that integrate in 1:1 ratio with chemical shifts at 8.2 and –12.8 ppm was observed. The splitting pattern was consistent with an A2X2 (∆ν/ J = 87) assignment similar to those described for analogous complexes.34 For complex 2 a slightly different behavior was observed. In the more deshielded region two triplets with very close chemical shifts (8.4 and 8.2 ppm) appeared, besides one triplet in the shielded region (–12.3 ppm), as showed in Figure 4.
The integration of the triplets at 8.4 and 8.2 ppm are in the 1:1 ratio with the triplet at –12.3 ppm. This behavior clearly indicates the presence of a mixture of two very similar species and based on the integration of each line of the signals close to 8 ppm it is found a 60:40 ratio between the species. This ratio is in agreement with the two configurations of ibuprofen ligand observed in crystal structure of the complex 2 as previously discussed.
The splitting pattern is also consistent with an A2X2 assignment with ∆ν/ J = 88 and 87 for each one of the
configurations. In addition, since the PF6– counterion was utilized, it was observed the characteristic septet due to the phosphorus-fluorine coupling with chemical shift centered at –144.6 ppm for both complexes.
High-resolution mass spectrometry (HRESI)
Mass spectra of complexes containing ruthenium are typical for their isotopic pattern demonstrated by the presence of 96Ru (5.5%), 98Ru (1.9%), 99Ru (12.7%), 100Ru (12.6%), 101Ru (17.1%), 102Ru (31.6%) and 104Ru (18.6%) isotopes, with the nuclide abundance in parentheses. Furthermore, complex 1 had a ligand with chlorine (35Cl (75.8%) and 37Cl (24.2%)) which contributes with an additional isotopic pattern (Figure 5). The high-resolution mass spectra of the compounds 1 and 2 were recorded and the
obtained data confirm the established pattern (Figures 5a and 5b). In this study, the m/z values listed below in
the text refer to the peak of the most abundant element corresponding to the 102Ru isotope. The HRMS spectra were acquired in the positive mode and the charged complex ions were observed at m/z 1164.1520 [M]+ (1) and
1075.2660 [M]+ (2), in agreement with calculated values for C64H54Cl2NO2P4Ru, 1164.1520 and C63H61O2P4Ru, 1075.2660, respectively. Collision-induced dissociation (CID) experiments (MS/MS) with an increasing collisional energy using N2 as collision gas under the selected ions at
m/z 1164.1520 [M]+ (1) and 1075.2660 [M]+ (2), showed
a fragmentation pathway just for complex 1 even in higher
collisional energies. The loss of 295 u was proposed for a neutral elimination of the ligand (diclofenac, acid form) (Figure 5c).
Table 2. Selected bond distances and angles for complex 2
Bond Bond distance / Å Bond angle Angle / degree
Ru(1)–O(2) 2.1676(18) P(3)–Ru(1)–P(2) 92.01(2)
Ru(1)–O(1) 2.217(2) O(2)–Ru(1)–P(4) 92.17(5)
Ru(1)–P(3) 2.2811(7) P(2)–Ru(1)–P(1) 70.93(2)
Ru(1)–P(2) 2.2958(7) P(3)–Ru(1)–P(4) 72.36(2)
Ru(1)–P(4) 2.3204(5) O(1)–Ru(1)–P(1) 95.52(5)
Ru(1)–P(1) 2.4092(6) P(4)–Ru(1)–P(1) 170.69(2)
O(1)–C(1) 1.268(4) O(1)–Ru(1)–P(3) 154.73(6)
O(2)–C(1) 1.251(4) O(2)–Ru(1)–P(2) 163.77(6)
Ct-DNA binding studies: UV-Vis spectrophotometrical and viscosity studies
In an attempt to study the nature of the ruthenium complexes interactions with ct-DNA, UV-Vis absorption spectra were obtained by titration of the complexes with increasing concentrations of ct-DNA. The electronic spectra of complexes 1 and 2 showed an intense absorption peak
around 264 nm, which could be attributed to an intraligand π-π* transition of the coordinated groups in the complex, that has been selected to study the spectral changes with ct-DNA addition. Both complexes displayed the same behavior in which absorption decreases with ct-DNA titration, however, this characteristic is attributed only to dilution effects. This was demonstrated by titration of the complexes with buffer solution (not containing ct-DNA) in which the same absorption decrease was observed. All these spectra are showed in supplementary information (Figure S4). These data showed that these complexes do not exhibit covalent or intercalative interactions with ct-DNA.36,37 Due to the very weak interaction (hypochromism < 3%) was not possible determine the intrinsic binding constant (Kb) between the ruthenium complexes and ct-DNA.
The possible mode of interaction between complexes and ct-DNA was also evaluated by viscosity experiments. It
is well known that classical intercalators, such as ethidium bromide, lead to an increase in the viscosity of ct-DNA because separation of the base pairs occurs to accommodate the intercalator. A covalent DNA-binding mode may cause its fragmentation, thus decreasing the ct-DNA viscosity.38-40 However, complexes 1 and 2, exhibited essentially no
effect on the viscosity of ct-DNA as demonstrated in a plot (η/ηo)1/3versus [complex]/[DNA] showed in supplementary information (Figure S5). This result is consistent with existence of electrostatic interactions between ruthenium complexes and ct-DNA.25,26 Considering the molecular structure and positive charge of the complexes, electrostatic interactions involving the negatively charged phosphate groups of ct-DNA are expected.
In vitro cytotoxic activity
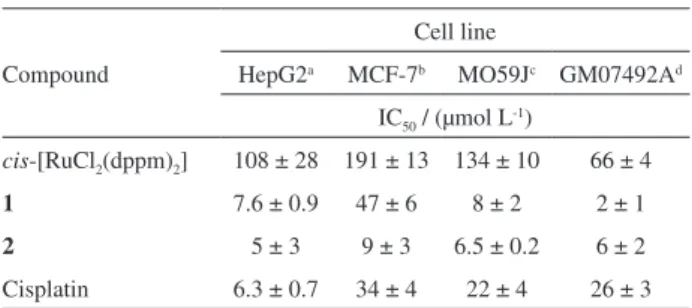
The human cell lines were exposed to the ruthenium(II) complexes and cisplatin for a period of 24 h, in order to allow them reach DNA or any other biological target. The IC50 values, calculated from the dose-survival curves generated by the XTT assays obtained after drug treatment are shown in Table 3.
Complexes 1 and 2 have showed, in general, high
cytotoxicity against all the human tumor cell lines assayed
-19 -16 -13 -10 -8 -6 -4 -2 0 1 2 3 4 5 6 7 8 9 11 13 15 17
chemical shift / ppm Phosphorus D2O
-1
2
.2
5
8
.1
6
8
.3
6
2
PF6
Ru
O P
P
O P
P
CH3
H3C
H3C
8.0 8.4 8.8
f1 (ppm)
7
.9
3
8
.1
2
8
.1
6
8
.3
6
8
.4
0
8
.6
0
-12.4 -11.8
-1
2
.4
9
-1
2
.2
5
-1
2
.0
2
Figure 4. 31P [1H] NMR spectrum (162.0 MHz, CH
1164.1520
+MS, 4.6min #277
0.0 0.2 0.4 0.6 0.8 6 x10 Intens.
200 400 600 800 1000 1200 1400 1600 1800 m/z
1075.2660
+MS, 10.3min #612
0.00 0.25 0.50 0.75 1.00 1.25 6 x10 Intens.
200 400 600 800 1000 1200 1400 1600 1800 m/z
869.1415
1164.1582
+MS2(1164.1582), 40eV, 7.8min #467
0 2 4 6 5 x10 Intens.
200 400 600 800 1000 1200 m/z
Ru
O P
P
O P
P
[M]+
H N
Cl
Cl 1158.1509
1164.1520 1166.1516
1161.1499 1162.1499
1163.15061165.1520 1167.1519
1168.1497
1169.1510
1170.1509 1159.1552
1160.1499
1157.5 1160.0 1162.5 1165.0 1167.5 1170.0
1069.2645 1070.2674
1072.2632 1073.2642
1074.2656 1075.2660
1077.2660
1078.2666
1079.2698 1080.2683 1076.2670
1071.2693
+MS, 10.3min #612
1070 1072 1074 1076 1078 1080
[M]+ Ru
O P
P
O P
P
CH3
H3C
H3C
(a)
(b)
(c)
Ru
O P
P
O P
P
H N
Cl Cl
Ru P
P P
P
[M]+
−
− dicl
dicl
m/z1164 m/z869
H H
Figure 5. ESI mass spectra of cis-[Ru(dicl)(dppm)2]+ (1) and cis-[Ru(ibu)(dppm)2]+ (2). (a) HRESI-MS spectrum of cis-[Ru(dicl)(dppm)2]+m/z 1164.1520
[M]+ (calcd. for C
64H54Cl2NO2P4Ru, 1164.1520); (b) HRESI-MS spectrum of cis-[Ru(ibu)(dppm)2]+m/z 1075.2660 [M]+ (calcd. for C63H61O2P4Ru, 1075.2660)
[Ru(dicl)(dppm)2]PF6 (1) and [Ru(ibu)(dppm)2]PF6 (2) were synthesized and characterized by elemental analysis, X-ray crystallography, spectroscopic and spectrometric methods. The spectroscopic analyses are in agreement with a chelated coordination through the carboxylate group, for the diclofenac and ibuprofen ligands. The crystallographic studies for the ibuprofen derivative revealed two configurations for the ligand in the crystalline structure. Viscosity experiments suggest an electrostatic interaction between ct-DNA and complexes 1 and 2.
The in vitro cytotoxicity activity assays of the complexes
indicate a high activity against three human tumor cell lines. Indeed one of the complexes was more active than cisplatin against two tumor cells. Interestingly, exchanging chlorido ligands of the cis-[RuCl2(dppm)2] by diclofenac and ibuprofen resulted in higher cytotoxic activity probably due to the differences in lipophilicity upon complexation influencing the amount of compound that gets inside the cells. Further studies are necessary to verify the biological targets of this class of ruthenium(II) complexes. Although these complexes displayed low selectivity they present potential for the treatment of breast adenocarcinoma and gliobastoma since they present similar SI value to that of cisplatin but a higher activity, so they could be used in lower concentrations.
Supplementary Information
Supplementary information is available free of charge at http://jbcs.org.br as PDF file.
Coordinates and other crystallographic data have been deposited with the CCDC, deposition code CCDC 1040297. Copies of the data can be obtained, free of charge, via www. ccdc.cam.ac.uk/conts/retrieving.html or from the Cambridge Crystallographic Data Centre, CCDC, 12 Union Road, Cambridge CB2 1EZ, UK; fax: +44 1223 336033. E-mail: [email protected].
Acknowledgements
We thank CNPq, CAPES, FAPESP (Grant 2009/54011-8), the Minas Chemical Network and FAPEMIG (Grant APQ-04010-10). The authors are also thankful to the Grupo de Materiais Inorgânicos do Triângulo-GMIT research group supported by FAPEMIG (APQ-00330-14).
References
1. Jamieson, E. R.; Lippard, S. J.; Chem. Rev. 1999, 99, 2467.
2. Wang, D.; Lippard, S. J.; Nat. Rev. Drug Discov.2005, 4,
307. with IC50 values ranging from 5 to 9 µmol L-1, except
for complex 1 in MCF-7 cells that showed a moderate
cytotoxicity as presented in Table 3. Complex 2 displayed
higher activity than 1 in all the tumor cell lines assayed
with similar IC50 values independent of the cell line. This non-selective activity of complex 2 was not observed
for complex 1 that was much less cytotoxic in MCF-7
cells. Compared with the reference metallodrug cisplatin, complex 1 displayed approximately the same cytotoxic
activity for HepG2 and MCF-7 cells and a three times increased activity for MO59J cells. Complex 2 had similar
activity to cisplatin for HepG2 cells and a four times increased activity against MCF-7 and MO59J cells. The selectivity index (SI) (SI = IC50 GM07492A / IC50 human tumor cell line) was smaller than 1 for all the cell lines assayed for complex 1, while for complex 2 the SI values
are very close to 1, both indicating a low selectivity. Under the same experimental conditions cisplatin also displayed SI values close to 1 for MCF-7 and MO59J tumor cell lines. The precursor complex cis-[RuCl2(dppm)2] was less active than the complexes 1 and 2 by factors
ranging from 4.1 to 21.6. A similar increase in toxicity was observed against the normal cell line GM07492A. These data clearly indicates that the exchange of two chlorido ligands by a bidentate anti-inflammatory molecule makes the cis-[Ru(dppm)2]2+ unity complex more cytotoxic, probably due to the different lipophilicity and consequent entrance in the cells. Further experiments concerning the amount of ruthenium complex that gets inside the cells as well as its intracellular targets, beyond DNA, are required to understand details of the observed activity and will be a point of study in a near future.
Conclusions
In this investigation two new ruthenium(II) complexes containing dppm and the anions of anti-inflammatory drugs diclofenac and ibuprofen with formula Table 3. Inhibitory activity of ruthenium(II) complexes and cisplatin
against normal and tumor cell lines, expressed as IC50
Compound
Cell line
HepG2a MCF-7b MO59Jc GM07492Ad
IC50 / (µmol L-1)
cis-[RuCl2(dppm)2] 108 ± 28 191 ± 13 134 ± 10 66 ± 4
1 7.6 ± 0.9 47 ± 6 8 ± 2 2 ± 1
2 5 ± 3 9 ± 3 6.5 ± 0.2 6 ± 2
Cisplatin 6.3 ± 0.7 34 ± 4 22 ± 4 26 ± 3
aHepG2: hepatocellular carcinoma; bMCF-7: breast adenocarcinoma;
3. Dasari, S.; Tchounwou, P. B.; Eur. J. Pharmacol.2014, 740, 364.
4. Wheate, N. J.; Walker, S.; Craig, G. E.; Oun, R.; Dalton Trans.
2010, 39, 8113.
5. Mjos, K. D.; Orvig, C.; Chem. Rev.2014, 114, 4540.
6. Barry, N. P. E.; Sadler, P. J.; Chem. Commun.2013, 49, 5106.
7. Hartinger, C. G.; Zorbas-Seifried, S.; Jakupec, M. A.; Kynast,
B.; Zorbas, H.; Keppler, B. K.; J. Inorg. Biochem. 2006, 100,
891.
8. Ang, W. H.; Casini, A.; Sava, G.; Dyson, P. J.; J. Organomet.
Chem.2011, 696, 989.
9. Bergamo, A.; Gaiddon, C.; Schellens, J. H. M.; Beijnen, J. H.;
Sava, G.; J. Inorg. Biochem.2012, 106, 90.
10. Kostova, I.; Curr. Med. Chem.2006, 13, 1085.
11. Bratsos, L.; Jedner, S.; Gianferrara, T.; Alessio, E.; Chimia
2007, 61, 692.
12. Pillozzi, S.; Gasparoli, L.; Stefanini, M.; Ristori, M.; D’Amico, M.; Alessio, E.; Scaletti, F.; Becchetti, A.;
Arcangeli, A.; Messori, L.; Dalton Trans.2014, 43, 12150.
13. Trondl, R.; Heffeter, P.; Kowol, C. R.; Jakupec, M. A.;
Berger, W.; Keppler, B. K.; Chem. Sci.2014, 5, 2925.
14. Hartinger, C. G.; Jakupec, M. A.; Zorbas-Seifried, S.; Groessl, M.; Egger, A.; Berger, W.; Zorbas, H.; Dyson, P. J.;
Keppler, B. K.; Chem. Biodivers.2008, 5, 2140.
15. Oszajca, M.; Kulis, E.; Stochel, G.; Brindell, M.; New J. Chem.
2014, 38, 3386.
16. Pavan, F. R.; Von Poelhsitz, G.; Nascimento, F. B.; Leite, S. R. A.; Batista, A. A.; Deflon, V. M.; Sato, D. N.; Franzblau,
S. G.; Leite, C. Q. F.; Eur. J. Med. Chem.2010, 45, 598.
17. Pavan, F. R.; Von Poelhsitz, G.; Cunha, L. V. P.; Barbosa, M. I. F.; Leite, S. R. A.; Batista, A. A.; Cho, S. H.; Franzblau, S. G.; Camargo, M. S.; Resende, F. A.; Varanda, E. A.; Leite,
C. Q. F.; PloS One2013, 8, e64242.
18. Wang, J.; Hughes, T. P.; Kok, C. H.; Saunders, V. A.; Frede, A.; Groot-Obbink, K.; Osborn, M.; Somogyi, A. A.; D’Andrea,
R. J.; White, D. L.; Br. J. Cancer2012, 106, 1772.
19. Moser, P.; Sallmann, A.; Wiesenberg, I.; J. Med. Chem.1990,
33, 2358.
20. Dahl, J. B.; Kehlet, H.; Br. J. Anaesth.1991, 66, 703.
21. Sullivan, B. P.; Meyer, T. J.; Inorg. Chem.1982, 21, 1037.
22. Sheldrick, G. M.; SHELXS-97; Program for Crystal Structure
Resolution; University of Göttingen, Germany, 1997.
23. Sheldrick, G. M.; SHELXL-97; Program for Crystal Structures
Analysis; University of Göttingen, Germany, 1997.
24. Cohen, G.; Eisenberg, H.; Biopolymers1969, 8, 45.
25. Satyanarayana, S.; Dabrowiak, J. C.; Chaires, J. B.; Biochemistry
1993, 32, 2573.
26. Satyanarayana, S.; Dabrowiak, J. C.; Chaires, J. B.; Biochemistry
1992, 31, 9319.
27. Geary, W. J.; Coord. Chem. Rev.1971, 7, 81.
28. Nakamoto, K.; Infrared and Raman Spectra of Inorganic and
Coordination Compounds, 5th ed.; Wiley-Interscience: New
York, 1997.
29. Muller, P.; Herbst-Irner, R.; Spek, A. L.; Schneider,
T. R.; Sawaya, M. R.; Crystal Structure Refinement: a
Crystallographer´s Guide to SHELXL, Oxford University Press: New York, 2006.
30. Jia, G. C.; Rheingold, A. L.; Haggerty, B. S.; Meek, D. W.; Inorg. Chem.1992, 31, 900.
31. Murray, A. H.; Yue, Z.; Wallbank, A. I.; Cameron, T. S.;
Vadavi, R.; MacLean, B. J.; Aquino, M. A. S.; Polyhedron 2008,
27, 1270.
32. Lucas, N. T.; Powell, C. E.; Humphrey, M. G.; Acta Crystallogr.
C2000, 56, 392.
33. Coe, B. J.; Glenwright, S. J.; Coord. Chem. Rev.2000, 203, 5.
34. Wyman, I. W.; Burchell, T. J.; Robertson, K. N.; Cameron, T. S.;
Aquino, M. A. S. Organometallics2004, 23, 5353.
35. Sanchez-Delgado, R. A.; Thewalt, U.; Valencia, N.; Andriollo, A.; Marquezsilva, R. L.; Puga, J.; Schollhorn, H.; Klein, H. P.; Inorg. Chem.1986, 25, 1097.
36. Zhang, Q. L.; Liu, J. G.; Chao, H.; Xue, G. Q.; Ji, L. N.; J. Inorg.
Biochem.2001, 83, 49.
37. Kalaivani, P.; Prabhakaran, R.; Dallemer, F.; Vaishnavi, E.; Poornima, P.; Vijaya Padma, V.; Renganathan, R.; Natarajan, K.; J. Organomet. Chem.2014, 762, 67.
38. Sellamuthu, A.; Ravishankaran, R.; Karande, A. A.;
Kandaswamy, M.; Dalton Trans.2012, 41, 12970.
39. Zivec, P.; Perdih, F.; Turel, I.; Giester, G.; Psomas, G.; J. Inorg.
Biochem.2012, 117, 35.
40. Navarro, M.; Castro, W.; Higuera-Padilla, A. R.; Sierraalta, A.;
Abad, M. J.; Taylor, P.; Sanchez-Delgado, R. A.; J. Inorg.
Biochem. 2011, 105, 1684.
Submitted: April 23, 2015
Published online: June 30, 2015
![Figure 2. IR spectra of cis-[Ru(dicl)(dppm) 2 ]PF 6 (1), cis-[Ru(ibu)(dppm) 2 ]](https://thumb-eu.123doks.com/thumbv2/123dok_br/18998985.463112/5.892.230.795.108.819/figure-ir-spectra-cis-ru-dicl-dppm-dppm.webp)
![Figure 4. 31 P [ 1 H] NMR spectrum (162.0 MHz, CH 2 Cl 2 /D 2 O) of complex 2.](https://thumb-eu.123doks.com/thumbv2/123dok_br/18998985.463112/7.892.101.761.95.573/figure-p-nmr-spectrum-mhz-ch-cl-complex.webp)
![Figure 5. ESI mass spectra of cis-[Ru(dicl)(dppm) 2 ] + (1) and cis-[Ru(ibu)(dppm) 2 ] + (2)](https://thumb-eu.123doks.com/thumbv2/123dok_br/18998985.463112/8.892.134.784.103.1064/figure-esi-mass-spectra-cis-dicl-dppm-dppm.webp)