Bol. Ciênc. Geod., sec. Artigos, Curitiba, v. 18, no 2, p.171-184, abr-jun, 2012.
INVESTIGATION OF ACCURATE METHOD IN 3-D
POSITION USING CORS-NET IN ISTANBUL
Investigação de método acurado no posicionamento 3D baseado em CORS-NET em Istambul
KUTALMIS GUMUS1 CAHIT TAGI CELIK2
HALIL ERKAYA3
1,3
Yildiz Technical University Civil Engineering Faculty
Geomatic Engineering Istanbul – 34349 - Turkey
2
Nigde University, Engineering Faculty Department of Surveying Engineering
Nigde 51200 Turkey.
[email protected] ; [email protected] ; [email protected]
ABSTRACT
In this study, for Istanbul, there are two Cors Networks (Cors-TR, Iski Cors) providing Virtual Reference Station (VRS), and Flachen Korrektur Parameter (FKP), corrections to rover receiver for determining 3-D positions in real time by Global Positioning System (GPS). To determine which method (or technique) provides accurate method for position fixing, a test network consisting of 49 stations was set up in Yildiz Technical University Davudpasa Campus. The coordinates of the stations in the test network were determined by conventional geodetic, classical RTK, VRS and FKP methods serviced by both Cors-TR and Iski Cors. The results were compared to the coordinates by the conventional method by using total station. The results showed a complex structure as the accuracy differs from one component to another such as in horizontal coordinates, Y components by CorsTR_VRS and Cors_TR_ FKP showed ‘best’ results while the same technique provided X components consistent accuracy with the Y component but less accurate than by real time kinematic (RTK). In vertical components, of all the techniques used for the h components, CorsTR_VRS showed ‘best’ accuracy with three outliers.
Keywords: CORS-TR; Iski CORS; RTK; CORS-NETWORK; Virtual Reference
Investigation of accurate method in 3-D position using CORS-NET in Istanbul.
Bol. Ciênc. Geod., sec. Artigos, Curitiba, v. 18, no 2, p.171-184, abr-jun, 2012.
1 7 2
RESUMO
Nessa pesquisa foram utilizados dados de duas redes de estações de referência de Istambul (Cors-TR, Iski Cors) que disponibilizam correções provindas do conceito de VRS (Virtual Reference Station) e FKP (Flachen Korrektur Parameter). A partir dessas correções o usuário determina posições 3D em tempo real usando GPS. Para determinar qual método (ou técnica) obtém posicionamento mais acurado, uma rede teste com 49 estações foi selecionada no campus da Yildiz Technical University Davudpasa. As coordenadas das estações nessa rede teste foram obtidas pelo método clássico RTK e pelos métodos VRS e FKP das redes Cors-TR e Iski Cors. Os resultados foram comparados com as coordenadas obtidas com o método convencional de estação total. Os resultados mostraram uma complexa estrutura, pois a acurácia difere de uma componente para outra. Por exemplo, nas coordenadas horizontais, a componente Y da CorsTR_VRS e Cors_TR_ FKP mostrou os ‘melhores’ resultados. Mas, para a componente X os resultados mais acurados foram obtidos no RTK. Na componente vertical, entre todas as técnicas usadas para determinar a componente h, o método CorsTR_VRS apresentou as ‘melhores’ acurácias com três erros grosseiros.
Palavras-chave: CORS-TR; Iski CORS; RTK; CORS-NETWORK; Virtual
Reference Station (VRS); Flachen Korrektur Parameter (FKP).
1. INTRODUCTION
Gumus, K. et al.
Bol. Ciênc. Geod., sec. Artigos, Curitiba, v. 18, no 2, p.171-184, abr-jun, 2012.
1 7 3 Butun Baybura (2010); so more studies need carrying out on the subject to make a clear understanding.
This paper aims at determining accurate method among CorsTR_VRS, CorsTR_FKP, IskiCors_VRS, IskiCors_FKP and classical RTK compared to the coordinates obtained by conventional geodetic position fixing method using total stations. A test network was established in Yildiz Technical University Davutpaşa Campus. The network consists of 49 stations whose positions were fixed by the methods mentioned above and the results were presented.
2. MATERIALS AND METHODS
To find out accurate method of determining point coordinates by GPS, there are two cors networks involved in this study namely; Cors-TR covered country-wide Turkey and Iski-Cors consists of only 8 stations serving only in Istanbul city, Turkey. A brief description of the networks and the method used to calculate corrections virtual reference station (VRS) and Flachen Korrektur Parameter (FKP) are described. Then acquired data was introduced.
2.1 Continuous Operating Reference Stations Networks (Cors-NET)
Differential Global Positioning System (DGPS) based on pseudo-range observations provides real time positioning in meter level provided that there is/are satellite broadcasting correction parameters a roving receiver whose coordinates are in question (Lapucha & Maynard, 1992). However, for applications demanding high precision, phase observations are essential. In this case, integer ambiguity of the number of wavelength makes it more complicated. Current advances in GPS technology enabled us to determine real time positions using phase observations. This is called Real Time Kinematic (RTK) method. However, the distance between reference station and roving station affects the accuracy of position fixing.
To overcome this distance dependence problem, WAAS, WADGPS, etc. have been developed based on a number of control stations located in large areas but they also provide accuracy in decimeter level due to code observations ( Alves et al., 2011). Alternatively, countries established country-wide continuous operating stations network (Cors-Net) (Kahveci, 2009). To make Cors-Net clearly understood, first classical RTK will be given here.
2.2 Classical Real Time Kinematic (RTK)
Bol. Ciê 1 7 4 this te on onl 2.3 Th T observ user th located possib Cors-N Turkey be intr 2.4 Co T wide ( inAnk datum Contro FKP a reques correct Land R
T to calc
ênc. Geod., sec. A chnique is di y one referenc
he Cors-Netw
This technique vations from c hat demands d on country
le to determin Networks est
y, etc. Here T roduced.
ors-TR
There are 147 Figure 1) and ara and one . Observation ol center calcu and MAC. A sting correctio
tions are sent Registry and C Then the user culate its posit
Figure 1 - C
Investigation of
Artigos, Curitiba, stance depend ce station, the
works
e is based on c continuously o correction vi y-wide with a ne roving rec ablished arou Turkey’s Cors
7 continuously d three control in Istanbul. ns made at th ulates correcti A user (rover
ons via GSM to it. These c Cadastre Gene receiver is ca tion in cm leve
Continuously
f accurate method
v. 18, no 2, p.171 dent. Because ere is no contro
correction calc operating refer ia a suitable a certain dist ceiver position
und the wor s-network cal
y operating re centers (comp The reference he reference ions using thr
receiver) se M. Depending
corrections are eral Directorat apable to appl
el.
Operating Re
d in 3-D position
1-184, abr-jun, 20 e the correctio ol mechanism
culation at a c rence stations means. If th ance apart to n in cm level. rld including lled Cors-TR
eference statio mputation cente e station coo
stations are ree different te
nds its appro g on the tec e calculated u te.
ly these corre
eference Statio
n using CORS-NE
012.
ons are calcul m on it.
computation c s and they are
e reference s o each other, . There are a Germany, U (TUSAGA-A
ons located o ers); two of th ordinates are sent to contr echniques nam oximate coord chnique user using Trimble
ections to its o
ons in Cors-TR
ET in Istanbul. lated based
center using sent to the stations are then it is number of UK, USA, Active) will on country-hem located in ITRF96 rol centers. mely, VRS, dinates for requested, Net R5 by
observation
G 2 c s p T t f v p c s m f c a 3 n i D m c d t
Gumus, K. et al.
2.5 Iski-Cors
In Istanb called Iski Co stations distri provide VRS Topcon Geo P the rover rece fixed by using via the VRS to
FKP sta parameters). I corrections an station to the magnitude of farther (Wubb
Figure 2
-MAC s calculation w around it (Bro
3. DATA DE
To bring networks in T in the test net Davudpasa Ca
The met measurements classical RTK determination ten epochs of
Bol. C bul, there is an
ors (IskiCors) ibuted in Ista , FKP and M Plus Plus soft eiver which r g all the Cors o the user (Wa ands for Fl It uses the d nd then sent to e roving recei error gets big bena and Bagg
- Continuously
tands for M within the rovi own et al., 200
SCRIPTION
g about a ac Turkey, there a
twork consisti ampus (Figure thods used to s using total K, CorsTR-VR n of coordinate f measurement
iênc. Geod., sec. nother cors ne ) (www.iski.g anbul city bo MAC correcti tware. VRS lo requests corre stations data i anninger, 200 achen Korre data from all
o the requestin iver. The ma gger as the nea ge, 1998).
y Operating R
Master Auxilia ing receiver u 05).
N
ccurate metho are six metho ing of 49 stat e 3).
o determine th station (Nik RS, CorsTR_F
es, Topcon Hy t performed a
Artigos, Curitiba etwork establi gov.tr). This n oundary (Figu ions. These c ocates a virtua ection calcula in the network 03).
ektur Parame cors stations ng of the rove ain drawback arest cors stat
Reference Stat
ary Concept. using data re
od of position ds used to de ions located i
he coordinate kon DTM 33 FKP, IskiCors yper-Pro recei and the averag
a, v. 18, no 2, p.17 ished by Istan network consi ure 2). The n corrections a al reference st ated with N in k. Then the co
eter (flat (lin s in the netw er receiver via of this techn tion to the rov
ions in Iski C
. It is based ceived from
n fixing by G termine the p in Yildiz Tech
es were conve 32 with 3+ 2 s_VRS, and I iver was used ge of ten epoc
71-184, abr-jun, 2 nbul Municipa ists of only ei network can a re calculated tation as close nteger ambigu orrections are s
near) correct work to calcu
a the nearest c nique is that ving receiver g
ors Network.
d on correct the cors stati
GPS using C oints coordina hnical Univer
entional geod 2ppm precisio IskiCors_FKP
. For each stat chs was recor
2012. 1 7 5
Bol. Ciê 1 7 6 as me correct must b receive measu fixing determ point w distanc is a w less m positio contain we hav coordi temper techniq metho Fig
ênc. Geod., sec. A easured the c tions require be compatible ers had no uring MAC c with mm le mining the po whose coordin ces is very sho ell known fac measurements
on by total sta ned in the me ve checked co inates precisel rature effects que assumed ds were comp
gure 3 - Survey
Investigation of
Artigos, Curitiba, coordinates.
large amount e with MAC support for corrections. C evel accuracy oint coordinat nates were ch ort so the prec ct that the mo
for a position ation provided asurements. T oordinates for ly known. For s, atmospheri free from e pared to the co
yed stations in t
f accurate method
v. 18, no 2, p.171 The correctio t of data to b
corrections. MAC correc Conventional
. The above tes. Each poi hecked from a cision remain ore measurem n fixing was a d that there is To ensure ther
a particular p r possible sys ic pressure a errors and the onventional on
the Campus of D
d in 3-D position
1-184, abr-jun, 20 ons are sent
e transferred At the time ctions, so we
geodetic me mentioned to nt coordinate an alternative p
within few m ments means th a basic philos
no blunders a re is no blunde oint from an a stematic error and prism co e coordinates ne.
Davutpasa Yild
n using CORS-NE
012.
via GSM, via GSM and of field work e have not ethod provide otal station i es determined point. The ma mm (typically
he more error ophy in deter and no system ers in the mea alternative sta r we have con onstant. Ther s obtained by
diz Technical U
y.
ET in Istanbul. and MAC d hardware k, our GPS considered es position is used for d from one agnitude of 1-2mm). It r, therefore, rmining the matic errors asurements, ation whose nsidered air refore, this y the other
Gumus, K. et al.
Bol. Ciênc. Geod., sec. Artigos, Curitiba, v. 18, no 2, p.171-184, abr-jun, 2012.
1 7 7
4. DATA ANALYSIS
Accuracy is ‘closeness’ of quantities to their true values while precision is ‘closeness’ of quantities to their mean values. The strategy followed in this study is as follows. In a sample of coordinates representing the different positions (49 points) with different methods (five methods namely; classical RTK, CorsTR_FKP, CorsTR_VRS, IskiCors_FKP, and IskiCors_VRS), accuracy is the standard deviation of the coordinates differences from the true values. However, it is important to have data free from outlier. It is a well-known fact that an outlier contained in the data influence the mean of the data set dramatically. Therefore, a robust statistic, median, normality, shape of the data are necessary to comment on the data. A box plot may be drawn to see some of the above information in one place. A box plot is a graphic which can be interpreted in terms of spread, centrality, shape and unusual features.
The value of median is known to be the measure of centrality, and simultaneous examination of inter quartile range and the median value can reveal the shape of data. If there is any data outside the limit of whiskers, which means the data possess unusual features.
5. RESULTS AND DISCUSSION
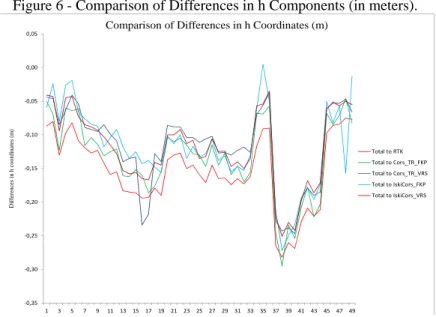
Point coordinates determined by total station are assumed to be free from errors and ‘most’ accurate method among the ones used in this study. Therefore, the coordinates obtained by this method were taken as ‘true’ coordinates. To investigate accurate methods we have used for 3-D positioning by GPS technology, accuracy estimation were performed by taking coordinate differences between true coordinates and the coordinates by classical RTK, CorsTR_FKP, CorsTR_VRS, IskiCors_FKP, and IskiCors_VRS have been taken correspondingly. The results of the differences organized in Y, X and ellipsoidal height h are given in Figures 4, 5, and 6.
Investigation of accurate method in 3-D position using CORS-NET in Istanbul.
Bol. Ciênc. Geod., sec. Artigos, Curitiba, v. 18, no 2, p.171-184, abr-jun, 2012.
1 7 8
Figure 4 - Comparison of Differences in Y Components (in meters).
Figure 5 - Comparison of Differences in X Components (in meters).
‐0,07 ‐0,05 ‐0,03 ‐0,01 0,01 0,03 0,05
1 3 5 7 9 11 13 15 17 19 21 23 25 27 29 31 33 35 37 39 41 43 45 47 49
Di
ff
eren
ces
i
n
Y
coo
rdi
na
te
s
(m
)
Comparison of Differences in Y Coordinates (m)
Total to RTK
Total to Cors_TR_FKP
Total to Cors_TR_VRS
Total to IskiCors_FKP
Total to IskiCors_VRS
‐0,13 ‐0,08 ‐0,03 0,02 0,07
1 3 5 7 9 11 13 15 17 19 21 23 25 27 29 31 33 35 37 39 41 43 45 47 49
Diff
er
en
ces
in
X
co
o
rd
in
ates
(m
)
Comparison of Differences in X Coordinates (m)
Total to RTK
Total to Cors_TR_FKP
Total to Cors_TR_VRS
Total to IskiCors_FKP
Gumus, K. et al.
Bol. Ciênc. Geod., sec. Artigos, Curitiba, v. 18, no 2, p.171-184, abr-jun, 2012.
1 7 9 Figure 6 - Comparison of Differences in h Components (in meters).
Below boxplots were created for the component differences to make sure the data are free from outliers. Figure 7 shows boxplots of Y component differences of the stations for the methods to be tested. It is clear from Figure 7 that Y components ranges are in order from ‘best’ to ‘worst’ as CorsTR_VRS, RTK, IskiCors_VRS, IskiCors_FKP and CorsTR_FKP. CorsTR_FKP range is the largest of all. An explanation to this might be CorsTR_FKP parameters were calculated from entire network and then were sent to the user via the nearest Cors_TR station, which may not be convenient parameters as compared to IskiCors_FKP, which were calculated from only 8 stations installed in Istanbul where this test data was collected. For this reason, IskiCors_FKP seems better than CorsTR_FKP.
It is expected that the centers of data from the methods tested tent to zero, because they are differences of Y components with respect to true coordinates. From the Figure 7, CorsTR_FKP and VRS are the closest to zero while the rest were approximately equally apart from the zero line. It is interesting that CorsTR_FKP technique produced zero median although its spread is the largest.
Moreover, IskiCors_FKP and VRS sound like Y components underwent some amount of shift among others. CorsTR_VRS coordinates showed symmetric distribution, which means the data is normally distributed while CorsTR_FKP slightly left skewed. It is clear from the figure that IskiCors_FKP and VRS data were left skewed while RTK slightly right skewed with no unusual features gap or outlier.
‐0,35
‐0,30
‐0,25
‐0,20
‐0,15
‐0,10
‐0,05 0,00 0,05
1 3 5 7 9 11 13 15 17 19 21 23 25 27 29 31 33 35 37 39 41 43 45 47 49
D
iffe
re
nc
es
i
n
h c
o
o
rd
ina
te
s
(m
)
Comparison of Differences in h Coordinates (m)
Bol. Ciê 1 8 0
F metho CorsTR IskiCo accura second all the F metho IskiCo median and VR symme From follow IskiCo
ênc. Geod., sec. A Figure 8 show ds to be test R_FKP, IskiC ors_FKP has ate median to d place, but Is techniques us
Figure 7
Figure 9 show ds to be test ors_VRS, Cor n of CorsTR_ RS, CorsTR_ etrical distrib the figure, it ws, one point i
ors_FKP.
Investigation of
Artigos, Curitiba, ws boxplots o ted. The rang Cors_VRS and an outlier (st the zero line, skiCors_FKP sed in the test,
7 - Box Plot of
ws the boxplots ted. The rang rsTR_VRS, C
_VRS is ‘clos _FKP and fina ution while t is clear that in CorsTR_FK
f accurate method
v. 18, no 2, p.171 f X compone ges are in or d CorsTR_VR tation ID=44)
following it, and VRS show , data sounds
f Y Componen
s of h compon ges are in or
orsTR_FKP a sest’ to the z ally RTK com the rest prese
some outliers KP, three poin
d in 3-D position
1-184, abr-jun, 20 ent difference rder from ‘be RS, and IskiCo
). RTK techn CorsTR_VRS wed some shi normally distr
nt Differences
nent differenc rder from ‘be and IskiCors_ ero line. Foll me in sequenc nt slightly rig s appear in th nts in CorsTR
n using CORS-NE
012.
s of the statio est’ to ‘worst
ors_FKP. It is nique provided
S and FKP co ift among the
ributed.
s (in meters).
ces of the stati est’ to ‘worst _FKP. Of all t owing it, Iski es. CorsTR_V ght skewed d he data sets. T R_VRS and tw
ET in Istanbul. ons for the t’ as RTK, s noted that
d the most omes in the others. For
ions for the t’ as RTK,
G
s l c e m d
Gumus, K. et al. Fi
Fi
In Table standard devia largest (0.021 classical RTK explanation to methods exce deviations tha
Bol. C igure 8 - Box P
igure 9 - Box
e 1, statistics ation of Y com 1 m) among o K, CorsTR_VR o this was m ept classical an that of Y co
iênc. Geod., sec. Plot of X Com
Plot of h Com
s of the met mponent of C
others. Y com RS, IskiCors_V mentioned ear
RTK reflect omponents.
Artigos, Curitiba mponent Diffe
mponent Diffe
thods used h orsTR_FKP f mponents are
VRS, IskiCor rlier. Howeve ted approxim
a, v. 18, no 2, p.17 erences (in me
rences (in me
have been su from the true c
in order from rs_FKP and C er, X compon mately 1 cm
71-184, abr-jun, 2 eters).
ters).
ummarized. H coordinates is m best to wo
orsTR_FKP. nents for all
higher stand
2012. 1 8 1
Investigation of accurate method in 3-D position using CORS-NET in Istanbul.
Bol. Ciênc. Geod., sec. Artigos, Curitiba, v. 18, no 2, p.171-184, abr-jun, 2012.
1 8 2
Stations’ X components are in order from best to worst classical RTK, CorsTR_FKP, IskiCors_VRS, and IskiCors_FKP and CorsTR_VRS. Here the explanation made earlier for IskiCors_FKP components is not supported, this may be because IskiCors_FKP and IskiCors_VRS showed shift pattern from the rest.
Of all the methods used in this study for the test, standard deviations of h components are half order lower than horizontal components.
The results in Table 1 may be compared to those of Gordini et al. (2006) which represented the evaluations of Cors Network Technologies included two cors network namely VICpos and MELBpos in Australia. They collected samples of 173795 epochs for only one test point from a sparse network, and produced the standard deviations in cm level and one order of higher magnitude for altimetric components. The results in the Table 1 are found to be slightly worse than that of Gordini et al. (2006).
Table1 - Statistics of Components Differences for Methods (in Meters).
Method
Name Components Min (m) Max (m) Mean (m) Std (m)
Total to RTK
Y -0.033 0.017 -0.009 0.011
X -0.040 0.025 -0.009 0.014
h -0.282 -0.075 -0.154 0.054
Total to CorsTR_FKP
Y -0.058 0.031 -0.004 0.021
X -0.015 0.064 0.023 0.018
h -0.295 -0.046 -0.133 0.058
Total to CorsTR_
VRS
Y -0.034 0.016 -0.003 0.014
X -0.060 0.060 0.019 0.027
h -0.247 -0.038 -0.117 0.059
Total to IskiCors_FKP
Y -0.031 0.037 0.006 0.017
X -0.099 0.023 -0.059 0.026
h -0.272 0.005 -0.118 0.060
Total to IskiCors_VRS
Y -0.028 0.027 0.005 0.015
X -0.111 -0.027 -0.071 0.022
h -0.251 -0.035 -0.119 0.056
Gumus, K. et al.
Bol. Ciênc. Geod., sec. Artigos, Curitiba, v. 18, no 2, p.171-184, abr-jun, 2012.
1 8 3
6. CONCLUSION
This study involves 49 observations site locations in Istanbul whose coordinates were determined by CorsTR-VRS, CorsTR_FKP, IskiCors_VRS, IskiCors_FKP, classical RTK and conventional geodetic position fixed method with total station. The coordinates components were related to the conventional method and their simple differences were taken to compare one technique to another.
The results showed a complex structure as the accuracy differs from one component to another such as Y components showed ‘best’ results by CorsTR_VRS and Cors_TR_FKP while the same technique provided X components consistent accuracy with the Y component but less accurate than RTK. Of all the techniques used for the h components, CorsTR_VRS showed ‘best’ accuracy with three outliers.
Another important conclusion one can draw from the test is that IskiCors_VRS and FKP showed some shift in X and Y component which need further research.
This result is compatible with Eren et al. (2009). Based on the results we obtained, it may be recommended that both CorsTR_VRS and FKP technique may be considered before final coordinate determinations.
ACKNOWLEDGMENTS
We would like to thank The Directorate of Istanbul Water and Sewage (ISKI) for their support by permission to use the iski_cors and the Land Registry and Cadastre General Directorate for Cors_TR data.
REFERENCES
ALVES, D. B. M., DALBELO, L. F. A., MONICO, J.F. G., SHIMABUKURO, M.
H. First Brazilian Real Time Network DGPS through the Internet:
Development, Application and Availability Analyses. Journal of Geodetic
Science,2(1), pp 1-7, 2011.
BROWN, N., KEENAN, R., RICHTER, B., TROYER, L. Advances in ambiguity
resolution for RTK applications using the new RTCM V3.0 Master-Auxiliary messages. In: Proc of ION GNSS 2005, Long Beach, California, September
13-16, 2005.
BUTUN, O.F., BAYBURA, T. Tusaga Aktif (Cors-TR) Istayonlarınıdan Elde edilen Nokta Koordinat Dogrulugunun Incelenmesi, 5. Ulusal Muhendislik
Olcmeleri Semposyumu, 20-22 Ekim 2010, Zonguldak, Turkiye, 2010
ÖCALAN, T., TUNALIOĞLU, N. Data communication for real-time positioning and navigation in global navigation satellite systems (GNSS)/continuously operating reference stations (CORS) Networks. Sci. Res. Essays,Vol. 5(18), pp. 2630-2639 , 2010
Investigation of accurate method in 3-D position using CORS-NET in Istanbul.
Bol. Ciênc. Geod., sec. Artigos, Curitiba, v. 18, no 2, p.171-184, abr-jun, 2012.
1 8 4
KAHVECI, M. Kinematik GNNS ve RTK Cors Ağları, Zerpa Publisher, Ankara, 2009.
LAPUCHA, D., MAYNARD, K. L. Investigation of the Real-Time Accuracy of the DGPS Method. U.S. Army Corps of Engineers Topographic Engineering Center, Surveying and Mapping Research and Development Program
Technical report, TEC-0024, John E. Chance and Associates, Inc. November,
1992.
SEEBER, G. Setallite Geodesy, Foundations, Methods and Applications, second edition , de Gruyer, 2003.
WANNINGER, L. Virtual reference stations (VRS). GPS Solutions 7:143–144, 2003.
SUNANTYO ,T. Aris GNSS CORS Infrastructure and Standard in Indonesia. 7th
FIG Regional Conference, Spatial Data Serving People: Land Governance and the Environment – Building the Capacity, Hanoi, Vietnam, 19-22 October,
2009.
WÜBBENA, G., BAGGE, A. GNSS multi-station adjustment for permanent deformation analysis networks, Symp. on Geodesy for Geotechnical &
Structural Engineering of the IAG Special Commission 4, Eisenstadt, Austria,
20-22 April, 139-144, 1998.
GORDINI, C., KEALY, A. N., GRGICH, P. M., HALE, M. J. Testing and
Evaluation of a GPS CORS Network for Real Time Centimetric Positioning –
The Victoria GPSnet™, IGNSS Symp. Holiday Inn Surfers Paradise, Australia,
17 – 21 July, 2006.