Numerical Simulation of the
Infrared Spectra of Thin Organic Films
A. C.Tenorio and C. P. deMelo
Departamento de Fisica Universidade Federal de Pernambuco
50.670-901 Recife PE Brazil
Received 08 September, 1998
We present results of numerical simulations of the infrared spectra of thin lms of behenic acid (b.a.) in dierent spectroscopic congurations. A model of independent oscillators was
used to derive the optical constants of the material in the infrared region and, from these, the reectance expressions corresponding to several experimental situations. In this manner, the theoretical attenuated total reection spectra could be tted to the experimental result through a steepest-descent routine, and the spectroscopic parameters so optimized were used in the numerical computation of the behavior of the optical constants and of the dierent spectra of interest. We present results for both Langmuir-Blodgett thin lms and thicker evaporated samples ofb.a. deposited on ZnSe crystals. In the former case, we also
analyze the best suited experimental conguration for the thickness estimate of the lms. We have shown that the preliminary use of numerical simulation techniques can simplify the investigation of the spectroscopic properties of thin organic lms by allowing the operating limits and capabilities of each experiment to be estimated. Since fatty acids multilayers are the prototypal organized molecular structures, we expect that these techniques become specially important in the spectroscopic investigation of molecular order in thin organic lms.
I Introduction
Fatty acids can be considered as the prototypical am-phiphilic molecules, i.e. those which exhibit (usually at opposite sides) the simultaneous presence of polar and apolar groups[1]. When a fatty acid is dispersed in
aqueous medium the competition among entropic and energetic contributions to the interaction between sol-vent and solute molecules can lead to the spontaneous formation of complex structures such as micelles, vesi-cles and bilayers[2]. In special, if a diluted solution of a
fatty acid is carefully spread at the air-water interface, a stable oating monolayer can be formed; under ap-propriate lateral compression this monolayer becomes increasingly rigid and organized and can eventually be transferred to a solid substrate. This constitutes the basis of the so-called Langmuir-Blodgett (LB) tech-nique, introduced in the rst half of this century[1].
In the last two decades this old technique has expe-rienced a revival, as organized lms of polymers and biological molecules have become materials of crescent
interest in the elds of Biology, Chemistry, Physics and Electronics[3]
;
[4].
On the other hand, in the last few years self-assembly (SA) techniques have been developed as a competitive method for obtaining the controlled molec-ular deposition of organic polymers[4]
;
[5]. A
self-assembled lm can be prepared by successive immer-sions of an adequately treated substrate in alternate recipients containing solutions of appropriate poly-ions. While dierent examples of complex SA lms of con-jugated polymers have, for instance, found applica-tion as active layers in light-emitting devices[6] and gas
sensors[7], it is still an open question the comparison of
the degree of order of these structures relative to those of equivalent LB lms.
lm of a conjugated polymer one could hope to maxi-mize the macroscopic electronic and optical response of the sample. Also, as phospholipid bilayers can be used to mimic biological membranes, the details of possi-ble interactions of dierent drugs with these structures could be better investigated if organized mixed LB lms of these compounds are produced[8].
At the same time, as an independent development, in the last decade a rapid progress in dierent varia-tions of infrared (IR) spectroscopic techniques have es-tablished that a careful analysis of the IR spectrum of a compound can not only allow the identication of the individual chemical groups present in the molecule but, also, makes possible to determine their relative spatial orientation[9]. As a consequence, in our lab we have
initiated a program of using Fourier Transform Infrared (FTIR) techniques[10] to investigate the molecular
or-der in thin organic lms[11] ;
[12]. To the advantages of
low cost and simplicity, FTIR experiments combine the exquisite sensitiveness required to assess the relative orientation of characteristic molecular groups present in these organized thin lms.
In recent years, numerical simulation techniques have appeared as a convenient tool of investigating the limits of applicability of dierent spectroscopic experi-ments. Based on the optical theory, these methods rely on numerical procedures to adjust the reectance and absorbance expressions of a sample in a given experi-mental conguration to the corresponding experimen-tal spectra[13]. From this, the optical constants of the
material are determined and its spectra in other exper-imental geometries can be theoretically generated.
In this paper we show that the search for the FTIR geometry best suited to the investigation of the spec-troscopic properties of thin organic lms can be sim-plied by the preliminary use of numerical simulation techniques to estimate the operating limits and capa-bilities of each experiment. After a rst IR spectrum of a given lm is obtained using one of the available FTIR congurations, simple physical models for the infrared active molecular vibrations can be adopted to theoret-ically reproduce this spectrum by a best-tting proce-dure. With this, the appropriate set of spectroscopic parameters describing the characteristic peak structure is determined and one can directly calculate how the index of refraction and the absorption coecient of the sample vary in the corresponding range of frequencies. Also, use of the Fresnel equations[14] for the dierent
geometries of each IR experiment provide a simple way
to generate the corresponding IR spectrum as a func-tion of the sample thickness. In this manner one can preview the results of dierent FTIR experiments even before they are actually performed.
We begin by reviewing the basic operating princi-ples of each FTIR experiments to be used, and com-ment about the Fresnel equations obeyed in each case. Then, after a brief review of the steepest-descent min-imization algorithm, we provide examples of how the numerical simulation of FTIR spectra can be used to plan the best sequence of experiments of characteriza-tion of thin organic lms.
II FTIR Experiments
FTIR techniques are convenient tools for the charac-terization of organic compounds, since they could be easily adapted to the investigation of gaseous, liquid and solid samples[10]. Also, dierent FTIR geometries
can be used in the surface analysis of lms: for in-stance, in the case of internal reection studies (see be-low) of thin lms deposited on an appropriate substrate, the presence of an evanescent eld propagating along the interface between the two media oers an unique way of collecting data of even a single monolayer of the material[15].
The standard geometry for an IR spectroscopic in-vestigation corresponds to the transmission mode, in which the infrared radiation reaches the detector after crossing the sample at a normal angle. Because of this, transmission experiments have limited use in the inves-tigation of LB or SA lms, since for this conguration the plane where the electric eld intensity is maximum is usually perpendicular to the direction of the princi-pal axis of symmetry in these organized structures. For this reason, in the following discussion we will consider only the cases of external reection[16] and internal
re-ection experiments[15]. In all cases we will assume
that the sample has an index of refraction n2 and an
absorption coecient k2.
2.1 External reection mode (
erm)
reach the detector. This fact makes the erm the prefer-ential choice for the analysis of high absorptive samples, systems for which a successful transmission experiment would require the use of extremely thin specimens.
Figure 1. Optical arrangement for the spectroscopy in the external reection mode. (A metallic coverage is usually ap-plied to the substrate to improve theSNRin grazing angle
experiments.)
The reectance spectrum, which will be determined by the incidence angle and the optical constants n2
and k2of the material, will carry information about the
absorption peaks of the sample. Although the interpre-tation of the corresponding spectra is more complicated than those of transmission experiments, as we will dis-cuss later - see Section III - optical theory can be used to resolve the specic details[17].
The reectance R, the physical quantity measured at the detector, can be calculated from the Fresnel equations[14], which express the boundary conditions
obeyed by the Maxwell equations at the interface be-tween the two media with indices of refraction n1 and
n2 (in the present case, air and the material sample,
respectively). These boundary conditions are dierent for the components of the electric eld along the direc-tions parallel (P) and perpendicular (S) to the plane
of incidence[18]. As a consequence, the corresponding
reectance expressions Rk=
n2 2cos ,n 1 q n2 2 ,n 2 1sin 2 n2
2cos + n 1 q n2 2 ,n 2 1sin 2 2 (1) and
R?=
n1cos , q n2 2 ,n 2 1sin 2
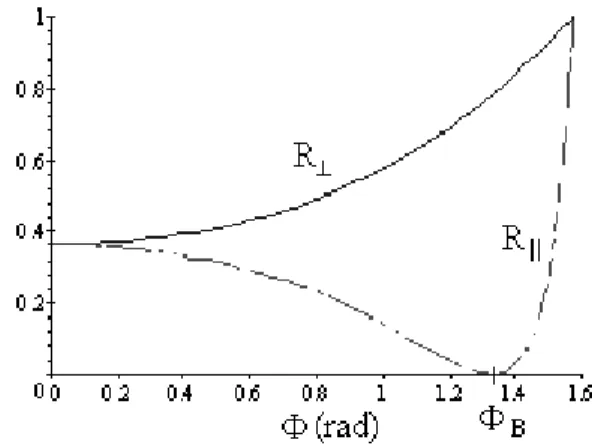
n1cos + q n2 2 ,n 2 1sin 2 2 (2) exhibit characteristic and distinct dependences with (see Fig. 2). As it can be seen from Fig. 2, there is a specic incidence angle in which the reected wave is naturally polarized; this is the Brewster angle, B= arctan(n2=n1). Also note that at large values of
, the total reectance approaches its maximum value. This latter conguration corresponds to thegrazing an-gle (ga) spectroscopy[19], a convenient tool for the
in-vestigation of highly absorbing samples.
Figure 2. Parallel and perpendicular reectances in the ex-ternal reection mode for the casen
1= 4
:03 andn 2= 1
:0.
Note the existence of the Brewster angle B= 1
:3276r ad
76o for the parallel polarization.
For the case of thin samples, the presence of a
reective element with optical constants n3 and k3
-besides oering the necessary physical support for a usually fragile specimen - can be used to expand the range of applications of the erm. For instance, in situ experiments can be performed to collect the re-ectance spectrum of a oating monolayer in an air-water interface[20]. On the other hand, if a
metal-lic surface is used as the supporting substrate of the thin lm the technique is sometimes called reectance-absorbance (ra); in this case, the metal, characterized by a plasma frequency[21]
$p =
Nq2
"(! !1)m
1=2
(3) (where "(!!1) is the high frequency dielectric
con-stant, q and m are respectively the charge and mass of the electron, and N is the electron density per volume), acts as an eective mirror for the IR radiation. Since a higherSNR can then be obtained
[22], this becomes
a convenient scheme for the investigation of chemical reactions occurring at the interface.
situation makes the ga technique very adequate to the investigation of structural anisotropies in thin lms; we have applied the method to the study of the relative orientation of dierent molecular groups in LB lms of conducting polymers[23] and of retinal molecules[11].
2.2 Internal reection mode (
irm)
Attenuated total reection (ATR) is the standard conguration (see Fig. 3) of the irm, when a sam-ple of index of refraction n2 is deposited on the
sur-face of an infrared element (ire) of index of refraction n1 > n2. Since the IR radiation propagates along the
more dense medium before reaching the interface, there exists a critical angle value
c= arcsin n 2
n1
; (4)
for which total reection occurs and an evanescent wave is propagated along the interface. If the sample has an absorption coecient k2, for incidence angles
c
the total reection is attenuated due to the interac-tion of the evanescent wave with the material: when, after multiple reections at the interface, the radia-tion is nally collected by the detector it carries in-formation about the normal vibrational modes of the sample. Since the reected wave propagates along the more dense medium, the reectance expressions (Eqs. (1)-(2)) remain valid, but now, due to the fact that n1> n2, they correspond to complex quantities
[15] ;
[18].
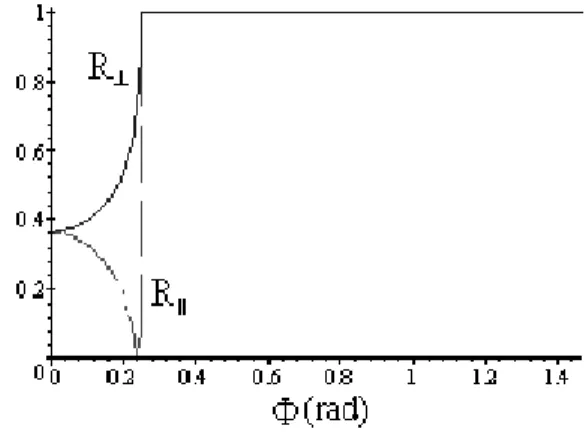
In Fig. 4, we show how the parallel and perpendicular reectances vary with changing incidence angles .
The penetration length[24]
dp=
c !,
sin2 ,n
2
21
1=2; (5)
(where ! is the angular frequency of the radiation and n21= n2=n1), measures the distance transversed by the
evanescent wave into the sample before its intensity de-cays to 1=e of its value at the interface. Two dierent limits can then be identied for theATRspectroscopy:
(i)thin lms, for which the thickness dd
p, and (ii)
thick lms, when d d
p. In the case of thin lms,
reection of the wave at a second interface between the sample and a third medium of index of refraction n3
must be considered[18]. Due to the interference
be-tween the two contra-propagating waves in the interior of the sample, the corresponding value of the reectance R exhibits an oscillatory behavior as a function of the thickness d.
Figure 3. Optical arrangement for the spectroscopy in the internal reection mode.
Figure 4. Parallel and perpendicular reectances in the in-ternal reection mode for the casen
1= 1
:0 andn 2 = 4
:03.
Note that total reection occurs at angles greater than the critical value of 0:251r ad14:4
o.
The ire must be transparent to the IR radiation; also, a good contact between the sample and theireat the interface is an essential requisite for the technique. We have adopted theATRconguration for the investi-gation of the molecular order of LB lms of conducting polymers directly deposited on a ZnSe crystal[12].
In the following section we will review how the molecular vibrations can be described by a simple model of independent damped harmonic oscillators.
III Modellingthe Molecular
Vi-brations
In the study of the infrared spectrum of a molecular system, as a convenient rst approximation the molec-ular vibrations can be considered as a collection of in-dependent harmonic oscillators, the normal modes[25].
When an external electromagnetic eld ~E is applied upon the molecule, each one of these oscillators of mass m, charge q and frequency !nbecomes polarized. If an
intrinsic damping factor nproportional to the velocity
is assumed, the solution ~rn(!) =
,
q=m !2
n ,!
2
,i! n
of the corresponding equation of motion permits the
calculation of the polarizability (i.e. the total dipole moment per volume unit) of the medium as
c
~P(!) = NX n
fnq~rn(!) = ~E X
n
Nfnq 2=m
!2 n
,! 2
,i! n
; (7)
where N is the electron density per volume unit and fn is the oscillator strength of the vibration transition of
resonance frequency !n.
After introducing the radiation wavenumber = !=(2c) and considering the relationship between the dielectric constant " and the complex index of refraction ^n = n + ik, one can write[13]
;
[17]
(^n)2
= 1 +
N0
"0 + Nq 2
42c2" 0m
X
n
fn
2 n
, 2
,i n
1,
N0
3"0
+ Nq2
42c23" 0m
X
n
fn
2 n
, 2
,i n
; (8)
d
where the term N0="0, resulting from the electronic
contribution 0 to the polarizability, was in an ad-hoc
manner added to the numerator. Because of its physical origin, this term is independent of the IR frequency.
We must call attention to the fact that for a incom-ing radiation of wavenumber , the index of refraction depends on the electronic polarizability 0 of the
ma-terial and is a function of the set ff n;n
g of simple
vibrational parameters. Numerical minimization algo-rithms can then be used to extract these parameters by a procedure of best-tting this function to known ex-perimental values of the intensity at each characteristic absorption frequency n. In the next section we will
consider how this can be achieved.
IV Numerical Simulation of the
IR Spectra of Thin Organic
Films
In a given reection experiment the reectance R can be related to the optical constants n and k of the sam-ple and of the ire, and one can use the corresponding
spectrum with characteristic wavenumbers nto
deter-mine the values of the set of parametersff n;n
g. Once
this set of parameters associated to the relevant
fea-tures of the IR spectrum of the material is identied, the behavior of the optical constants n and k can be determined. Since the optical constants are indepen-dent of the experimental method used, the reectance R for any other experiment can be theoretically predicted with basis in the expressions derived from the Fresnel equations for that specic conguration[13]. Before
pre-senting a few examples of the use of this scheme to in-vestigate the spectroscopic properties of thin organic lms, we will rst briey review a simple numerical procedure for best-tting a theoretical expression to a given set of experimental data points.
4.1 The steepest-descent minimization
proce-dure
A best-tting procedure has the goal of nding the values of a set of M parameters k which best adjust a
generic function y = f(x;) to N > M known values yi: After an initial guess for the k parameters is
intro-duced, the error di= yi
,f(x;) can be determined for
each of the data points. One can minimize the function D = N
P
i=1
d2
i by searching in the parameter space the
di-rection k =
,@D=@
k of more rapid change; for this,
c
n+1 k =
n
k+ 2
X
i
(yi
,f(x;))
@fi
@k
= n
; (9)
d
where is a scaling parameter, can be followed until the desired convergence condition
N
X
i=1
D i+1(
k) ,D
i( k)
< (10)
is satised. Compared to other minimization schemes, this so-called steepest-descent method[26] of nonlinear
tting has an inherent greater simplicity and demands a shorter computational time.
In all examples discussed below the steepest-descent algorithm was used to determine the values of the
ff n;n
gparameters which best t the theoretical
ex-pressions of the reectance (see Section II) to a given experimental spectrum. Once identied, this set of best parameters was adopted to allow the numerical simu-lation the spectra of other yet to be performed experi-ments.
4.2 Applications
4.2.1 Isotropic lms of behenic acid
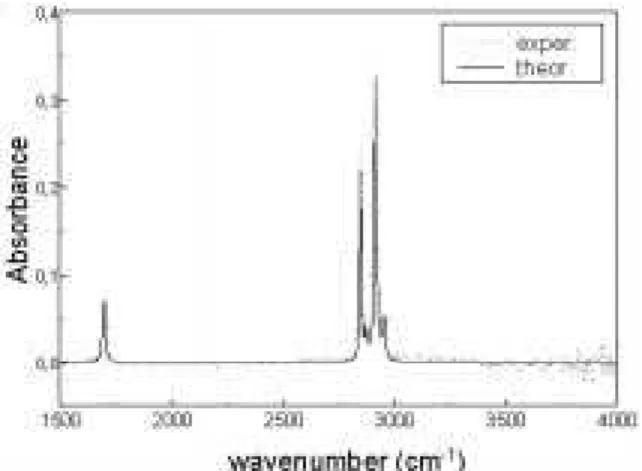
As a rst application, we have used the steepest-descent method to generate a numerical tting to the experimental ATR spectrum (see Fig. 5) of a isotropic (i.e., with no built in structural anisotropy) lm of be-henic acid (b.a.). (The spectra shown in Fig. 5 cor-responds to the absorbance - which is dened as the negative logarithm of the reectance[27].)
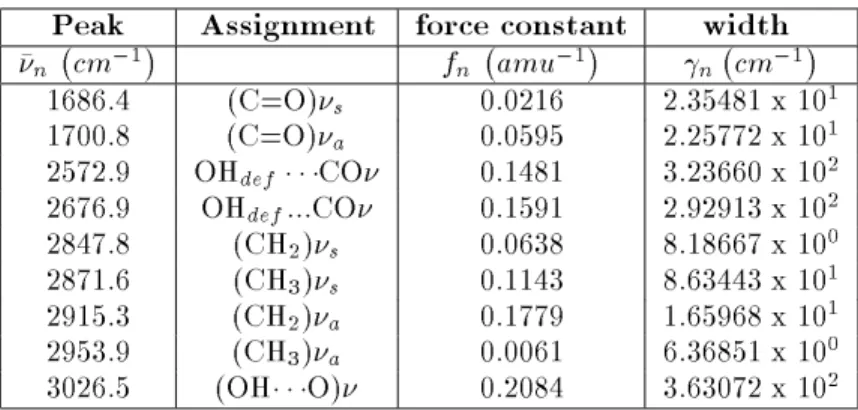
In this manner, the best set of values of (the full width at half height) and f (the oscillator strength) for each characteristic feature identied at wavenumber n
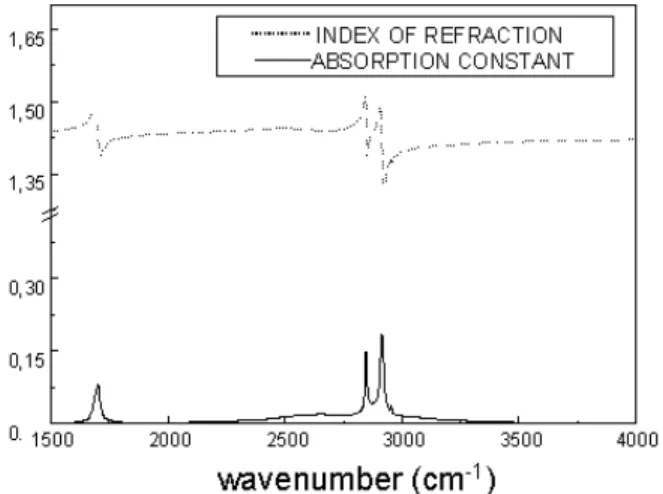
in the ATR spectrum (see Table 1) was determined, and then, using Eq. (8) we could predict the behavior of the optical constants n() and k() of the material in the infrared region (see Fig. 6). As discussed in the previous section, once the functions n() and k() of a given material are known, one can theoretically simulate the corresponding spectrum in any desired ex-perimental conguration.
Peak
Assignment force constant
width
n ,
cm,1
fn ,
amu,1
n ,
cm,1
1686.4 (C=O)s 0.0216 2.35481 x 10
1
1700.8 (C=O)a 0.0595 2.25772 x 10
1
2572.9 OHdef
CO 0.1481 3.23660 x 10
2
2676.9 OHdef...CO 0.1591 2.92913 x 10 2
2847.8 (CH2)s 0.0638 8.18667 x 10
0
2871.6 (CH3)s 0.1143 8.63443 x 10
1
2915.3 (CH2)a 0.1779 1.65968 x 10
1
2953.9 (CH3)a 0.0061 6.36851 x 10
0
3026.5 (OHO) 0.2084 3.63072 x 10
2
Figure 5. Comparison between the experimental (dotted line) and best-tted (continuous line) 45oATR spectra of a
thick lm of behenic acid deposited on top of a ZnSe crystal.
Figure 6. Predicted behavior in the IR region for the index of refractionn() and absorption coecientk() of a thick
lm of behenic acid.
Experimental:
All infrared spectra were collected with a 4cm,1resolution using a MB-100 FTIRspec-trometer (Bomem, Canada) equipped with a deuter-ated triglycine sulfate (DTGS) detector. For the ATR experiments we have used a ZnSe (n1 = 2:42)
crys-tal (Harrick Scientic, USA) with 45ofaces mounted in
an appropriate accessory (Specac, UK), and 256 scans were collected to produce each spectrum.
The isotropic lm was prepared by dripping a so-lution of b.a. (d = 0:8221g=cm
3, index of refraction
n = 1:43 and molecular weight equal to 340:57Da, ob-tained from Sigma, USA) in a volatile solvent (chlo-roform) on top of the ZnSe crystal, until no further increase in the intensity could be observed in the ATR spectrum. (This would assure that the lm thickness is larger than the penetration length of the radiation.)
As indicated in Table 1, the peaks were assigned[28]
respectively to the i) symmetric (
s) and asymmetric
(a) C = O stretchings (1686:4cm
,1 and 1700:8cm,1), ii) symmetric (
s) and asymmetric (a) CH2
stretch-ings (2847:8cm,1and 2915:3cm,1),
iii)symmetric ( s)
and asymmetric (a) CH3 stretchings (2871:6cm ,1
and 2953:9cm,1),
iv) coupling of the OH
defor-mation mode to the symmetric (s) and asymmetric
(a) CH3 stretchings (2572:9cm
,1 and 2676:9cm,1),
and, nally,v)the OHH hydrogen bond stretching
(3026:5cm,1).
Numerical tting of the ATR spectrum:
With basis on the above data, the number of particles per volume unit of the fatty acid was calculated (N = 1:451021cm,3) and the electronic contribution to the
polarizability estimated as 0 = 6:13 10
,2cm3. For
the spectral simulation of a thin lm deposited on a steel plate, we adopted the values[29] d = 7:86g=cm3
and an atomic weight of 55:85Da (Fe) to describe the substrate - with a consequent estimated plasma fre-quency $p= 1:43
10 21s,1.
Since the incoming radiation was assumed not to be polarized, we have considered an average between the perpendicular and parallel reectance expressions (Eqs. (1)-(2)). The tting of the experimental ATR spectrum in the (1500,4000)cm
,1interval was
implementedusing the steepestdescent algorithm. At convergence -which was achieved with a nal residue 10
,2- the
optimized parameters f and were those shown in Ta-ble 1.
Theoretically predicted spectra:
The values of n() and k() were obtained (Fig. 6) directly from Eq. (8), and then it becomes a simple matter to simu-late the theoretical spectra of the material in dierent physical situations. Let's consider rst how the varia-tion of the incidence angle aects the ATR spectra of the isotropic b.a. lm. As it can be seen in Fig. 7,the larger
SNR
is obtained for an incidence angle close to the critical value of 35o. While for a lower value( = 10o) we obtain a typical external reection
spec-trum with low
SNR
[30], for = 60o there is strongFigure 7. Numerically simulated ATR spectra of a thick lm of behenic acid deposited on a ZnSe crystal, for dier-ent incidence angles .
Figure 8. Numerically simulated external reection spectra of a thick lm of behenic acid deposited on a ZnSe crystal, for dierent incidence angles . At values of
B = 55 o
theP-component of the radiation is strongly absorbed (see
Fig. 2).
As we have discussed in Section IIA, in an external reection experiment the absorbance of theP-polarized
(i.e., along the direction parallel to the incidence plane) radiation should go through a maximum at the Brew-ster angle. In Fig. 8 we observe that in fact the sim-ulated erm spectra exhibit this peculiar behavior at = 55o.
Let's now consider the case of a very thin (d A)
but still isotropic lm of b.a. deposited on a metal-lic substrate. As depicted in Fig. 9, for increasing values of there is a noticeable reduction in the in-tensities of the absorption bands, in agreement to the expected behavior at the grazing angle limit (see Sec-tion IIA). Although we do not show the correspond-ing result here, the simulation also reveals that for a thin lm on a metallic substrate there is no absorp-tion of the S-component of the radiation. This is in
agreement with the well-known observation that while
the ga conguration is specially adequate to the inves-tigation of structural anisotropies[11]
;
[23] ;
[31], the use
of P-polarized radiation contributes to a much better SNR.
Figure 9. Numerically simulated external reection spectra of a thin (dA) lm of behenic acid deposited on a metallic
substrate, for dierent incidence angles .
Figure 10. Numerically simulated external reection spectra of a thin (dA) lm of behenic acid deposited on a ZnSe
substrate, for dierent incidence angles of a non-polarized IR radiation.
Finally, we will consider the case of a external reec-tion experiment for a thin lm ofb.a. on top of a ZnSe crystal. Once again one can observe that a progressive reduction in the intensities of the absorption bands is predicted with the increase of the incidence angle (see Fig. 10). The dierent reective properties of a thin lm for theS- andP-components of the incident
radia-tion are evident in Fig. 11, where we represent the erm = 10o simulated spectra for the individual
polariza-tions: while theP-spectrum exhibits both positive and
negative absorption bands, only negative bands can be observed in the S-spectrum. (Again, one should
Figure 11. Numerically simulated external reection spectra of a thin (dA) lm of behenic acid deposited on a ZnSe
substrate, for an incidence angle = 10oof
S-(dashed line)
andP-(continuous line) polarized IR radiation. Please note
that the absorption intensities for the P- component are
much larger than those of theS- radiation, and that
there-fore the P-polarization must dominate the corresponding
= 10o spectrum in Fig. 10.
Figure 12. Comparison between the experimental (dotted line) and best-tted (continuous line) S- polarized ATR
spectra, at an incidence angle of 45o, of a LB lm of
be-henic acid deposited on top of a ZnSe crystal.
4.2.2. LB lms of behenic acid
The spectral simulation procedure will now be used to establish how the IR spectroscopic properties of a thin isotropic LB lm of a fatty acid will depend on the sample thickness d.
Experimental:
Behenic acid was used as received (Sigma, USA) to prepare LB lms by the careful spreading of 100L of a chloroform solution the fatty acid on an air-water interface in a LB-5000 Langmuir trough (KSV, Finland). Ultra-pure (resistivity greater than 16M=cm) water obtained after passage through a Nanopure system (Barnstead, USA) was used as sub-phase. The compression of the oating monolayer was achieved with a 10mm=min moving nylon bar-rier, until a surface pressure of 35mN=m was reached. Then, using backward and forward barrier speeds of 2:0mm=min, the transfers were performed at 25oCal-ways in the upstroke movement (dipping speed equal to 4:0mm=min) of a ZnSe substrate, resulting in X-type LB lms[2].
A homemade accessory was used to hold the ZnSe crystal for the ATR study, and the same spectroscopic conditions as described above were used to collect the spectral data. In Table 2, we list the principal features identied in the ATR spectrum of the thin lm, where assignments in common to those of Table 1 were as pre-viously discussed.
Peak
Assignment force constant
width
n ,
cm,1
fn ,
amu,1
n ,
cm,1
1686.4 (C=O)s 0.0012 1.0448 x 10
1
1700.8 (C=O)a 0.0060 1.2530 x 10
1
2847.8 (CH2)s 0.0200 8.0031 x 10
0
2871.6 (CH3)s 0.0048 1.2782 x 10
1
2915.3 (CH2)a 0.0471 1.2203 x 10
1
2953.9 (CH3)a 0.0086 1.4926 x 10
1
Numerical tting of the ATR spectrum:
The number of particles per volume unit of the b.a., N,and the electronic contribution to the polarizability, 0,
were the same as before. In the simulation of the graz-ing angle spectra, the parameters correspondgraz-ing to a steel plate[29] were once again adopted for the
descrip-tion of the metallic reective element. In Table 2 we also show the parameters f and which best t the ex-perimental ATR spectrum in the (1500,4000)cm
,1
after the steepest-descent algorithm was used. Once again a nal residue 10
,2 was found at the
con-vergence limit of the numerical procedure. The quality of the tting can be appreciated in Fig. 12, where the experimental and adjusted spectra are compared.
Theoretically predicted spectra:
With the opti-mized set of parameters f and we have used Eq. (8) to generate the n() and k() functions (Fig. 13), a nec-essary step for the numerical simulation of the dierent desired spectra. Let's examine rst how the thickness of the lm inuences its ATR spectrum. In Fig. 14 we show the corresponding = 45o spectra for dierentvalues of the thickness d. As it can be observed, at this value of the incidence angle the intensities of the char-acteristic absorbance peaks change only moderately as a function of d; this fact then precludes the use of the ATR spectroscopy as a reliable technique to determine the thickness of LB lms of organic compounds. This result can be understood if we remember the same char-acteristics which make the ATR spectroscopy a good technique to probe interfaces reduce its sensitiveness to bulk properties.
Figure 13. Predicted behavior for the index of refraction
n() and the absorption coecientk() of a LB lm of be-henic acid deposited on top of a ZnSe crystal.
A more interesting point comes out when we adopt a conguration such that the incidence angle is lower than the critical value (c = 36
o for
b.a. on ZnSe).
In Fig. 15 we present the predicted = 30ospectra in
the limitingcases of very thin and very thick lms. One can observe that while for the thick sample the spec-trum is similar to an external reection (since < c),
for the very thin lm the same ATR prole as before is found. This is a consequence of the fact that for very thin samples the critical angle becomes determined by the ratio between the indices of refractions of the third medium (air) and of theire(and, therefore, in this case
it is equal to 24:4o).
Figure 14. Numerically simulated ATR spectra of a LB lm of behenic acid deposited on a ZnSe crystal, for dierent values of the thicknessd.
Figure 15. Numerically simulated = 30o irm spectra of
a LB lm of behenic acid deposited on a ZnSe crystal, for the limiting cases d= 1:0 x 10,8cm (continuous line) and
d= 1:0 x 102cm(dashed line).
As a nal example, we consider the inuence of the thickness d upon the absorption intensities in the graz-ing angle spectra of LB lms. The numerical results indicate that while at the two extreme limits of very thin or very thick lms the intensities of the charac-teristic absorption peaks at 2916cm,1 ((CH
2)a) and
1700cm,1 ((C=O)
a) do not change in a noticeable
10,5cm
.d.10
2cm range the slopes of the absorption
intensity curves are such as (see Fig. 16) to suggest that thegaconguration could be adequate for the
determi-nation of the thickness of LB lms. However, the pres-ence of interferpres-ence fringes associated to the multiple internal reections at the two interfaces of the lm limit this range of applicability to the 10,5cm
.d.10 ,2cm
region. Note that for the system considered, the best
SNR is predicted to occur for values of d 10m,
a thickness characteristic of spin coated or evaporated lms.
Figure 16. Predicted variation of the absorption intensi-ties of the 2916cm,1 and 1700cm,1 peaks of a
b.a. lm
deposited on top of a metal surface, obtained from the nu-merically simulated grazing angle spectrum.
V Conclusion
In this paper we have examined how the numerical sim-ulations of the infrared spectra of organic lms can be used to investigate the characteristics of dierent spec-troscopic experimentspriorto their actual realization.
With this, the range of applicability and eventual lim-itations of each experimental IR conguration can be thoroughly investigated in a purely theoretical and sim-ple and economical manner. As a consequence, for a given problem under consideration one can then select to perform only the most promising and adequate ex-periments.
We began by showing how the optical constants of the material could be obtained from a simple model of independent harmonic oscillators for its normal modes. At the same time, from the Fresnel equations - which re-sult directly from the application of the boundary con-ditions obeyed by the electromagnetic radiation at the interfaces of the sample - the reectance spectra cor-responding to dierent experimental congurations of
interest were derived in terms of the optical constants of the sample and of any other media probed by the radia-tion. Then, after a given experimental spectrum (for in-stance, ATR at a given incidence angle ) was selected, we have used a straightforward numerical minimization routine to best-t the corresponding theoretical expres-sion, obtaining in this way the correct estimate for the behavior of the index of refraction n() and absorption constant k() of the material. Once these functions were known, the spectrum of any other experimental conguration could be numerically simulated.
As examples of the applicability of the technique, we have presented results for two systems of interest: i)
relatively thicker evaporated (and therefore isotropic) and ii) thin Langmuir-Blodgett prepared (and hence
intrinsically organized) lms of behenic acid. In each case, the ATR spectra of b.a. lms deposited in ZnSe
crystals were used to optimize the force constant and width parameters of the relevant absorption features of the material; then, the functions n() and k() were obtained, from which the corresponding spectra for sev-eral dierent possible IR congurations were predicted. For the case of LB lms of behenic acid, in special, an analysis of the possible use of IR spectroscopic tech-niques as a convenient tool for the determination of the thickness of the samples was presented.
Since LB lms of fatty acids are prototypal of or-ganized thin organic lms, it is expected that studies similar to that presented here could nd general appli-cation in the selection of the best suited IR geometry to investigate the spectroscopic properties of many simi-lar systems, such as self-assembled multilayers or con-jugated polymer samples in general. For instance, we should point out that recently reectance studies have become an invaluable complementary tool for the char-acterization of the transport properties of conducting polymers[32].
organic lms, which are nowadays nding applications in dierent branches of scientic investigations.
Acknowledgments
We acknowledge the nancial support of the Brazil-ian agencies FINEP, CNPq and FACEPE.
References
[1] G. L. Gaines, Insoluble Monolayers at Liquid Gas In-terface(Wiley, New York, 1990).
[2] M. C. Petty, Langmuir-Blodgett Films: An Introduc-tion(Cambridge University Press, Cambridge, 1996). [3] G. Roberts, Langmuir-Blodgett Films (Plenum Press,
New York, 1990).
[4] R. H. Tredgold, Order in Thin Organic Films (Cam-bridge University Press, Cam(Cam-bridge, 1994).
[5] G. Decher, J. D. Hong and J. Schmitt, Thin Solid Films
210-211, 831 (1992).
[6] M. Ferreira, O. Onitsuka, A. C. Fou, M. F. Rubner and B. Hsieh, J. Appl. Phys.79,7501 (1996).
[7] C. P. de Melo, C. G. dos Santos, F. L. dos Santos, M. V. dos Santos and J. E. G. de Souza, work in progress. [8] See, for example, J. Majewski, T. L. Kuhl, M. C. Ger-stenberg, J. N. Israelachvili and G. S. Smith, J. Phys. Chem. B101, 3122 (1997), and references therein.
[9] D. J. Ahn and E. I. Frances, J. Phys. Chem.96,9952
(1992).
[10] N. B. Colthup, Introduction to Infrared and Raman Spectroscopy, (Academic Press, New York, 1975). [11] C. P. de Melo and M. I. Mosquera-Sanchez, Langmuir
14,490 (1998).
[12] A.C. Tenorio and C.P. de Melo, Proceedings of the In-ternational Conference on Science and Technology of Synthetic Metals (ICSM'98), July 1998, Montpellier, Franca.
[13] M. Milosevic and S., L. Berets, Appl. Spectroscopy47,
566 (1993).
[14] J. D. Jackson, Classical Electrodynamics(Wiley, New York, 1962).
[15] F. M. Mirabella, Jr., Appl. Spectrosc.21, 45 (1985).
[16] T. Hasegawa, J. Umemura and T. Takenaka, J. Phys. Chem.97, 9009 (1993).
[17] A. C. Tenorio, Determinac~ao da Orientac~ao Molecu-lar em Filmes Org^anicos Finos por Espectroscopia na Regi~ao do Infravermelho, MSc thesis presented to the Departamento de Fisica, Universidade Federal de Per-nambuco, Recife, Brazil, December 1997.
[18] J. R. Reitz, F. J. Milford and R. W. Christy, Founda-tions of Electromagnetic Theory(Addison-Wesley, Lon-don, 1979).
[19] J. F. Rabolt, M. Jurich and J. D. Swalen, Applied Spec-trosc.39, 269 (1984).
[20] R. A. Dluhy, N. A. Wright and P. R. Griths, Applied Spectrosc.42, 138 (1988).
[21] C. Kittel,Introductionto Solid State Physics(John Wi-ley, New York, 1996).
[22] S. A. Francis and A. H. Ellington, J. Opt. Soc. Am.
49, 31 (1959).
[23] C.G. dos Santos, C.P. de Melo and R. Souto Maior, Synthetic Met.71, 2083 (1995).
[24] N. J. Harrick,Internal Reection Spectroscopy(Harrick Scientic, New York, 1987).
[25] E. B. Wilson, Jr., J. C. Decius and P. C. Cross, Molec-ular Vibrations(McGraw-Hill, New York, 1955). [26] P. K. MacKeown and D. J. Newman, Computational
Techniques in Physics(McGraw-Hill, New York, 1971). [27] D. C. Harris and M. D. Bertolucci,Symmetry and
Spec-troscopy(Dover, New York, 1989).
[28] C. J. Pouchert, The Aldrich Library of FTIR Spec-tra Vol I (Aldrich Chemical Company Inc., Milwauke, 1989).
[29] The Merck Index (Merk & CO Inc., Rachway, 1989). [30] E. Hecht and A. Zajac,Optics(Addison-Wesley,
Lon-don, 1974).
[31] J. D. Swalen, J. Mol. Electron.2, 155 (1986).
[32] K. Lee, A. J. Heeger and Y. Cao, Synthetic Met.72,