Article
J. Braz. Chem. Soc., Vol. 25, No. 9, 1696-1703, 2014. Printed in Brazil - ©2014 Sociedade Brasileira de Química 0103 - 5053 $6.00+0.00
A
*e-mail: [email protected]
Quantification of Cocaine Hydrochloride in Seized Drug Samples by Infrared
Spectroscopy and PLSR
Tatiane S. Grobério,a Jorge J. Zacca,b Marcio Talhavinib and Jez W. B. Braga*,a
aInstitute of Chemistry, University of Brasília, P.O. Box 4478, 70904-970 Brasília-DF, Brazil
bNational Institute of Criminalistcs, Brazilian Federal Police, SAIS Quadra 07 Lote 23,
70610-200 Brasília-DF, Brazil
A determinação do teor de cocaína em amostras de drogas consiste em uma importante tarefa em órgãos como a Polícia Federal Brasileira (BFP). Nesse sentido, este trabalho propõe apresentar um método baseado em espectros de infravermelho obtidos por refletância total atenuada (ATR) e regressão por mínimos quadrados parciais (PLSR) para quantificar cloridrato de cocaína em amostras de drogas. O método foi desenvolvido e validado com 275 amostras reais de drogas apreendidas pela BFP em todo o Brasil. A determinação foi realizada no intervalo de 35 a 99% (m/m) de cocaína nas amostras. Os resultados indicaram que o método é capaz de analisar diretamente amostras de drogas contendo cocaína na forma de cloridrato sem necessidade de qualquer preparo de amostra com erros médios de aproximadamente 3,00%, precisão de 1,50% (m/m) e concentração mínima detectável de 13% (m/m).
The determination of cocaine in drug samples is an important task for law enforcement agencies such as the Brazilian Federal Police (BFP). In this sense, this paper proposes a method based on infrared spectra obtained by attenuated total reflectance (ATR) and partial least squares regression (PLSR) to quantify cocaine hydrochloride in drug samples. The method was developed and validated with 275 actual samples of drugs seized by the BFP. The determination was performed between 35 to 99% (m/m) of cocaine in the drug samples. Results indicate that the method is able to directly analyze drug samples containing cocaine in its hydrochloride form without any sample preparation with average prediction errors of 3.00% (m/m), 1.50% (m/m) precision and 13% (m/m) of minimum detectable concentration.
Keywords: cocaine hydrochloride, PLSR, FTIR
Introduction
According to the United Nations Office on Drugs and Crime (UNODC), cocaine is the second most problematic drug worldwide in terms of negative health consequences, and probably the most problematic one in terms of drug
trafficking-related violence.1 Furthermore, a World Drug
Report published in 2013 asserts that while the use of cocaine in several countries in South America decreased or remained stable, in Brazil it has increased substantially, which justifies the intensification of studies that can assist law enforcement agencies in the control of illicit drug
trafficking.2
In order to increase drug volumes and illegal trafficking profits, various substances are added to cocaine. Among
them there are diluting agents such as sugars and starches, as well as adulterants, which are pharmacologically active compounds capable of increasing the drug’s adverse and
side effects.1 The determination of cocaine concentration
and of its diluents and adulterants has a significant role in forensic sciences, since it provides important information on how the drug has been cut, as well as on how illegal distribution networks operate in a certain area.
Since the 1970s, the analytical methods used for the determination of cocaine in drug samples have
evolved substantially.3 Currently, gas chromatography
is the main technique applied for this analysis, since it
provides accurate and precise results.4,5 Furthermore, gas
chromatography is the recommended technique in the
UNODC’s manuals.6-8 However, despite the excellent
cost and time for analysis. In addition, sample diversity demands the method to be frequently adjusted or updated. These factors make the analysis of a large number of drug samples by gas chromatography time consuming and difficult to implement.
Multivariate analysis methods based on Fourier transform infrared (FTIR) spectroscopy have shown great potential for both qualitative and quantitative analyses. The combination of vibrational spectroscopy and chemometrics has been considered an efficient alternative method to
directly extract information from many different data.9
One of the first methods applying FTIR for cocaine
determination was proposed by Ravreby.10 In that case,
cocaine hydrochloride and heroin concentrations were determined by univariate regression choosing a carbonyl absorption peak in the infrared (IR) spectra obtained with KBr pellets. The author also studied the effect of various additives and diluents such as starch, sugars, mannitol, caffeine, and procaine. However, considering the high complexity of seized drugs and the variation of the IR spectra obtained with KBr pellets, this method presents
limitations for routine application in forensic analysis.10
Ryder et al. showed that multivariate analysis methods
combined with Raman spectroscopy can be used as a rapid analytical method for the analysis of narcotics in two component mixtures. In this study, partial least squares regression (PLSR) showed that Raman data allow the estimation of cocaine concentration in solid mixtures with glucose, which should be sufficient for screening of
samples.11 Rodrigues et al. performed an exploratory study
that characterized the chemical composition of 91 cocaine samples seized in the state of Minas Gerais between 2008 and 2010, based on attenuated total reflectance (ATR) FTIR spectra and chemometric analysis. In their study, principal component analysis (PCA) and partial least squares for discriminant analysis (PLS-DA) were developed to classify the samples according to their dilution (below and above 15% m/m) and chemical form (cocaine hydrochloride or base). Discrimination according to dilution and chemical form resulted respectively in 83% and 97% correct
results.9 In a preliminary study, Maharaj compared the
quantification of cocaine using gas chromatography
and flame ionization detection (GC-FID) with FTIR.12
Although only few samples were used for analysis, and the lack of results for figures of merit of the method, the author affirmed that the results obtained by GC-FID and ATR-FTIR are equivalent and consequently, ATR-FTIR was considered adequate for the quantitative analysis
of cocaine.12 Recently, Pérez-Alfonso et al. proposed a
method for determination of cocaine in illicit samples by diffuse reflectance measurements in the near infrared
spectroscopy (NIR) region. The results obtained by the authors showed that the cocaine content can be determined in a wide concentration range. However, the validation was performed with a relatively low number of samples if one takes into account the high heterogeneity of illicit samples
occurring in real forensic cases.13
The results described in the literature suggest that infrared spectroscopy and multivariate analysis can be a viable analytical method for cocaine analysis in drug samples. However, there is still a lack of validated methods with a significant number of seized cocaine samples in order to prove the real potential of this technique in routine forensic analysis. Therefore, the aim of the present work is to describe the development and validation of an analytical method to quantify cocaine hydrochloride in seized drug samples using ATR-FTIR and multivariate calibration. In order to develop and validate the proposed method, the quantitative determination of cocaine was performed in a significant number of drug samples seized nationwide using two independent analytical techniques, namely GC-FID and ATR-FTIR.
Experimental
Samples and sample preparation
The dataset was composed of 275 samples of cocaine hydrochloride originating from approximately 73 seizures made by the Brazilian Federal Police (BFP) in different parts of Brazil, between 2009 and 2013. All samples were sent to the Forensic Chemistry Laboratory of the National Institute of Criminalistics in Brasília. Before instrumental analysis, all samples were carefully homogenized by maceration.
Infrared spectroscopy measurements
The infrared spectra were obtained on a Nicolet iS10 FTIR spectrometer equipped with a triple reflection attenuated total reflectance SMART iTR accessory using a diamond crystal. The measurements were obtained in reflectance mode (R) with the accessory filled with a small amount of cocaine. The spectra were collected between
4000 and 400 cm−1 over 16 scans with a resolution of
4.0 cm−1.
Gas chromatography with flame ionization detection (GC-FID) analysis
an amount of 12.25 mg ± 0.25 mg of each homogenized sample and mixing thoroughly with 10.0 mL of an internal
standard solution (diethylamine, 0.002 mL L−1 and dipentyl
phthalate, 512 mg L−1 prepared in chloroform). Then, 1 mL
of this solution was transferred to glass vials, sealed, and subjected to chromatographic separation.
GC-FID analysis was performed on a gas chromatograph model 6890N (Agilent Technologies) equipped with a flame ionization detector and an autosampler 7683B Series (Agilent Technologies). The chromatographic conditions were as follows: injection volume of 0.2 mL; split ratio of 50:1; chromatographic column DB1-MS methyl siloxane (25 m × 200 µm [i.d.] × 0.33 µm film thickness); injector temperature of 280 °C, and detector temperature of 320 °C.
Helium was used as the carrier gas at a flow of 1.0 mL min−1.
The oven temperature program was as follows: 150 °C for
2 min, heat 40 °C min−1 to 350 °C, and hold at 350 °C for
4.5 min, resulting in a 12 min chromatographic run.
Multivariate model development
The multivariate calibration method was developed based on partial least squares regression (PLSR). In PLSR, the original spectral variables are decomposed into latent variables in order to establish the best correlation between the instrumental measurements (spectral data matrix X) and the values of the interest property (vector y containing the
reference values of cocaine concentration).14-16
All sample spectra were imported into MATLAB
(version 7.12, R2011a) and the preprocessing and PLSR
models were implemented using the PLS Toolbox
(version 6.5) from Eigenvector Technologies. Two independent regression models were developed. The first one was established using the data on a reflectance scale, while the second one utilized converted absorbance (Abs)
data by means of the relation Abs = log10(1/R).
To perform the calibration and validation of the models, the dataset was split respectively into 184 calibration and 91 validation samples selected by the Kennard-Stone
algorithm.17
In order to obtain the best prediction results, several pre-processing techniques were evaluated, specifically standard normal variate (SNV), orthogonal signal correction (OSC), first derivative, mean center, and their combinations. The selection of the best preprocessing method was made based on the root mean square error of calibration (RMSEC) and the mean error of cross validation (RMSECV) obtained by
92 continuous blocks.14,15
After choosing the pre-processing method, the models were optimized by the elimination of outliers. Methods for outlier identification have been described in detail in
several publications.15,16 In this work, outlier identification
was performed as described in ASTM E1655-0518 and in
the references published by Valderrama et al., based on
data with extreme leverage, unmodeled residuals in spectral data and unmodeled residuals in the dependent variable,
taking into account 99% confidence intervals.19 Initially,
a first calibration model was built and the outliers were removed from the calibration samples; then the model was recalculated and the outlier identification and exclusion process was repeated. After two outlier exclusions, the third model was considered to be optimized. The validation set was evaluated with the optimized calibration model and the outliers were excluded by applying the same criteria used for the calibration model.
Analytical figures of merit
Trueness is the parameter that informs the degree of agreement between the reference and the estimated values by
the proposed method.20 In average terms, it can be expressed
as the root mean square error of prediction (RMSEP), which is an approximation of the average prediction error for the
validation samples obtained from equation 1.21
(1)
where IV is the number of validation samples, while yi
and ŷi are respectively the reference value and estimated
value for the cocaine concentration for sample i. Another
parameter used to measure the degree of agreement between the reference value and estimated value is the relative error
of prediction (REP), which is determined by equation 2.21
(2)
The sensitivity (SEN) of the method determines the fraction of the analytical signal due to the increase in the concentration of a particular analyte in the unit concentration. The SEN was determined based on the regression coefficients of the PLSR model, according
equation 3.21-23
(3)
where b is the vector of regression coefficients with A
The precision of the method measures the dispersion of estimated results for the interest property obtained from independent experiments which are repeated for a same
sample under the defined conditions.24,25 Precision was
determined according to equation 4. For this purpose, four different samples with concentrations regularly distributed along the linear range of the method, with 10 replicates each performed in the same day, were analyzed.
(4)
where I is the number of samples, m is the number of
replicates, ŷi,j is the estimate concentration for sample i
and replicate j, and ȳ^i is the average concentration of the
replicates for sample i.
The minimum detectable concentration (MDC) is defined as the lowest concentration that can be reliably measured. The MDC can be determined by applying ISO
11843-2 recomendations.26,27 Ortiz et al. suggests that the
proposed ISO 11843-2 calculation can be directly extended
to multivariate cases.28 Thus, the MDC values were
calculated as suggested by Ortiz et al. using equation 5.28
(5)
where s is the standard deviation of the residues for the
linear regression between reference values and estimated
values by the proposed method, b is the slope of the
regression line, IC is the number of calibration samples,
m is the number of replicates, ȳ is the median concentration
in the calibration samples, δα,β,υ is the non-centrality
parameter of the t distribution, α and β are the probabilities
of occurrence for false negative and false positive errors,
respectively, and v(MDC) = IC− 2 degrees of freedom. In
this work, the two probabilities α and β were considered to
be equal to 0.05 (95% confidence level). It should be noted that the MDC estimated by equation 5 might be considered as an average to all possible MDC for future test samples, since the detectablility of the PLSR model depends on the
level of other background constituents.29
The confidence intervals can be defined as a range, with a given degree of confidence (i.e., a certain probability) that the real value for the concentration of the analyte of interest is included. This can be determined by applying a residual distribution model (usually the normal distribution) and the
estimated standard error of prediction (s(ŷ – y)), which are
determined by equations 6 and 7, respectively.23,30
(6)
(7)
where α is the significance level equal to 0.05 (95%
confidence level); tν,1-α/2 is the corresponding critical level
for the Student’s t distribution with ν pseudo degrees of
freedom, determined as proposed by Van der Voet;31MSEC
is the mean square error estimated in the calibration samples
with ν pseudo degrees of freedom; and hi is the leverage of
the sample, estimated by equation 8.30
(8)
where ti and T are respectively the scores for sample i and
for all the calibration samples, respectively.
Results and Discussion
Figure 1 shows the ATR-FTIR spectra obtained for (a) cocaine hydrochloride standard and (b) all the calibration samples, expressed in reflectance units. According to
Rodrigues et al., the spectral region that lies around
2540 cm−1 is characteristic of cocaine hydrochloride,
attributed to the N−H stretching due to the hydrochloride
salt formation.9 However, a high number of infrared signals
is observed in the infrared spectra of the cocaine standard, most of them also present in the calibration samples. Several infrared bands may be nominated: 729, 1026 and
1071 cm−1 (corresponding to the out-of-plane bending and
the mono substituted benzene stretching); 1105, 1265 and
1230 cm−1 (acetate C−O stretching); the bands between
1490-1460 cm−1 (C−H bending vibrations) and the bands
at 1712 and 1728 cm−1 (stretching vibration of the two
carbonyl groups). Furthermore, it is observed in Figure 1b a significant spectral variation in the data, which can be attributed to differences in cocaine content, the presence of diluting/adulterant agents, and instrumental variations. In Figure 2, the regression vector of the PLSR model developed with reflectance data is presented. It can be observed that the regression coefficients with the highest absolute values correspond to wavenumbers between 500
and 800 cm−1 and between 1400 and 1800 cm−1. The last
region can be attributed to the stretching vibration of the
two carbonyl groups at 1728 and 1712 cm−1 and the C−H
bending vibrations at 1490 and 1460 cm−1.
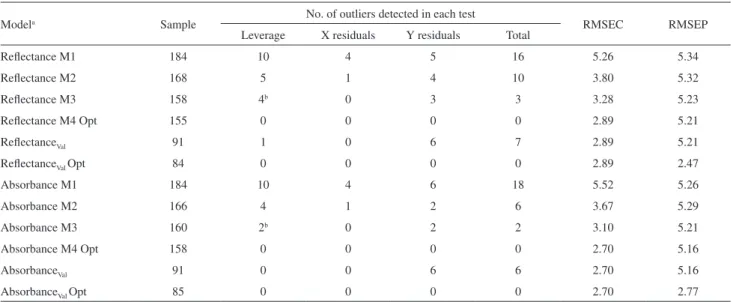
In addition, although some samples have been identified as outliers based on the leverage criterion in the third model (after the second exclusion), they were not excluded from the dataset since the ASTM E1655-05 indicates that the data may be presenting the “snowball effect”. In these cases, the ASTM E1655-05 suggests that the leverage criterion can be relaxed provided that no calibration samples have a leverage greater than 0.5. In these datasets, the high leverage observed in the optimized models for the reflectance and
absorbance data was 0.20 and 0.23, respectively.18
Table 1 also shows that when the model was built based on reflectance and absorbance measurements, 15.8% and 14.1% of the calibration samples and 7.7% and 6.6% of the validation samples were excluded, respectively. However, considering the high heterogeneity of the drug
samples, the number of outliers excluded in the calibration and validation samples was considered to be acceptable in both optimized PLSR models. Samples identified as outliers were analyzed in detail to verify the reasons for their exclusion. More than 60% of the outliers were part of seizures carried out at least three years ago, which may be the cause of changes in some of the chemical characteristics of the sample.
The results obtained for the figures of merit of the PLSR models are presented in Table 2. It can be observed that the average prediction errors (represented by RMSEC and RMSEP) were lower than 3.0% (m/m). For the samples presenting the lowest cocaine concentrations relative errors of approximately ± 20% were observed. However, considering all validation samples the average relative error
Figure 1. ATR-FTIR spectra of (a) cocaine hydrochloride standard and (b) the 184 drug samples used for model development.
Figure 2. Regression coefficients for the PLSR model developed for reflectance data.
Table 1. Results for the number of outliers identified by each parameter and the variation of the RMSEC and RMSEP values observed
Modela Sample No. of outliers detected in each test RMSEC RMSEP
Leverage X residuals Y residuals Total
Reflectance M1 184 10 4 5 16 5.26 5.34
Reflectance M2 168 5 1 4 10 3.80 5.32
Reflectance M3 158 4b 0 3 3 3.28 5.23
Reflectance M4 Opt 155 0 0 0 0 2.89 5.21
ReflectanceVal 91 1 0 6 7 2.89 5.21
ReflectanceVal Opt 84 0 0 0 0 2.89 2.47
Absorbance M1 184 10 4 6 18 5.52 5.26
Absorbance M2 166 4 1 2 6 3.67 5.29
Absorbance M3 160 2b 0 2 2 3.10 5.21
Absorbance M4 Opt 158 0 0 0 0 2.70 5.16
AbsorbanceVal 91 0 0 6 6 2.70 5.16
AbsorbanceVal Opt 85 0 0 0 0 2.70 2.77
was approximately 9% and 10% for the reflectance and absorbance models, respectively.
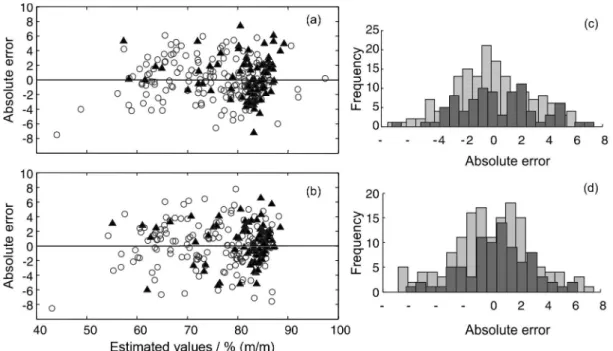
The linearity of the method was evaluated by the distributions and histograms of the residuas of the PLSR models, which are presented in Figure 3. Visually it is possible to verify the random behavior of these distributions. However, to verify the assumption of independence and normallity of the residuals it was applied the Jarque-Bera
test.32 According to this test, with 95% of confidence, the
normallity of the discributions cannot be rejected. Since the residual plot indicates the validity of the linear model, the
fitting of a straight line relating reference versus estimated
values can be used to estimate a correlation coefficient, slope and intercept. These parameters may then be used to express the goodness of fit of the PLSR models.
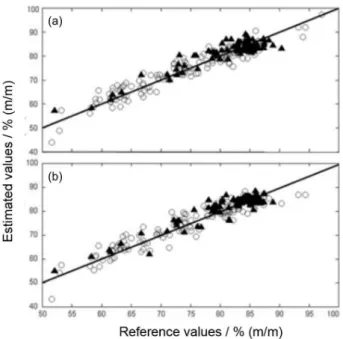
Figure 4 presents the dispersion graphics of the regressions between the reference and estimated values for both PLSR models. Good agreement was observed between the evaluated methods (GC-FID and FTIR), with correlation coefficients higher than 0.90 for both models. However, the results for the slope and the intercept of the regression line between the reference and estimated values for the cocaine concentration (presented in Table 2) shows that the PLSR model developed with the absorbance data present both constant and proportional systematic errors. This can be seen by the fact that the confidence intervals (with 95% confidence) do not contain the expected values of 1 and 0 for the slope and intercept, respectively. On the other hand, the model developed with the reflectance data showed no significant systematic errors. Therefore, both models showed comparable prediction errors, but taking into account the goodness of fit, only the PLSR model developed with reflectance values may be considered to have adequate trueness. This was an unexpected result since according the Beer-Lambert law, the data in the absorbance scale should provide a better relation with the analyte concentration. However, it should be noted that the Beer-Lambert law is strictly valid only for transmittance measurements.
The uncertainty of the PLSR models was estimated in
accordance with Pierna et al..30 Considering this approach,
Table 2. Analytical figures of merit for PLS models for the properties of interest
Figure of merit Reflectance Absorbance
Trueness / % (m/m) RMSEC 2.89 2.70
RMSEP 2.47 2.77
REPCal 3.94 3.66
REPVal 9.11 9.94
Precision / % (m/m) 1.46 1.52
Sensitivity / (% (m/m))–1 0.195 0.137
Goodness of fita slope 0.89 ± 0.11 0.82 ± 0.11
intercept 8.9 ± 9.1 14.6 ± 9.1
corr coef (R) 0.904 0.914
MDC / % (m/m) 12.8 11.6
a99% confidence interval.
it was found that, for both models, the average uncertainty was approximately 7%, with 95% confidence. A plot with confidence intervals for some validation samples is shown in Figure 5, which ilustrates the uncertainty of the results of the PLSR model developed with the reflectance data, and 95% confidence.
Precision at the repeatability level showed good results for both PLSR models, being approximately equal to 1.5% (m/m).
The MDC estimates represent an important figure of merit for the method. The estimated MDC values for the reflectance and absorbance models were 12.8% and 11.6%, respectively, which indicates that the FTIR method is suitable for determining the concentrations of most seizures made by BFP.
Conclusions
The results show that the validated method based on the combination of the ATR-FTIR spectroscopic technique and PLSR allows for the direct determination of the hydrochloride cocaine concentration of drug samples seized in several Brazilian states.
The method presented low absolute and relative average errors (lower than 3% (m/m) and 10%, respectively). Based on the quality of the fit, the model developed with the reflectance data was selected as the best model for determining cocaine hydrochloride concentration in drug samples.
This method can be considered convenient and versatile since it has the ability to significantly reduce the time and cost of analysis with respect to chromatographic analysis. Additionally, it is more environmentally friendly as it does not generate any chemical residues. Although gas chromatography has been frequently used because it offers accurate results, infrared spectroscopy has shown similar precision, acceptable trueness and detection capability, and a wide linear range (35% to 99% (m/m)), which fulfills the requirements for its application in forensic laboratories.
The proposed method allows for fast and accurate creation of criminal expert reports, thus contributing to the judiciary system and benefitting society.
Acknowledgments
The authors thank FINEP/MCT for the financial support of the PeQui Project (01.09.0275-00), CNPq, BRA I90/ UNODC/FP, INCTAA/CNPq and INCTBio/CNPq.
References
1. United Nations Office on Drugs and Crime (UNODC); World Drug Report; United Nations: New York, 2011.
2. United Nations Office on Drugs and Crime (UNODC); World Drug Report; United Nations: New York, 2013.
3. Chasin, A. A. M.; Mídio, A. F.; Rev. Bras. de Toxicol.1991, 4, 23.
4. Moore, J. M.; Casale, J. F.; J. Chromatogr. A1994, 674, 165. 5. Floriani, G.; Gasparetto, J. C.; Pontarolo, R.; Gonçalves, A. G.;
Forensic Sci. Int.2014, 235, 32.
6. Buján, L.; Fernández, P.; Lafuente, N.; Aldonza, M.; Bermejo, A. M.; Anal. Chem. Lett.2001, 34, 2263.
7. Piñero, E. L.; Casale, J. F.; Microgram J.2006, 4, 47. 8. United Nations Office on Drugs and Crime (UNODC); Methods
for Impurity Profiling of Heroin and Cocaine, United Nations:
New York, 2005.
Figure 4. Reference values versus estimated values by the PLSR models for absorbance (a) and reflectance (b). Calibration samples () and validation samples ().
9. Rodrigues, N. V. S.; Cardoso, E. M.; Andrade, M. V. O.; Donnici, C. L.; Sena, M. M.; J. Braz. Chem. Soc. 2013, 24, 507. 10. Ravreby, M.; J. Forensic Sci.1987, 32, 20.
11. Ryder, A. G.; O’Connor, G. M.; Glynn, T. J.; J. Forensic Sci.
1999, 44, 1013.
12. Maharaj, R.; J. of Third World Med. 2009, 7.
13. Pérez-Alfonso, C.; Galipienso, N.; Garrigues, S.; Guardia, M.; Forensic Sci. Int.2014, 237, 70.
14. Brereton, R. G.; Chemometrics:Data Analysis for the Laboratory and Chemical Plant, Wiley: Chichester, USA, 2003.
15. Martens, H.; Naes, T.; Multivariate Calibration, John Wiley & Sons: New York, USA, 1989.
16. Walczak, B.; Massart, D. L.; Chemom. Intell. Lab. Syst.1998, 41, 1.
17. Kennard, R. W.; Stone, L. A.; Technometrics1969, 11, 137. 18. Annual Book of ASTM Standards, Standards Practices
for Infrared, Multivariate, Quantitative Analysis, ASTM
International E1655-05, West Conshohocken: Pennsylvania, USA, 2005.
19. Valderrama, P.; Poppi, R. J.; Braga, J. W. B.; J. Agric. Food Chem. 2007, 55, 8331.
20. INMETRO, Vocabulário Internacional de Metrologia-Conceitos Fundamentais e Gerais e Termos Associados (VIM
2012), 1ª ed. luso-brasileira, Portaria No. 232, Brasília, Brasil, 2012.
21. Valderrama, P.; Braga, J. W. B.; Poppi, R. J.; Quim. Nova 2009, 32, 1278.
22. Lorber, A.; Anal. Chem.1986, 58, 1167.
23. Olivieri, A. C.; Faber, M. N.; Ferré, J.; Boqué, R.; Kalivas, J. H.; Mark, H.; Pure Appl. Chem.2006, 78, 633.
24. Instituto Nacional de Metrologia, Normalização e Qualidade Industrial (INMETRO); Orientações sobre Validação de Métodos de Ensaios Químicos, DOQ-CGCRE-008, Rio de
Janeiro: Brasil, 2007.
25. Ministério da Agricultura, Pecuária e Abastecimento (MAPA). Guia de Validação e Controle de Qualidade Analítica:
Fármacos em Produtos para Alimentação e Medicamentos
Veterinários,Brasília: Brasil, 2011.
26. O’Malley, A. J.; Deely, J. J.; Aust. N. Z. J. Stat. 2003, 45, 43. 27. ISO, 11843-2: Capability of Detection, International Standards
Organization, Switzerland: Geneva, 2000.
28. Ortiz, M. C.; Sarabia, L. A.; Herrero, A.; Sánchez, M. S.; Sanz, M. B.; Rueda, D.; Giménez, M. E.; Meléndez, M. E.; Chemom. Intell. Lab. Syst.2003, 69, 21.
29. Boque, R.; Larrechi, M. S.; Rius, F. X.; Chemom. Intell. Lab. Syst.1999, 45, 397
30. Pierna, J. A. F.; Jin, L.; Wahl, F.; Faber, N. M.; Massart, D. L.; Chemom. Intell. Lab. Syst. 2003, 65, 281.
31. Van Der Voet, H.; J. Chemom. 1999, 13, 195.
32. Jarque, C. M.; Bera, A. K.; Int. Stat. Rev.1987, 55, 163.
Submitted on: April 28, 2014