Behavior of granular rubber waste tire reinforced soil
for application in geosynthetic reinforced soil wall
Comportamento de solo reforçado com resíduo
granular de borracha de pneu para aplicação em parede
de solo reforçada com geossintético
a Department of Civil Engineering, Pontiical Catholic University of Rio de Janeiro; Rio de Janeiro, RJ, Brazil;
Abstract
Resumo
Large quantities of waste tires are released to the environment in an undesirable way. The potential use of this waste material in geotechnical ap-plications can contribute to reducing the tire disposal problem and to improve strength and deformation characteristics of soils. This paper presents a laboratory study on the efect of granular rubber waste tire on the physical properties of a clayey soil. Compaction tests using standard efort and consolidated-drained triaxial tests were run on soil and mixtures. The results conveyed an improvement in the cohesion and the angle of internal friction the clayey soil-granular rubber mixture, depending on the level of conining stress. These mixtures can be used like backill material in soil retaining walls replacing the clayey soil due to its better strength and shear behavior and low unit weight. A numerical simulation was conducted for geosynthetic reinforced soil wall using the clayey soil and mixture like backill material to analyzing the inluence in this structure.
Keywords: triaxial tests, granular rubber, waste, reinforced soil.
Uma grande quantidade de resíduo de pneu é descartada no meio ambiente de forma indesejada. O potencial de uso deste resíduo em apli-cações geotécnicas podem contribuir para a redução do problema de descarte e melhorar as características de resistência e deformação dos solos. Este artigo apresenta um estudo laboratorial dos efeitos da aplicação dos resíduos granulares de pneus nas propriedades físicas de solos argilosos. Foram desenvolvidos testes de compactação usando esforços padrão e ensaios triaxiais consolidados drenados em amostras de solo e suas misturas. Os resultados apresentam uma melhoria na coesão e no ângulo de atrito do solo argiloso e a mistura com borracha granular, dependendo do coninamento das tensões. Estas misturas podem ser utilizadas como material de aterro em paredes de contenção em substi -tuição de solos argilosos devido a um melhor desempenho na resistência ao cisalhamento e baixo peso unitário. Uma simulação numérica foi realizada para parede de solo reforçada com geossintético utilizando solo argiloso e misturas para materiais de aterro com a inalidade de analisar a inluência nesta estrutura.
Palavras-chave: ensaios triaxiais, borracha granular, resíduo, reforço de solo.
G. G. D. RAMIREZ a
M. D. T. CASAGRANDE a
D. FOLLE b [email protected]
A. PEREIRA b [email protected]
1. Introduction
Scrap tires are increasing every year and their disposal is a major environmental problem. Particles of rubber tires are been using in landill engineering as subgrade reinforcement for construction roads over soft soil and others researches suggest their applica-tion in civil engineering because of their low density, high durability, high thermal insulation and low cost compared with other ill ma -terials (Cetin, [1]; SZELIGA, [2], RAMIREZ, [3]). In Brazil is being using a speciic granular rubber of scrap tires mixed with asphalt for the cap asphaltic road.
This research aimed to understand the viability of this granular rubber as reinforcement material in geotechnical works (layers of landills, embankments on soft soils and temporary landills), obtaining a irst knowledge of the behavior of reinforced clayey soil with this granular rubber from scrap tires. Finally, use of this alternative material would decrease the demand of natural resources, reducing the environmental impact and adding value to this waste.
2. Materials
2.1 Clayey soil
The clayey soil used in this study is a residual tropical soil (Figure 1) with a limit liquid of 53%, a limit plastic of 39% and speciic grav -ity 2.72. It was collected in the Experimental Field II located in the PUC-Rio Campus. The grain size distribution curve is shown in Figure 3. This clayey soil is classiied as MH according to SUCS. This soil has a micro-granular texture, constituted by quartz, al -tered garnet, clay minerals (mainly kaolinite) and iron and alumi -num oxides.
2.2 Granular rubber
The granular rubber used for reinforced the clayey soil (Figure 2) is by-products of the tire retread process. The speciic gravity of this material is 1,12. Its middle diameter is 1,0 mm, varying between 0,2 mm and 2,0 mm. The particle size distribution is shown in Fig -ure 3. This material is composed of 50% by weight of particular cars tire and 50% by weight of trucks tire. In Brazil this granular rubber is mainly used in road construction area. A mixture of as-phalt and granular rubber is being used as an eicient technology to achieve Brazilian road requirements.
Figure 1 – Clayey soil
Figure 2 – Granular rubber
2.3 Mixtures
Clayey soil was mixed with 5%, 10% and 20% of granular rubber by dry weight of soil. Water was added according to the optimum moisture and the maximum dry density obtained from Standard Proctor Test (standard compactive efort) performed on each material (S100, S95/B5, S90/B10 and S80/B20). The abbrevia-tions used to denote the soil and mixtures are shown in Table 1.
3. Experimental procedure
In order to obtain the optimum rubber content was performed tri-axial tests on samples with 5%, 10% and 20% of granular rubber by dry weight of clayey soil (S100). Physical characterization and standard proctor tests were run on clayey soil and mixtures.
3.1 Physical characterization tests
Characterization tests were performed to determine the index properties of clayey soil samples, from the Experimental Field II. The soil was prepared according to the Brazilian technical stan -dard (Brazilian Association of Technical Stan-dards – ABNT). The performed tests followed next standards:
n NBR 6457/1986 – Samples
of Soil – Preparations for us -ing in Proctor Test and Char-acterization.
n NBR 7181/1984 – Soil –
Particle Size Analysis.
n NBR 6508/1984 – Soil – Spe -ciic Gravity of Soil Solids.
n NBR 6459/1984 – Soil – Liq -uid Limit.
n NBR 7180/1984 – Soil –
Plastic Limit.
solids, particle size analysis, liquid limit and plastic limit tests were performed using the material iner than size #40 (0,425 mm). An important step to obtain the speciic gravity of soil solids is remov -ing the entrapped air in the soil with a vacuum pump. Then was added water to the pycnometers until complete its capacity. Four pycnometers were used to calculate an average value of Gs. The particle size analysis for coarse soil was done according to the standards by sieving, while the distribution of particle size for ine soil was determined by sedimentation process using a hydrometer.
3.2 Standard proctor tests
Standard proctor tests were conducted on the clayey soil (S100) and mixtures (S95/B5, S90/B10 and S80/B20) to determinate the optimum moisture (wopt) and the maximum dry density (γdmax) of all materials. These tests were made according to NBR 7182, us-ing the standard compactive efort.
The compaction was made in a small cylindrical mold (internal di-ameter 10 cm and height 12,7 cm). It applied 26 blows in each layer (three layer in total) with a manual rammer, of 2,5 kg of weight, falling 30,5 cm of height. Carefully was trimmer the top of the compacted specimen until to form a plane surface with the top of the mold. Then was deter-mined the mass of the specimen inside the mold using a balance and subtracting the mold weight.
Table 1 – Symbols used to denote
the soil and mixtures
Material /
Mixture Soil (%)
Granular
rubber (%) Symbol
Clayey soil 100 0 S100
Mixture 1 95 5 S95/B5
Mixture 2 90 10 S90/B10
Mixture 3 80 20 S80/B20
Table 2 – Clayey soil physical characterization
Gs Sand (%) Clay (%) LL (%) LP (%) IP (%) SUCS
2.72 36.4 10.8 53 39 14 MH
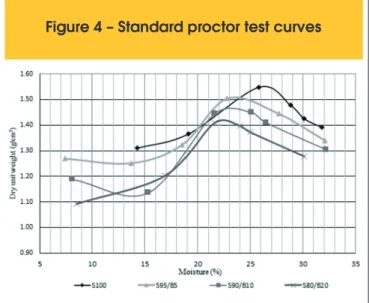
Figure 4 – Standard proctor test curves
Table 3 – Optimum moisture and maximum
dry unit weight
Material / Mixture Wopm (%) gdmax (%)
S100 26.3 1.56
S95/B5 23.5 1.51
S90/B10 23.1 1.47
The material was removed from the mold to obtain a specimen for moisture. Then, with each moisture and dry density was plotted the points of the compaction curve. At least were used two molding wa-ter content points in each side of the curve (wet and dry side).
3.3 Triaxial tests
Standard triaxial testing procedures were followed. The speci-mens were saturated using backpressure and percolation of
Figure 5 – Results of drained triaxial tests for clayey soil (S100) and mixture (S95/B5)
0 100 200 300 400 500 600 700 800
0 2 4 6 8 10 12 14 16 18 20 22 24 26 28 30 32
σv
(kPa)
εs(%)
S100 50kPa S95/B5 50kPa S100 100kPA S95/B5 100kPa S100 200kPa S95/B5 200kPa S100 400kPa S95/B5 400kPa
-2 -1 0 1 2 3 4
0 2 4 6 8 10 12 14 16 18 20 22 24 26 28 30 32
εv
(%)
εs(%)
water through the samples. The final saturation was estimated with Skempton parameter (B = 0,97). Consolidated-drained (CD) tests were conducted on clayey soil and mixtures. Ac-cording to HEAD [5], the maximum rate of deformation was
determined using the minimum time of failure 8,5t100. The rate of deformation used in the shear phase was 0,022 mm/min for all samples. After compact the clayey soil and the mixtures with their optimum moistures and maximum dry densities were
Figure 6 – Results of drained triaxial tests for clayey soil (S100) and mixture (S90/B10)
0 100 200 300 400 500 600 700 800
0 2 4 6 8 10 12 14 16 18 20 22 24 26 28 30 32
σv
(kPa)
εs(%)
S100 50kPa S90/B10 50 kPa S100 100kPa S90/B10 100kPa S100 200kPa S90/B10 200kPa S100 400kPa S90/B10 400kPa
-2 -1 0 1 2 3 4
0 2 4 6 8 10 12 14 16 18 20 22 24 26 28 30 32
εv
(%)
εs(%)
molded samples with 3,8 cm of diameter and 7,2 cm of height.
4. Results and analysis
The results of speciic gravity (Gs), liquid limit (LL), plastic limit (LP) and a resume of particle size are shown in Table 2. According with
SUCS this soil is classiied as a silt high plasticity (MH), but in this research it is named clayey soil due to it has more than 50% of clay. The soil particle size distribution curve is shown in Figure 3. The compaction results showed the maximum dry unit weights and the optimum moistures of mixtures are lower than those for clayey soil (S100). This decrease is mainly due to lower speciic gravity
Figure 7 – Results of drained triaxial tests for clayey soil (S100) and mixture (S80/B20)
0 100 200 300 400 500 600 700 800
0 2 4 6 8 10 12 14 16 18 20 22 24 26 28 30 32
σv
(kPa)
εs(%)
S100 50kPa S80/B20 50kPa S100 100kPA S80/B20 100kPa
S100 200kPa S80/B20 200kPa S100 400kPa S80/B20 400kPa
-2 -1 0 1 2 3 4 5
0 2 4 6 8 10 12 14 16 18 20 22 24 26 28 30 32
εv
(%)
εs(%)
S100 50kPa S80/B20 50kPa S100 100kPA S80/B20 100kPa
of the rubber. The Figure 4 and Table 3 show the results of the standard compaction tests performed on clayey soil and mixtures. The triaxial tests showed that exist a positive inluence of granular rubber reinforcement on the shear strength behavior of the clayey soil. The mixture with 10% of rubber has the better behaviour com-pared with the others mixtures (See Figures 5, 6 and 7).
The shear strength of the mixture (S90/B10) increase in relation to clayey soil (S100), this occur until 200 kPa of efective conine stress, beyond of this conine stress the presence of granular rubber
degrade the shear strength of the clayey soil. The shear strength of clayey soil reached 162, 250, 440 kPa at 50, 100 and 200 kPa of coninement stress, respectively. On the other hand, the shear strength of S90/B10 mixture attained 184, 312, 478 kPa at same conining stresses. The increases of strength were 52%, 124% and 10% for 50, 100 and 200 kPa of coninement stress, showing clearly the inluence of conining stress on shear strength. In large strain, the shear strength of the mixture maintains larger that strength of the clayey soil. Only for 400 kPa of efective coninement stress, the
Figure 2 – Example of application of reinforced concrete circular cross section elements working
as beams in a shallow tunnel (Maffei, [9]): (a) details of the reinforcement; (b) concluded beams
Figure 8 – Sheared mixture speciemens. Confining stress: (a) 100 kPa, (b) 200 kPa and (c) 400 kPa
A
B
C
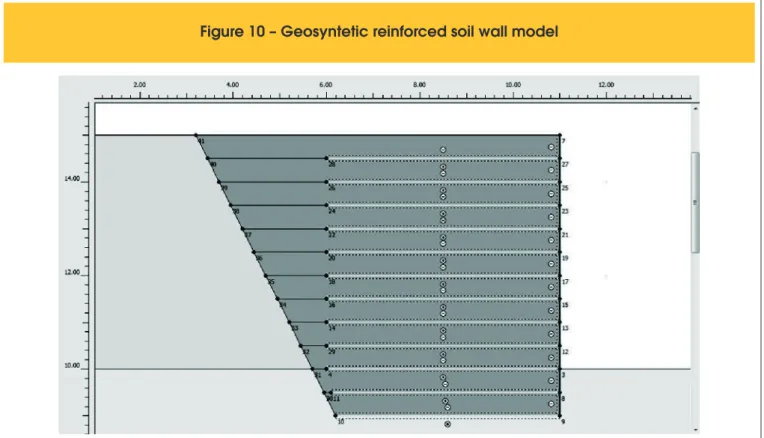
Figure 10 – Geosyntetic reinforced soil wall model
shear strength of the mixture was shorter than strength of clayey soil, however from 30% of strain can it appreciate that the shear strength of clayey soil has a tendency to be shorter than mixture and the shear strength of the mixture tend to arise. Volume chang-es caused by shearing difer for clayey soil and mixturchang-es. S90/ B10 mixture shows less contraction comparing with S100 for 50, and 100 kPa conining stress. Furthermore, these both specimens show higher rate of dilatation than other mixtures and higher shear
strength than the clayey soil. Dilatation could mobilize the tensile stress on rubber, adding strength during shear stage. The tested S90/B10 mixture specimens are shown in Figure 8.
In the Figure 9 are shown the strength envelopes of the clayey soil and the mixture 2 (S90/B10). This envelope were plotted in p’:q space. The strength envelope of the mixture shows bilinearity due to conining stress inluence. For high levels of coninement the strength decrease and can be less than strength of clayey soil. The irst part of the mixture strength envelope has a friction angle of 34,4° and the second parte decreases to 21,9°. In the other hand, the cohesion of the irst part of the envelope is 14,2 kPa, arising in the second part to 81,3 kPa.
5. Numerical simulation of a geosynthetic
reinforced soil wall
It was performed a numerical simulation of a geosynthetic rein-forced soil wall. This structure was formed with layer of compacted soil (backill) reinforced with geogrids. A precast concrete face completed the structure. It was considered 6,0 m of height and 12 layer of 0,5 m of thickness (See Figure 10).
It was using the inite element program PLAXIS to run this exam -ple. The purpose of this simulation was to compare the behaviour of the geosynthetic reinforced soil wall when the backill is consti -tuted for clayey soil (S100) or mixture 2 (S90/B10). There were deined points in the precast concrete face to know the horizontal displacements generated for the backill. The Hardening soil model was used for the backill materials and the Mohr Coulomb model was assigned to foundation soil. Horizontal displacement on top
Figure 12 – Horizontal Displacements
on precast concrete wall
wall was 4.4 cm for clayey soil backill. Moreover, S90/B10 backill induced 2.3 cm of horizontal displacement on top wall. The hori -zontal displacement along the wall was less when S90/B10 mate -rial was used as backill. The Figure 11 show the deformations generated after the last construction phase.
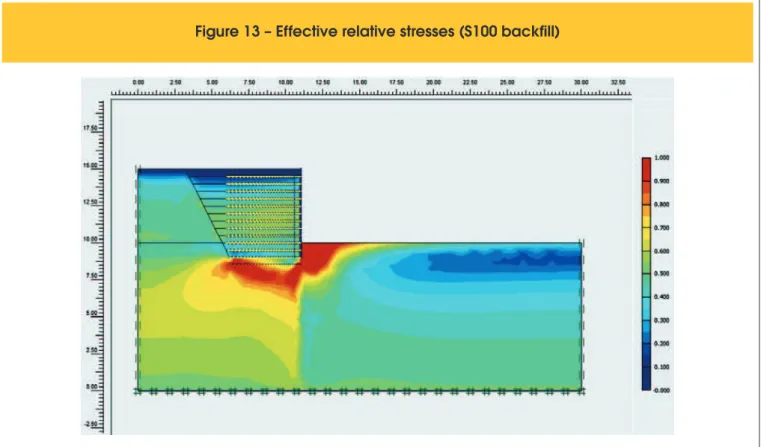
In addition, when it was used S90/B10 backill the efective relative stresses were less than the efective relative stresses registered when S100 backill was used. See Figures 13 and 14.
6. Conclusions
n Addition of granular rubber enhances the clayey soil behavior improving its shear strength.
n For large deformation, the shear strength of mixture is higher than clayey soil and the development of strength has a better behavior than clayey soil.
n The inluence of the coninement in the mixture behavior is im -portant. Exist a limiting conining pressure beyond which the presence of the granular rubber degrades the strength of the clayey soil. This could be explained because of the excessive coninement that restricts dilatation, in consequence the granu -lar rubbers cannot mobilize tensile stress. Thus, this mixture will have a better performance than clayey soil under low con-inement levels (Özkul and Baykal,[6]).
n Results of the numerical simulation showed minors horizontal
displacements in the precast concrete wall when the mixture S90/B10 was used as backill.
n Low efective stresses were generated when S90/B10 backill
was used in the retaining wall.
n This mixture is an adequate material to be used in some geotechnical application as layers of landills, backill in retain -ing walls, small embankments on soft soils, temporary landills, subgrade reinforcement for construction roads over soft soil. In these projects the presence of low coninement stresses en -able the use of this material.
n An important contribution to the environmental, low cost of the
projects and major quality of this geotechnical structures would be possible with more researches in non-conventional material particularly with waste (Ramirez and Casagrande, [4]).
7. References
[1] CETIN, H.; FENER, M.; GUNAYDIN, O. Geotechnical proper -ties of tire-cohesive clayey soil mixtures as a ill material. Engi -neering Geology, n.88, 2006. p. 110-120.
[2] SZELIGA, L. Avaliação do comportamento de solos reforçados com borracha moída de pneus inservíveis para aplicação em obras. PUC-Rio, Rio de Janeiro, 2011
[3] RAMIREZ, G. G. D. Estudo Experimental de Solos Reforçados com Borracha de Pneus Inservíveis. PUC-Rio, Rio de Janeiro, 2012.
[4] RAMIREZ, G. G. D. and CASAGRANDE, M. D. T. Experimen-tal Study of Granular Rubber Waste Tire Reinforced Soil for Geotechnical Applications. Non-Conventional and Technolo-gies for Sustainable Engineering, Key Engineering Materials, vol. 600, p 585-596, 2014.
[5] HEAD, K. H. Manual of Soil Laboratory Testing: Efective Stress Test. Wiley, 2da ed., vol. 3, West Sussex, Inglaterra, p. 227, 1986.


![Figure 2 – Example of application of reinforced concrete circular cross section elements working as beams in a shallow tunnel (Maffei, [9]): (a) details of the reinforcement; (b) concluded beams Figure 8 – Sheared mixture speciemens](https://thumb-eu.123doks.com/thumbv2/123dok_br/18860850.417903/7.892.73.831.238.497/example-application-reinforced-concrete-circular-reinforcement-concluded-speciemens.webp)