A predictive model for healthy and HIV-infected adults"
Hugo de Sousa Lopes
Faculty of Nutrition and Food Sciences, University of Porto
"Body cell mass by anthropometric measures: A predictive model for healthy and HIV-infected adults"
Hugo de Sousa Lopes1
With the collaboration of: Jack Wang2 and Donald P Kotler3
1 Faculty of Nutrition and Food Sciences, University of Porto, Portugal
2 Body Composition Unit, St. Luke's-Roosevelt Hospital Center, Columbia University,
New York, NY, USA
3 Gastroenterology Division, St. Luke's-Roosevelt Hospital Center, Columbia University,
New York, NY, USA
Porto
André Almeida Deceased at 27-01-2001
In dreams begin responsibility.
Thanks to:
My best friends and companions of journey in New York City, Bruno and Ricarda. Without you both, this study could not be possible.
Dr. Donald P. Kotler, on behalf of his friendship, his amazing scientific mind and his example of daring all scientific tearfulness.
Dr. Jack Wang, on behalf of his friendship, his affability and his example of dedication and meticulousness.
Body composition studies were supported by the following grants: NIH AI21414, DK37352, DK42618, DK52610, a grant from the New York State AIDS
Institute, and grants from Alza Incorporated, Biotechnology General Corporation, Gynex Corporation, Janssen Pharmceuticals, and Serono Laboratories.
OM- Si 1 4?FCNAUPV „ BIBLIOTECA ^
Contents "~~~ Tables List xi Figures List xiii Abbreviations List xv Abstract 1 Keywords 2 Introduction 2 Objectives 3 Methods 3 Study Design 3 Subjects 3
Measurement of Total Body Potassium 4 Measurement of Anthropometric Parameters 4
Statistical Analysis 5
Results 6 Development of the Predictive Model for Estimating BCM 7
Cross-validation of the New Predictive Model 10 Comparison of the New Model with the Measured BCM 10
Agreement Between Races and Health Status 12
Discussion 12 Conclusions 18
Tables List
Table 1. - Descriptive characteristics of the 1379 subjects by race, health
status and gender 7 Table 2. - Variables most significant for the prediction after backward multiple
regression \ and after stepwise multiple regression2 8
Table 3. - Regression coefficients, model r2, SEE, PE, r2 of the model in the
Body cell mass by anthropometric measures: A predictive model for healthy and HIV-infected adults wii.
Figures List
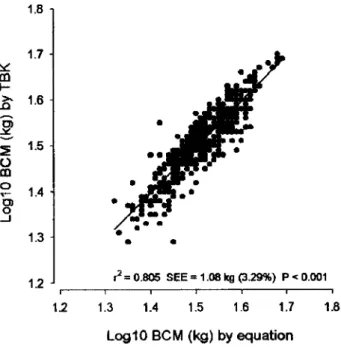
Figure 1. Plot of the males regression in model-development group. Log 10 BCM (kg) predicted by total body potassium (TBK) measured by whole-body ^K counting on the ordinate and Log 10 BCM calculated with the new equation
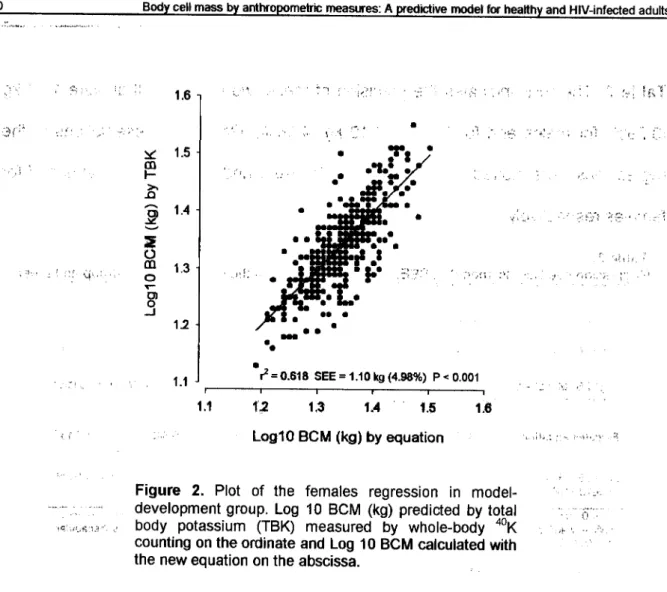
on the abscissa 9 Figure 2. Plot of the females regression in model-development group. Log 10
BCM (kg) predicted by total body potassium (TBK) measured by whole-body ^K counting on the ordinate and Log 10 BCM calculated with the new equation
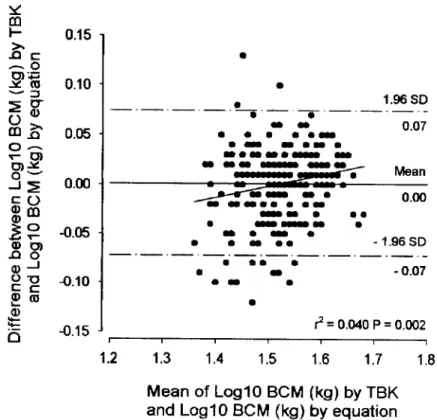
on the abscissa 10 Figure 3. Bland-Altman analysis(25) in males of the cross-validation group. The
difference between Log 10 BCM (kg) predicted by total body potassium (TBK) measured by whole-body ^K counting and Log 10 BCM calculated with the new equation plotted against their mean. The 95% CI is indicated by the upper
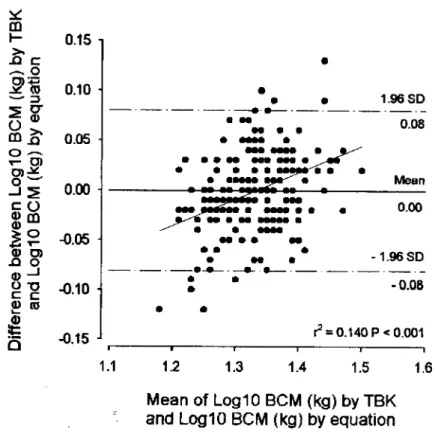
and lower lines 11 Figure 4. Bland-Altman analysis (25) in females of the cross-validation group.
The difference between Log 10 BCM (kg) predicted by total body potassium (TBK) measured by whole-body ^K counting and Log 10 BCM calculated with the new equation plotted against their mean. The 95% CI is indicated by the
Abbreviations List ABD - Abdominal skinfold
AIDS - Acquired immunodeficiency syndrome AL - Arm length
ANOVA - One-way analysis of variance ASMM - Appendicular skeletal muscle mass BCM - Body cell mass
BIC - Biceps skinfold BMI - Body Mass Index
CA - Upper arm circumference CC - Chest circumference CF - Calf skinfold
CFC - Calf circumference CIC - Iliac crest circumference CR - Wrist circumference CST - Chest skinfold CT - Thigh circumference CW - Waist circumference FFM - Fat-free mass
HIV - Human immunodeficiency virus
MK - Isotope 39 of potassium
^ K - Radioisotope 40 of potassium
42K - Radioisotope 42 of potassium
Body cell mass by anthropometric measures: A predictive model for healthy and HIV-infected adults
Log 10 - Base 10 logarithm PE - Pure error
PEM - Protein energy malnutrition SCP - Subscapular skinfold
SEE - Standard error of the estimate
SPSS - Statistical Program for Social Sciences TBK - Total body potassium counting
THI - Thigh skinfold THR - Thorax skinfold TL - Thigh length TRI - Triceps skinfold
UCC - Upper chest circumference Ul - Supra-iliac skinfold
Abstract
The depletion of body cell mass (BCM), the metabolically active tissue of the body, is an important feature of protein energy malnutrition, AIDS and aging. The gold standard method for BCM estimation, total body potassium counting (TBK), has limited availability and is a very expensive method. Hence we derived predictive equations for BCM, using anthropometric measures. We carried out a retrospective, cross-sectional analysis in a sample of 1379 adult subjects, with 968 healthy and 411 HIV-infected. The entire sample was divided 2:1 into model-development and cross-validation group, respectively. TBK was measured by 4 K whole-body liquid scintillation counting. Anthropometric measurements were performed by trained observers and included 10 skinfolds, 2 body lengths, 8 body circumferences, height and weight. A backward-stepwise multiple regression analysis was performed to predict Log10 BCM. The model presented two specific equations, one for males (r* = 0.805, SEE=1.08 kg (3.29%), p<0.001) and other for females (r2 = 0.618, SEE=1.10
kg (4.98%), p <0.001). Validation tests displayed an r2 = 0.724, PE=1.09 kg (3.22%)
and r2 = 0.642, PE=1.10 kg (5.06%), for males and females respectively. Males
equation had a p = 0.814 in the Student's paired f-test, while females equation had a p = 0.715. The test of agreement between different health status and the difference of residuals between all races, had both a p >0.05 in cross-validation group and in the entire sample. These results express a great precision, performance, and accuracy of the model and don't show any bias. The equations had the same reliability in healthy and HIV-infected subjects, as well in different races. Therefore the model is very useful to predict BCM in HIV-infected, obese, elderly and healthy individuals, and it
2 Body cell mass by anthropometric measures: A predictive model for healthy and HIV-infected adults
fulfills the great gap that subsisted in the BCM perdition in worldwide research and clinical essays.
Key Words: body composition body cell mass anthropometric measures TBK protein energy malnutrition HIV infection body cell mass depletion -sarcopenia
Introduction
Protein energy malnutrition (PEM) is a usual phenomenon in medicine with clinical consequences of major importance (1). Malnutrition and weight loss are
common occurrences in patients with the acquired immunodeficiency syndrome (AIDS) (2"5). Most patients are also significantly depleted of body cell mass (BCM) and
the clinical exam may not express the severity of the depletion (2,6,7). The association
of weight loss or BCM depletion with many adverse clinical outcomes had been showed in several studies (3,8"10). Kotler et al reported that the timing of death from
wasting in AIDS is related to the magnitude of BCM depletion (2) and this magnitude is
similar to that found in other chronic debilitating diseases (11). Thus, the early
detection and treatment of malnutrition are important features of clinical exercise. According to Moore et al BCM is the "component of the body composition containing the oxygen-exchanging, potassium-rich, glucose-oxidizing, work-performing tissue"(12). The components of BCM are the nonadipose cellular fractions
of skeletal muscle, viscera, organs, brain, and blood (12), thus, BCM has a particular
importance in the maintenance of the normal physiological function of the body, and its depletion should be of great concern for physicians and nutritionists.
Although, BCM is an important measure of macronutrient status, the gold standard method for its estimation is total body potassium counting (TBK), a method
that is not generally available in the most research centers <113-16). TBK is also a
costly method to develop and maintain, that requires specialized teams, and is not practical to apply in epidemiological and clinical field studies or at the bedside
(1,13,15,16)
AIDS is a disease that don't discriminate race, age or location, and people can be infected even in the most recondite places, where, sometimes, not even the required means for the disease diagnosis are available. Furthermore, clinical trials require that subjects must be followed longitudinally and measured repeatedly.
Objective
An inexpensive, widely available, practical and reliable method for prediction of BCM is required for epidemiological and clinical evaluations. Therefore, we derived and validate predictive equations for BCM, using anthropometric measurements, which would permit a widespread use in healthy and HIV-infected adults.
Methods
Study Design. This study was a retrospective, cross-sectional analysis of body
composition studies performed in the Body Composition Unit at St Luke's-Roosevelt Hospital Center between 1986 and 2002.
Subjects. The data included body composition studies of 968 healthy and 411
HIV-infected adult subjects, including 747 males and 632 females, aged 18 to 67 years. The healthy subjects were participants of the Rosetta Longitudinal Study, a database of healthy individuals. The HIV-infected subjects were primarily participants in studies for malnutrition and lipodystrophy. Only a single evaluation of each subject was considered. Subjects were randomly divided into a modekdeveiopment group (with 67% of entire sample) to develop the equations and a cross-validation group
4 Body cell mass by anthropometric measures: A predictive model for healthy and HIV-infected adults
(with the remaining 33% of entire sample) used to compare the equations. The groups were stratified by health status and gender, so that the numbers in each group were proportional to the entire population. All the measurements were made respecting the regulation of the Institutional Review Board, and after obtained written informed consent.
Measurement of Total Body Potassium. TBK analysis was performed by a
noninvasive measurement of ^ K as a measure of BCM, in the St Luke's 4 % whole-body liquid scintillation counter(17). The application of whole-body counting of ^ K in
the measurement of TBK is based on the knowledge that under normal circumstances > 97% of all the K is found in the nonadipose-tissue cell mass and that a constant small percentage of K is radioactive, with an emission readily detected by the whole-body counter(18). Since the naturally occurring radioisotope ^ K exists in
constant ratio with 39K (0.018%), the body's total activity of ^ K can be considered a
valid indicator of body cell mass. Thus, the counter detects the natural 1.46 MeV gamma ray of ^ K in raw counts collected over 9 min, adjusted for the effect of attenuation due to overlying fat and other tissues on the basis of an experimental 42K
calibration equation (18). The precision of this method is ±2.4% on calibration
standards (19) and ±4% on human subjects (18). The results of TBK measurements in
millimoles were converted to kilograms of BCM by multiplying by 0.0092 (20).
Measurement of Anthropometric Parameters. Height was measured to the
nearest 0.5 cm using a stadiometer (Holtain, Crosswell, Wales, U.K.), and weight to the nearest 0.1 kg (Weight Tronix, New York, NY, U.S.A.). Other anthropometric measurements (skinfolds, circumferences and lengths) were performed as described
elsewhere (21) by trained observers with a reproducibility of ± 2% for circumferences
and ± 10% for skinfolds(22). The anthropometric sites initially included in the equation
development were the triceps (TRI), biceps (BIC), subscapular (SCP), chest (CST), supra-iliac (Ul), thorax (THR), umbilical (UMB), abdominal (ABD), thigh (THI) and calf (CF) skinfold thickness, the circumferences of the upper arm (CA), wrist (CR), upper chest (UCC), chest (CC), waist (CW), iliac crest (CIC), thigh (CT) and calf (CFC) and the arm (AL) and thigh (TL) lengths. Skinfold thickness was determined to the nearest 0.2 mm with Lange skinfold calipers (Cambridge Scientific Instruments, Cambridge, MD). The reported precision of the method is ± 7% (2). All subjects with skinfolds
higher than 60mm were excluded from this study, since 60 mm is considered the maximum reliable reading of the Lange caliper.
Statistical Analysis. As said before, we randomly separated all subjects into 2
groups with different proportions (2:1), a model-development group and a cross-validation group. One first linear regression analysis was performed using all the anthropometric variables. The model developed, showed a difference, with statistical meaning, between races. The next step was to transform all variables in base 10 logarithms, with purpose of eliminate those racial differences. By performing a backward-stepwise multiple regression analysis in the model-development group, we determined the most significant Log10 variables to predict Log10 BCM (dependent variable), deriving a new empirical model, constituted by two specific equations, one for each gender. The prediction equations obtained where then validated in the cross-validation group. The coefficient r2 was used as a measure of goodness of model fit in
6 Body cell mass by anthropometric measures: A predictive model for healthy and HIV-infected adults
paired f-test. We also used an independent-samples t-test to verify the agreement of residuals between HIV-infected and non-infected, both in cross-validation group and in all population. One-way analysis of variance (ANOVA), with post-hoc pairwise comparisons made using the method of Scheffe (equal variances) or Dunnett's T3 (unequal variances), was used in cross-validation group and in all population to verify the agreement of residuals between races. Statistical technique of Bland-Altman (23)
was used to access the degree of agreement between the BCM measured and the predicted by the model. This method concentrates on individual differences, normalizes the distribution of the sample, decreases its variation and calculates bias and 95% limits of agreement between BCM measured and BCM predicted by the new model. The precision of the predictive equations in the model-development group was determined using the estimated true standard error of the estimate (SEE). To measure the performance of the predictive equations on cross-validation group, the pure error (PE) between the BCM and the predictive model was calculated. The level of significance for all statistical tests was p<0.05. All statistical analysis were performed by using SPSS (version 11.5, SPSS Inc, Chicago).
Results
The descriptive characteristics of the 1379 subjects are summarized in Table 1, by gender and health status, including race, age, height, weight, body mass index (BMI), BCM and Log10 BCM. Males ranged in age from 18 to 67 years, in height from 154.7 to 198.4 cm and in weight from 44.4 to 104.4 kg. Females ranged in age from 18 to 66 years, in height from 142.3 to 183.0 cm and in weight from 32.2 to 103.8 kg. BCM (kg) was, in mean, 33.1+5.48 for males and 22.0±3.48 for females in the entire
sample. In the model-development group males had a mean BCM of 32.7±5.47 and females 22.1+3.52, very seemlier to the 33.9±5.43 and 21.7±3.37 of the cross-validation group. The highest difference found was in the weight of females between the model-development group and the cross-validation group. Females in the first group have more 1.7 kg, in average, than the ones from the second one. Males in the cross-validation group have more 1.33 cm and 1.2 kg, in average, than those from the model-development group. 41.1% of males were HIV-infected individuals, once females were only 16.5% of the entire sample. The female gender had more
HIV-infected subjects, from Black race, while the majority of HIV-infected males were Caucasians. The races Asians and Others didn't have any subject HIV-infected.
Table 1.
Entire sample
Males Females
(/7=747) (n=632)
Healthy HIV-infected Healthy HIV-infected Variables (/1=440) (0=307) (/7=528) (/7=104) Races Caucasjan'(/7=614) 158 207 228 21 Black V=294) 84 61 89 60 Hispanic'(/7=237) 94 39 81 23 Asian'(/7=210) 90 - 120 -OthereV=24) 14 - 10 -Age2 41.2113.70 40.2±8.26 42.4113.88 38.917.67 Height (cm)2 173.8±7.14 176.116.06 161.816.77 162.216.64 Weight (kg)2 74.1110.43 66.8110.67 61.2110.46 58.4+13.50 BMI(kg/m2)2 24.5±2.89 21.5+3.26 23.4+3.85 22.214.90 BCM (kg)2 34.5±5.02 31.115.51 22.113.40 21.413.84 LoglOBCM2 1.531.0.064 1.4910.077 1.3410.066 1.3210.079
Values are 'n and ^means 1 SD; BMI - body mass index; BCM ■ body cell mass; Log10 BCM -base 10 logarithm of bo dy cell mass
8 Body cell mass by anthropometric measures: A predictive model for healthy and HIV-infected adults
Development of the Predictive Model for Estimating BCM. Using Log 10 of the
initial 20 anthropometric sites, body weight and height as independent variables and Log10 of BCM as dependent variable, we derived a backward multiple regression for each gender, and the most significant predictive variables found are presented in Table 2. Using these variables, we did a stepwise multiple regression to derive the new model. The new equations, their variables and coefficients, their p values of entrance in the model and the results of all the validation tests, are presented in
Table 2.
Variables most significant for the prediction after backward multiple regression*, and after stepwise multiple regression2
Predictive Variables Males Females Equation Equation Log10 Height (cm) Log10 Weight (kg) V V Log10AL(mm) Log10CA(mm) V Log10CR(mm) X Log10UCC(mm) X X Log10CC(mm) X Log10CW(mm) V X LoglOCIC(mm) X V LoglOTL(mm) LoglOCT(mm) X LoglOCFC (mm) X X LoglOTRI(mm) X LoglOBIC(mm) V LoglOSCP(mm) V LoglOCST(mm) V LoglOUI(mm) X LoglOTHR(mm) LoglOUMB(mm) LoglOABD(mm) V LoglOTHI(mm) X LoglOCF(mm) V
X are variables selected by backward multiple regression and *V are variables selected by backward and stepwise multiple regression; Log10 - base 10 logarithm; AL - arm length; CA - upper arm circumference; CR - wrist circumference; UCC - upper chest circumference; CC - chest circumference; CW - waist circumference; CIC - iliac crest circumference; TL - thigh length; CT - thigh circumference; CFC - caff circumference; TRI - triceps
Table 3. The SEE indicates the precision of these two equations that were 1.08 kg (3.29%) for males and for females 1.10 kg (4.98%). Graphic representations of the regressions were plotted and presented in Figure 1 and Figure 2, for males and for females respectively.
SEE (kg) PE (kg) Group r r-test
Males equation 0.805 1.08(3.29%) 1.09(3.22%) 0.724 0.814 T
Log10 BCM (kg) = 0.660*+ Log10 Weight (kg) x 1.110* + Log10 CA (mm) x 0.380* - Log10 CW (mm) x 0.690* - Log10 ABD (mm) x 0.064*- Log10 CF (mm) x 0.050*
Females equation 0.618 1.10(4.98%) 1.10(5.06%) 0.642 0.715 T
Log10 BCM (kg) = 1.886* + Log10 Weight (kg) x 1.177 *- Log10 CIC (mm) x 0.842*- Log10 BIC (mm) x 0.055* - Log10 SCP (mm) x 0.053* - Log10 CST (mm) x 0.036*
*p < 0.001 ; * Values are p; SEE - standard error of the estimate; PE - pure error; CA - arm circumference; CW - waist circumference; CIC - iliac crest circumference; BIC - biceps skinfold; SCP - subscapular skinfold; CST - chest skinfold; ABD - abdominal skinfold; CF - calf skinfold;
1.8 1.7 V m F >> n 1.6 y — » ? S 1.5 Ci CO o 1.4 CD O 1.3 1.2 J r2 = 0.805 SEE = 1.08 kg (3.29%) P < 0.001 \2 1.3 1.4 1.5 1.6 1.7 1.8 Log10 B C M (kg) by equation
Figure 1. Plot of the males regression in model-development group. Log 10 BCM (kg) predicted by total
body potassium (TBK) measured by whole-body WK
counting on the ordinate and Log 10 BCM calculated with the new equation on the abscissa.
10 Body cell mass by anthropometric measures: A predictive model for healthy and HIV-infected adults 1.6 m 1.5 m h->» -Q
S
1.4 *—* 2 O CU 13 o Tn> _ o M 1.1 ^ = 0.618 SEE = 1.10 kg (4.98%) P< 0.001 i 1 1 1 1 1 1.1 1.2 1.3 1.4 1.5 1.6 Log10 BCM (kg) by equationFigure 2. Plot of the females regression in
model-development group. Log 10 BCM (kg) predicted by total
body potassium (TBK) measured by whole-body 40K
counting on the ordinate and Log 10 BCM calculated with the new equation on the abscissa.
Cross-validation of the New Predictive Model. The new equations derived from
the model-development group were, then, applied to the cross-validation group. The
r2 in this group for the males equation was 0.724, and for females was 0.642. The
accuracy is indicated by the PE, and was 1.09 kg (3.22%) for males and 1.10 kg (5.06%) for females. We also did a Student's paired f-test, to check the mean bias of the model, that was p = 0.814 for males and a p = 0.715 for females.
Comparison of the New Model with the Measured BCM. The agreement
between the measured and predicted values of BCM was determined by the Bland and Altman technique {23). We calculated the mean from the two methods and their
well as the graphic representations of the equations, were plotted in graphs, Figure 3 for males (/^=0.040), and Figure 4 for females (/^=0.140). The antilog limits of agreement were, for males ± 1.17 kg (3.45%), and for females ± 1.20 kg (5.53%).
m h-—. o -^ ro 5 2* CD JT o -^ V O) O *-" c O
I?
0 -1 £ (D 0.15 0.10 0.05 0.00 -0.05 -0.10 -0.15 J -1.96SD -0.07 r2 = 0.040 P = 0.002 1.2 1.3 1.4 1.5 1.6 1.7 1.8 Mean of Log10 BCM (kg) by TBKand Log10 BCM (kg) by equation Figure 3. Bland-Altman analysis (25) in males of the
cross-validation group. The difference between Log 10 BCM (kg) predicted by total body potassium (TBK) measured by whole-body
K counting and Log 10 BCM calculated with the new equation plotted against their mean. The 95% CI is indicated by the upper and lower lines.
12 Body cell mass by anthropometric measures: A predictive model for healthy and HIV-infected adults CD. h->. .o c — 2 o <-* Q 0.15 1 0.10 0.05 0.00 C O | ? -0.05 V CO X) o 0 ) -1 g "O -0.10 ■ 0) (0 Q -0.15 J 1.1 <? = 0.140 P< 0.001 1.2 1.3 1.4 1.5 1.6 Mean of Log10 BCM (kg) by TBK and Log10 BCM (kg) by equation Figure 4. Bland-Altman analysis (25) in females of the
cross-validation group. The difference between Log 10 BCM (kg) predicted by total body potassium (TBK) measured by whole-body
°K counting and Log 10 BCM calculated with the new equation plotted against their mean. The 95% CI is indicated by the upper and lower lines.
Agreement Between Races and Health Status. In the test of agreement
between different health status we found a p>0.05 for males and for females both in cross-validation group and in the entire sample. The difference of residuals between all races, estimated by one-way ANOVA, were all p>0.05 for both genders in the two samples, cross-validation group and the entire population.
Discussion
The purpose of this study was to develop predictive equations for BCM by using anthropometric measures for application in HIV-infected and healthy people.
Our model is, as long as we know, the first one that predicts BCM using skinfolds and body circumferences combined with other anthropometric measures, as body weight.
In 1980, Bruce et al also derived a predictive model for BCM, but they used only age, height and weight as predictive variables (24). However, height didn't enter
with statistical meaning in our model, once the p values for height were 0.250 in males and 0.639 in females (data not shown). Age was, also, not included in the independent variables list. Although the important effect of age in BCM (17,25), we
decide not to use it in the model, based in the fact that in many countries, the information on age of individuals is not easy or even impossible to obtain and many times, when accessed, the data are incorrect, and the reliability of the model could be compromised.
BCM is the human body compartment metabolically active. It is composed by the tissues that are modified under the influence of physical activity, nutrition or disease, and BCM may be used as a biomarker of these processes i22'26,27*. BCM
prediction is based on the assumption that intracellular potassium concentration reflects BCM, and is a constant value (171 mmol/kg H20)(20). Thus TBK is the more
sensitive and reliable indicator of changes in BCM (28,29). But, at the same time, TBK
is also a very expensive method only available in some of the most sophisticated research centers. The accurate assessment of BCM has a considerable clinical relevance, since the relation of the amount of BCM with immobility, morbidity and mortality (30,31). Therefore, the deep gap in availability of a practical tool to access to
BCM should be of great concern.
Although clinical manifestations may vary considerably (8), poor dietary intake (32), intestinal malabsorption (33,34) and hypermetabolism at concomitantly reduced
l i Body cell mass by anthropometric measures: A predictive mode) for healthy and HIV-infected adults
substrate disposal (35) are some of the reasons of weight loss, PEM, and the
consequent BCM depletion, often found in patients with HIV (2'38). Frequently, these
massive tissue wasting states occur in early, asymptomatic HIV-infected patients (2/l5),
even in the absence of weight loss(6), and the depletion severity may be larger than it
appears clinically(2). Consequently, the loss of muscle and perhaps organ tissue may
remain unnoticed, unless new and practical methods for assessing BCM, as the one presented in this study, are developed.
As it occurs in AIDS, severe malnutrition and BCM depletion contributes to the general debilitation and associated dependency in patients with other chronic diseases as cancer ^-8^. The wasting status in those chronic diseases is
associated with adverse clinical outcomes (8), including risk of death <3'8-10\
development of new disease complications and diminished quality of life (10'37).
Sometimes the specific clinical squeal of BCM depletion may be independent of the outcomes (8'36). Therefore, the magnitude of BCM depletion, influences the course of
the terminal phase of the disease (2), is related with the timing of death in AIDS (3), and
strongly predicts patients survival (8). As a result, BCM is considered of key
importance in clinical nutrition (3,8'36), because survival can be expanded with
successful efforts to maintain BCM (3), and it is an important prognostic determinant of
clinical outcomes(8).
The SEE and PE of our new equations were respectively, 1.08 kg (3.29%) and 1.09 kg (3.22%) for males, and 1.10 kg (4.98%) and 1.10 kg (5.06%) for females, showing a great precision as well as a good performance of the model. The SEE, which is the average expected error, of the model-development group, was similar to the PE of the cross-validation group in both genders, so the accuracy of the method
in both groups can be considered the same. Therefore, in a practical approach, this model may be considered very useful for the prediction of BCM in HIV-infected and healthy subjects.
Despite the great precision, performance and usefulness of this model, the PE and SEE were both, almost, 2% higher in females. These differences in the prediction may take place because of the great influence performed by the sex hormones in determining normal body composition. Boys and girls have nearly the same body composition until pubertal age where, the increase in body cell mass and skeletal muscle mass is greater in boys, and girls start to accumulate fat more rapidly (38).
Therefore, disproportionate depletion of body cell mass and skeletal muscle mass is expected in men with reduced testosterone, as well as decreased estrogen and progesterone results in predominant fat loss in women (10). In a pragmatic analysis,
the higher buildup of fat in females will reduce the capability to access to body cell mass reflected in the superior PE and SEE in the perdition model for this gender.
Validation studies were performed both in the cross-validation group and in the entire population. The model had no statistical differences when applied to individuals of different races and of different health status, since the validation tests were all p>0.05. These results express the applicability of our model, with the same reliability in all studied individuals, despite the differences in body composition reported before (7,10,15,39-11) between distinct races and between healthy and HIV-infected individuals.
After analyzing the results of the Student's paired t-test, p>0.05 for both genders, we concluded that there was no statistical significance within the BCM measured and the predicted, so there was no mean bias for the new predictive model.
16 Body cell mass by anthropometric measures: A predictive model for healthy and HIV-infected adults
The Bland-Altman technique was used because the comparison of measurement methods is not considered appropriate only by using correlation coefficients or regression analysis (23-42). By this technique, and as achieved by the
t-test, there was no mean bias, but by the limits of agreement we can conclude that in both genders, 95% of the predictions could have variations of ± 1.17 kg (3.45%) for males and, for females ± 1.20 kg (5.53%), with statistical meaning (males p=0.002 and females p<0.001). The graphs show that, the model has a systematically tendency to overestimate BCM in individuals with lower BCM by TBK and, to underestimate BCM in individuals with higher BCM by TBK. This occurs in both genders but in higher proportions in females (/^=0.140), than in males (/^=0.040).
A great number of studies using a variety of methods, had documented the loss of BCM, fat-free mass (FFM), appendicular skeletal muscle mass (ASMM) as well as a reduction in TBK, with aging after 40 years i29'43"48*. This phenomenon
appears to happen as part of normal aging, despite the relatively healthy status of individuals or the considerable activity reported by the subjects (45,46). Moreover, BCM
and TBK changes are greater than the changes in FFM and ASMM and greater in subjects >60 years (45). Increased morbidity and mortality, and lower quality of life are
prevalent in the elderly and are strongly associated with sarcopenia (49^1). Guo et al,
considered that weight and BMI alone are not adequate guides of evaluating changes in body composition in aging (52). Hence, the assessment and quantification of BCM is
particularly important in clinical management programs and epidemiological and clinical studies of aging t13-45'52'. Our model can be applied to elderly subjects until 67
years, which is the upper limit of age of our sample. Although, further studies with larger numbers of elderly subjects are needed for cross-validation purposes.
Malnutrition can be present in obese subjects and masked by the abnormal amount of fat mass. As reflected by low body cell mass index, BMI fails to detect altered nutritional state in the presence of overweight or obesity(53). De Lorenzo et al
concluded, in a recent study, that obese people had a greater BCM than non-obese. For this reason, and in order to preserve BCM in weight loss, is very important to assess to BCM in obese individuals to select the type of regimen to be used in clinical nutrition(54). Since, 28.4% of the sample in the present study has a BMI > 25 (data not
shown), our model could be very useful for assessing BCM in obese individuals. Since our model is based in anthropometry, it has its advantages. It's portable, noninvasive, inexpensive and of worldwide access. Anthropometry is useful in field studies, has a substantial literature available and remains the most widely used method.
Although, anthropometric techniques are very uncertain in how closely the measurement actually reflects the desired compartment. Other disadvantages of this method are considerable care and training required to anthropometrists, to produce consistent results and the lack of standardization in methodology. Data interpretation is also a problem, once multiple factors as total body fat, gender, age, and race, affect anthropometric measures. These factors may complicate data interpretation, but our large database helped us to overcome this obstacle, by close matching of the subjects. Our model is limited in cases of edema or other diseases than HIV, thus further studies regarding this parameters should be carried out.
18 Body cell mass by anthropometric measures: A predictive model for healthy and HIV-infected adults
Conclusions
In summary, this model is an innovatory technique for BCM prediction. The great precision and accuracy revealed by these new equations, allied to the fact of being based in portable, inexpensive, and practical tools, gives to this model a worldwide accessibility. From now on, all physicians, nutritionists and investigators are allowed to accomplish the measurement of BCM, until now restricted to very sophisticated laboratories, and use it, not only in the research field, but also in the clinical observation of BCM depletion in a great variety of situations, including HIV-infected patients, loss weight in obesity, elderly sarcopenia as well as follow-up in healthy individuals. Further validation studies are needed in patients with other diseases.
References
1. Kotler DP, Rosenbaum K, Allison DB, Wang J, Pierson RN Jr. Validation of bioimpedance analysis as a measure of change in body cell mass as estimated by whole-body counting of potassium in adults. Journal of Parental and Enteral Nutrition 1999;23:345-9.
2. Kotler DP, Wang J, Pierson RN Jr. Body composition studies in patients with the acquired immunodeficiency syndrome. Am J Clin Nutr 1985;42:1255-65.
3. Kotler DP, Tierney AR, Wang J, Pierson RN Jr. Magnitude of body-cell-mass depletion and the timing of death from wasting in AIDS. Am J Clin Nutr 1989;50:444-7.
4. Kotler DP, Tierney AR, Ferrara R, et al. Enteral alimentation and repletion of body cell mass in malnourished patients with acquired immunodeficiency syndrome. Am J Clin Nutr 1991;53:149-54.
5. Wang J, Kotler DP, Russell M, Burastero S, Mazariegos M, Thornton J, Dilmanian FA, Pierson RN Jr. Body-fat measurement in patients with acquired immunodeficiency syndrome: which method should be used?. Am J Clin Nutr 1992;56:963-7.
6. Ott M, Lembcke B, Fischer H, Jager R, Polat H, Geier H, Rech M, Staszeswki S, Helm EB, Caspary WF. Early changes of body composition in human immunodeficiency virus-infected patients: tetrapolar body impedance analysis indicates significant malnutrition. Am J Clin Nutr 1993;57:15-9.
7. Kotler DP, Rosenbaum K, Wang J, Pierson RN Jr. Studies of body composition and fat distribution in HIV-infected and control subjects. J Acquir Immune Defic SyndrHum Retroviral 1999;20:228-37.
8. Siittmann U, Ockenga J, Selberg O, Hoogestraat L, Deicher H, Muller MJ. Incidence and prognostic value of malnutrition and wasting in human immunodeficiency virus-infected outpatients. J Acquir Immune Defic Syndr Hum Retroviral 1995;8:239-46.
9. Palenicek JP, Graham NM, He YD, Hoover DA, Oishi JS, Kingsley L, Saah AJ. Weight loss prior to clinical AIDS as a predictor of survival. Multicenter AIDS Cohort Study Investigators. J Acquir Immune Defic Syndr Hum Retroviral 1995;10:366-73.
10. Kotler DP, Thea DM, Heo M, AllisonDB, Engelson ES, Wang J, Pierson RN Jr, St Louis M, Keusch GT. Relative influences of sex, race, environment, and HIV infection on body composition in adults. Am J Clin Nutr 1999;69:432-9.
20 Body cell mass by anthropometric measures: A predictive model for healthy and HIV-infected adults
11. Heymsfield SB, Bethel RA, Ansley JD, Nixon DW, Rudman D. Enteral hyperalimentation: an alternative to central venous hyperalimentation. Ann Intern Med 1979;90:63-71.
12. Moore FD, Olesen KH, McMurray JD, Parker HV, Ball MR, Boyden CM. The body cell mass and its supporting environment. Philadelphia: WB Saunders, 1963. 13. Lukaski HC. Methods for the assessment of human body composition: Traditional
and new. Am J Clin Nutr 1984;46:537-56.
14.Cocran C, Anderson EJ, Burrows B, Stanley T, Walsh M, Poulos AM, Grinspoon S. Comparison of total body potassium with other techniques for measuring lean body mass in men and women with AIDS wasting. Am J Clin Nutr 2000;72:1053-8. 15Kotler DP, Burastero S, Wang J, Pierson RN Jr. Prediction of body cell mass,
fat-free mass and total body water with bioelectrical impedance analysis: effects of race, sex, and disease. Am J Clin Nutr 1996;64:489S-97S.
16.Dittmar M, Reber H. New equations for estimating body cell mass from bioimpedance parallel models in healthy older germans. Am J Physiol Endocrinol Metab 2001 ;281:E1005-14.
17. Pierson RN Jr, Lin DHY, Phillips RA. Total-body potassium in health: effects of age, sex, height, and fat. Am J Physiol 1974;226:206-12.
18. Pierson RN Jr, Wang J, Thornton J, Van Itallie TB, Colt EWD. Body potassium by four-pi ^ K counting: an anthropometric correction. Am J Physiol 1984;246:F234-9. 19. Gallagher D, Belmonte D, Deurenberg P, et al. Organ-tissue mass measurement
allows modeling of REE and metabolically active tissue mass. Am J Physiol 1996;275:E249-58.
20. Wang Z, St-Onge MP, Lecumberri B, Pi-Sunyer FX, Heshka S, Wang J, Kotler DP, Gallagher D, Wielopolski L, Pierson RN Jr, Heymsfield SB. Body cell mass: model development and validation at the cellular level of body composition. Am J Physiol Endocrinol Metab 2004;286:E 123-8.
21.Lohman T, Martorelli R, Roche AF. Anthropometric standardization reference manual: the Airlie consensus report. Chicago: Human Kinetics, 1988.
22. Wang J, Thornton J, Kolesnik S, Pierson RN Jr. Anthropometry in body composition: an overview. Annals of The New York Academy of Sciences 2000;904:317-26.
23. Bland JM, Altman DG. Statistical methods for assessing agreement between two methods of clinical measurement. Lancet 1986;1:307-10.
24. Bruce A, Andersson B, Arvidsson B, Isaksson B. Body composition. Prediction of normal body potassium, body water and body fat in adults on the basis of body height, body weight and age. Scand J Clin Lab Invest 1980;40:461-73.
25. Kotler DP, Thea DM, Allison DB, Wang J, St Louis M, Keusch GT, Pierson RN Jr. Relative and interacting effects of sex, race, and environment upon body cell mass in healthy adults. Am J Hum Biol 1998;10:259-68.
26. Buchholz AC, Me Gillivray CF, Pencharz PB. Differences in resting metabolic rate between paraplegic and able-bodied subjects explained by differences in body composition. Am J Clin Nutr 2003;77:371-78.
27. Forbes GB. Human body composition, growth, aging, nutrition, and activity. New York: Springer-Verlag, 1987.
28. Conn SH, Vartsky D, Yasumura S, Vaswani AN. Indexes of body cell mass: nitrogen versus potassium. Am J Physiol 1983;244:E305-10.
22 Body cell mass by anthropometric measures: A predictive model for healthy and HIV-infected adults
29.Cohn SH, Ellis KJ, Vartsky D, et al. Comparsion of methods estimating body fat in normal subjects and cancer patients. . Am J Clin Nutr 1981;34:2839-47.
30. Roche AF. Sarcopenia: a critical review of its measurements and health-related significance in the middle-aged elderly. Am J Hum Biol 1994;6:33-42.
31Shizgal HM. Body composition of patients with malnutrition and cancer. Summary of methods of assessment. Cancer 1985;55:250-3.
32. Kotler DP, Tierney AR, Brenner SK Preservation of short-term energy balance in clinically stable patients with AIDS. Am J Clin Nutr 1990;51:7-13.
33. Ullrich R, Zeitz M, Heise W, L'age M, Hõffken G, Riecken EO. Small intestinal structure and function in patients infected with human immunodeficiency virusw (HIV): evidence for HIV-induced enteropathy. Ann Inter Med 1989,111:15-21.
34. Kotler DP, Francisco A, Clayton F, Scholes JV, Orenstein JM. Small intestinal injury and parasitic diseases in AIDS. Ann Inter Med 1990; 113:444-9.
35. Melchior JC, Salmon D, Rigaud D, et al. Resting energy expenditure is increased in stable, malnourished HIV-infected patients. Am J Clin Nutr 1991;53:437-41. 36. Heymsfield SB, McManus C, Stevens V, Smith J. Muscle mass: reliable indicator
of protein-energy malnutrition severity and outcome. Am J Clin Nutr 1982;35:1192-99.
37.Turner J, Murrahainen N, Terrell C, Graeber C, Kotler DP. Nutritional status and quality of life. Int Conf AIDS 1994;10:35A (abstr).
38. Wheeler MD. Physical changes of puberty. Endocrinol Metab Clin North Am
39.Gasparino JA, Wang J, Pierson RN Jr, Heymsfield SB. Age-related changes in musculoskeletal mass between black and white women. Metabolism 1995;44:30-4.
40. Wang J, Thornton JC, Russell M, Burastero S, Heymsfield SB, Pierson RN Jr. Asians have lower body mass index (BMI) but higher percent body fat than do whites: Comparsions of anthropometric measures. Am J Clin Nutr 1994;60:23-8. 41. Wang J, Thornton JC, Burastero S, Heymsfield SB, Pierson RN Jr. Bioimpedance
analysis for estimation of total body potassium, total body water, and fat-free mass in White, Black, and Asian adults. Am J Hum Biol 1994;7:33-40.
42. Williams CA, Bale P. Bias and limits of agreement between hydrodensitometry, bioelectrical impedance and skinfold callipers measures of percentage body fat. Eur J Appl Physiol 1998;77:271-7.
43. Baumgartner RN, Stauber PM, McHugh D, Koehler KM, Garry PJ. Cross-sectional age differences in body composition in persons 60+ years of age. J Gerontol 1995;50A:M307-16.
44. Gallagher D, Visser M, Wang Z, Harris T, Pierson RN Jr, Heymsfield SB. Metabolically active component of fat-free body mass: influences of age, adiposity and gender. Metabolism 1996;45:992-7.
45. Kyle UG, Genton L, Hans D, Karsegard L, Slosman DO, Pichard C. Original Comunication. Age-related differences in fat-free mass, skeletal muscle, body cell mass and fat mass between 18 and 94 years. Eur J Clin Nutr 2001 ;55:663-72. 46. Flynn MA, Nolph GB, Baker AS, Martin WM, Krause G. Total body potassium in
24 Body cell mass by anthropometric measures: A predictive model for healthy and HIV-infected adults
47. Baumgartner RN, Ross R, Heymsfield SB. Does adipose tissue influence bioelectrical impedance in obese men and women? J Appl Physiol 1998;84:257-62.
48. Conn SH, Vaswani AN, Yasumura S, Yuen K, Ellis KJ. Assessment of cellular mass and lean body mass non-invasive nuclear techniques. J Lab Clin Med 1985;105:305-11.
49. Baumgartner RN, Koehler KM, Gallagher D, Romero L, Heymsfield SB, Ross RR
et al. Epidemiology of sarcopenia among the elderly in New Mexico. Am J
Epidemiol 1998;147:755-63.
50. Kehayias JJ, Fiatarone MA, Zhuang H, Roubenoff R. Total body potassium and body fat: relevance to aging. Am J Clin Nutr 1997;66: 904-10.
51. Roubenoff R. Sarcopenia and its implications for the elderly. Eur J Clin Nutr 2000;54(Suppl 3):S40-7.
52.Guo SS, Zeller C, Chumlea WC, Siervogel RM. Aging, body composition, and life style: the Fels Longitudinal Study. Am J Clin Nutr 1999;70:405-11.
53.Talluri A, Liedtke R, Mohamed El, Maiolo C, Martinoli R, De Lorenzo A. The application of body cell mass index for studying muscle mass changes in health and disease conditions. Acta Diabetol. 2003;40 Suppl:S286-9.
54. De Lorenzo A, Andreoli A, Seerano P, D'Orazio N, Cervelli V, Volpe SL. Body cell mass measured by total body potassium in normal-weight and obese men and women. J Am Coll Nutr. 2003;22:546-9.