www.jped.com.br
ORIGINAL
ARTICLE
Factors
associated
with
low
consumption
of
fruits
and
vegetables
by
preschoolers
of
low
socio-economic
level
夽
,
夽夽
Julia
L.
Valmórbida
a,∗,
Márcia
R.
Vitolo
baCenterforResearchinNutrition,UniversidadeFederaldeCiênciasdaSaúdedePortoAlegre(UFCSPA),PortoAlegre,RS,Brazil bDepartmentofNutrition,UniversidadeFederaldeCiênciasdaSaúdedePortoAlegre(UFCSPA),PortoAlegre,RS,Brazil
Received8October2013;accepted19February2014 Availableonline20March2014
KEYWORDS
Preschooler; Foodconsumption; Fruits;
Vegetables
Abstract
Objective: Toevaluatefactorsassociatedwithlowconsumptionoffruitsandvegetablesamong preschoolersfromfamiliestreatedatbasichealthcentersinPortoAlegre,RS,Brazil. Methods: Thiswasacohortstudynestedinarandomizedfieldtrial.Datacollectionwas per-formedthroughstructuredquestionnairestoobtaindemographicanddietarydata,combined withtwo24-hourrecallsintheagegroups12---16monthsandagainat2---3yearsofage.Data ontheconsumptionofonedailyservingoffruits(80g)andvegetables(60g)wereevaluated, aswellasconsumptionofnon-recommendedfoodssuchascandy,chocolate,andsoftdrinks. StatisticalanalyseswereperformedusingPoissonregressionwithrobustestimation.
Results: Atotalof388childrenaged2-3yearswereevaluated;ofthese,58%and87.4%didnot consumeonedailyservingoffruitsandvegetables,respectively.Thefollowingfactorswere negativelyassociatedwithfruitconsumption:familyincomehigherthanfourminimumwages, (p=0.024),lowerpaternaleducationallevel(p=0.03),andlowerfruitconsumptionat12---16 months (p=0.002).Factorsnegatively associated withthe consumption ofvegetables were lowpaternaleducationallevel(p=0.033)andconsumptionofhigh-sugarcontentbeveragesat 12---16months(p=0.014).
Conclusion: Thisstudydemonstratedahighprevalenceofchildrenwhoconsumedlessthanone dailyservingoffruitandvegetables;earlyfeedingpractices,parentaleducation,andfamily incomewereassociatedwiththisprocess.
©2014SociedadeBrasileiradePediatria.PublishedbyElsevierEditoraLtda.Allrightsreserved.
夽
Pleasecitethisarticleas:ValmórbidaJL,VitoloMR.Factorsassociatedwithlowconsumptionoffruitsandvegetablesbypreschoolers oflowsocio-economiclevel.JPediatr(RioJ).2014;90:464---71.
夽夽StudyconductedattheNúcleodePesquisaemNutric¸ão(NUPEN)oftheUniversidadeFederaldeCiênciasdaSaúdedePortoAlegre
(UFCSPA).
∗Correspondingauthor.
E-mail:[email protected](J.L.Valmórbida).
http://dx.doi.org/10.1016/j.jped.2014.02.002
PALAVRAS-CHAVE
Pré-escolar; Consumode alimentos; Frutas; Verduras
Fatoresassociadosaobaixoconsumodefrutaseverdurasentrepré-escolaresde baixonívelsocioeconômico
Resumo
Objetivo: Avaliar os fatores associados ao baixo consumo de frutas e verduras entre pré-escolaresdefamíliasusuáriasdaredebásicadesaúdedePortoAlegre,RS,Brasil.
Métodos: Estudodecoorteaninhadoaensaiodecamporandomizado.Acoletadedadosfoifeita pormeiodequestionáriosestruturadosparaobtenc¸ãodedadosdietéticosesociodemográficos, alémdedoisrecordatóriosde24horasnasfaixasetáriasde12---16mesesenovamenteaos2-3 anosdeidade. Foramavaliadososdadosde consumodeuma porc¸ãodiáriade frutas(80g) everduras(60g),alémdeconsumodealimentosnãorecomendados,comobalas,chocolates erefrigerantes.AsanálisesestatísticasforamfeitasporregressãodePoissoncomestimativa robusta.
Resultados: Foramavaliadas388 crianc¸asde2-3anos, destas58%e 87,4%não consumiram umaporc¸ãodefrutaseverduras,respectivamente.Osfatoresquesemostraramnegativamente associadosaoconsumodefrutasforam:rendafamiliarsuperiora4saláriosmínimos,(p=0,024), menorescolaridadepaterna(p=0,03)emenorconsumodefrutasaos12---16meses(p=0,002). Osfatoresnegativamenteassociadosàingestãodeverdurasforamamenorescolaridadepaterna (p=0,033)econsumoderefrigeranteaos12---16meses(p=0.014).
Conclusão: Osresultadosdesteestudomostraramaltaprevalênciadecrianc¸asqueconsumiram menosdeumaporc¸ãodefrutaseverdurasaodiaesugeremquepráticasalimentaresprecoces, escolaridadepaternaerendaestãoassociadasaesseprocesso.
©2014SociedadeBrasileiradePediatria.PublicadoporElsevierEditoraLtda.Todososdireitos reservados.
Introduction
Feedinghabitsintheearlyphaseoflifeplaysafundamental roleinchildren’sgrowthanddevelopment;1anappropriate
introductionofsolidfoodsisextremelyimportant,asitcan affectthefutureacceptanceoffoods.2Amongthepolicies
onfoodandnutrition,encouragingtheconsumptionoffruits andvegetablesstandsoutamongtheguidelinestopromote healthyeatinghabits,3,4 sincean insufficientconsumption
of these groups was considered one of the main factors responsiblefortheglobalburdenofdiseasesworldwide.5
Preschoolersarecharacterizedbyhavinghigher micronu-trientrequirementswhencomparedtotheirenergyneeds.6
This aspect, combinedwiththe evidence that their diets containhighlevelsofsaturatedfatandsugarandarelow in dietaryfiber,6,7 makesthisage groupvulnerable tothe
developmentofobesityandmicronutrientdeficiency.6
Fur-thermore, it has been demonstrated that children prefer foods with higher energy density, mainly by the positive physiologicalconsequencesthattheyprovideinrelationto satietyandenergyinput,8whichmayaffecttheconsumption
ofvegetablesandfruits.
Given theaforementioned evidencethatthequalityof food consumed by children is essential for health promo-tionandpreventionofchronicdiseases,thisstudyaimedto evaluate theconsumption of fruits and vegetablesamong preschoolersoflowsocioeconomicstatusandthematernal andfamilyfactorsinvolvedinthisprocess.
Method
Thiswasacohortstudynestedinarandomizedfieldtrial, performed between April of 2008 and May of 2012, with
mothersandchildrenfollowedfromtheagesof6monthsto 2-3years.Therecruitmentphaseoccurredduringthethird trimesterof pregnancyat health centersin theeight dis-trictareasofthecity ofPortoAlegre, stateofRioGrande doSul,Brazil.Duringallstudyphases,thedatacollection teamconsistedofapproximately20members(nutritionists andnutrition students) whowere previously trained. The teams were divided according to the district region, and thecollectionwasalwaysperformed byatleasttwoteam members.
Thesamplesizeconsideredtheobjectiveofthe random-ized field trial, in which an intervention performed with primary health care professionals would increase breast-feedingrates.Theinterventionconsistedinanupdateofthe ‘‘Tenstepstohealthyeatingforchildrenyoungerthantwo years’’3guideforallprofessionalsworkingintheselected
healthcenters,inadditiontoprovidingeducational materi-alsbasedonthefoodguide,tobedeliveredtoallmothers undergoingprenatalandchildcare.Apowerof90%, confi-dence level of 95%, and a cluster correlation coefficient of1.5were consideredfor sample sizecalculation, which determinedtheinclusionof300mother-infantpairsineach group.Consideringapredictionoflossof20%,the recruit-mentof720individualswasestimatedinordertoreachthe desiredsamplesize.
study,sincebreastfeedingis contraindicatedin this situa-tion.
Subsequent phases of data collection were performed throughhome visitstothechildren whenagedbetween6 and9months,12and16months,and2to3 years. Struc-turedquestionnairesandtwo24-hourrecallswereappliedat eachstagewiththemothersorprimarycaregiver.The stan-dardized24-hourrecallswereconductedforanyweekdayor weekend,andwerenotperformedonconsecutivedaysfor thesamechild.Nutrientcalculationswereperformedusing theDietwin Professional®software (PortoAlegre, Brazil), which is mainly based onthe Brazilian Food Composition Table9andusedtheaverageoftwodays.
The socio-demographic data were obtained at recruit-mentandwerenotrepeatedattheotherphases.
Datacollection:6---9months
Datarelatedtoexclusivebreastfeedingwereobtained.
Datacollection:12---16months
Theconsumptionoffruitsandvegetablesintheagegroup of12to16monthswasassessedthroughaspecific question-naire,whichcontainedquestionsregardingtheconsumption offruitsandvegetablesinthepreviousweek.
The frequency offruits andvegetablesconsumption at thisagegroupwascalculatedbasedontheanswersofthe mothersorprimarycaregiverstothequestions:‘‘Howoften inthelastweekdidyourchildconsumedfruit?’’and‘‘How ofteninthelastweekdidyourchildconsumevegetables?’’. The energy percentage from non-recommended foods wascalculated fromthe 24-hour recall. According tothe Brazilian Ministry of Health,3 the following foods arenot
recommendedfor consumption by children under2 years ofage:candies,lollipops,chocolates,cookies, jello,petit suissecheese,chocolatemilk,sausages,snacks,softdrinks, artificialjuices,andfoodswithaddedsugar.
While they answered the questionnaire, mothers also reportedwhethertheirchildren hadconsumedthe above-mentioned foods in the previous month. This information wasusedtoclassifythechildrenaccordingtothe consump-tionof non-recommendfoods intotwogroups: those who had consumed fewer than four and those who had con-sumedfourtypesor more.The consumptionofsoftdrinks and artificial juices was not considered in this group, as thisinformationledtothecreationof anadditionalgroup relatedtotheconsumptionofsugarydrinks.
Datacollection:2---3years
An anthropometric assessment of the mother, including weight and height measurements to calculate body mass index(BMI),wasperformed.Maternalnutritionalstatuswas consideredadequatewhenBMI<25kg/m2,andoverweight
when ≥ 25kg/m2, according to the classification of the WorldHealthOrganization.5
Dietary variables related to consumption of fruits and vegetables at this age group were calculated using data from24-hourrecalls.The amount (ingrams)of fruitsand
vegetablesconsumed wasverified,and itwasthen inves-tigated whether at least a portionof each food category had been consumed. A portion was defined as 80g for fruits and 60gfor vegetables.3 The recommendations for
the consumption of fruits and vegetablesconsist in three daily servings of each food group.3 To calculate the fruit
intake, the consumption of natural fruit juices was not considered;theconsumption ofvegetablesconsidered the intake of legumes, green-leaf vegetables, and solid soup contents.Potatoeswerenotconsideredinthegroupof veg-etables,astheyaretraditionallyallocatedinthegroupof carbohydrate-richfoods,inaccordancewithBrazilianfood guides.3,4
Statisticalanalysis
The data were double entered in SPSS, version 16.0 (Chicago,UnitedStates)andvalidatedusingEpi-Info®, ver-sion6.4(Atlanta,UnitedStates).Statistical analyseswere performedinSPSS16.0software.Frequencyanalyseswere performed to describe categorical variables with means and standard deviation for continuous variables. Continu-ousvariablesweretestedfornormalityofdistributionusing theKolmogorov-Smirnovtest;whenthedistributionwasnot normal, theywere presented asmedian andinterquartile range.
Theeffectoftheassociationbetweenvariablesand out-come(consumption ornon-consumptionofat leastadaily portion of each food category) was assessed by bivariate analysisusingPoissonregressionwithrobustestimationfor varianceadjustment.Variablesthatshowedanassociation withlowerlevelof statisticalsignificance orequal to20% (p≤0.20)wereincludedinthemultivariateanalyses.The magnitudeofassociationbetweentheinvestigatedfactors andfeedingpracticeswasestimatedusingprevalenceratios andconfidenceintervals(95%CI)inrobustPoissonregression bivariateandmultivariateanalyses.
The study was approved by the Ethics Committee in ResearchoftheUniversidadeFederaldeCiênciasdaSaúde dePortoAlegre,andapprovedbythePortoAlegreCityHall EthicsCommittee.Childrenwithunfavorableclinical situa-tionswerereferredtohealthservices.
Results
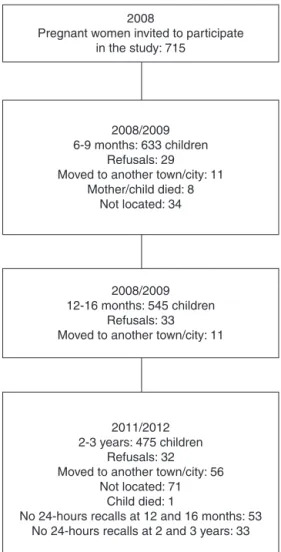
Fig.1 presentsthe flowchart ofdata collection, detailing the losses,refusals, and exclusions that occurredin each phase.Itisnoteworthythat149families(20.8%)werenot locatedforfollow-up,consideringallphasesofdata collec-tion.Inaddition,87children(12%)needed tobeexcluded fromanalysisbecausetheydidnothave24-hourrecallsat 12-16monthsand/or2-3years.
Among the children studied, the distribution between genders occurred homogeneously: 51.8% (n=201) were male. The characterization of the sample regarding the maternalandfamilydataisdescribedinTable1.
2008
Pregnant women invited to participate in the study: 715
2008/2009 6-9 months: 633 children
Refusals: 29 Moved to another town/city: 11
Mother/child died: 8 Not located: 34
2008/2009 12-16 months: 545 children
Refusals: 33 Moved to another town/city: 11
2011/2012 2-3 years: 475 children
Refusals: 32 Moved to another town/city: 56
Not located: 71 Child died: 1
No 24-hours recalls at 12 and 16 months: 53 No 24-hours recalls at 2 and 3 years: 33
Figure1 Flowchartofdatacollection.
children was 55g (0-130g) and 5g (0-30g), respectively. When assessing howmany children consumed the recom-mendedthreeservingsoffruits andvegetablesinatleast oneofthedietarysurveys,itwasobservedthatonly35 chil-dren(9%)achievedthisrecommendationforfruitandonly one(0.2%)forvegetables.
Motherswhoreportedofferingfruitsandvegetablesdaily totheir children when responding the 12-16 month ques-tionnaire accounted for 50.4% and 42.4% of the sample, respectively.
The energyconsumptionof non-recommendedfoodsat 12-16monthswasonaverage13.61%oftotalenergyintake; for 9.2% of the children, these foods accounted for over 30% ofenergy consumption.Mothers whoreported having offeredsoftdrinksorartificialjuicesandatleastthree dif-ferenttypesofnon-recommendedfoodsduringthemonth beforethe12-16monthdatacollectionaccountedfor83.3% and68.3%ofthesample,respectively.
Table 2 shows the variables associated with the con-sumption of fruit at 2-3 years. There was no significant associationwithgender,numberofchildren,maternaland paternal occupation, duration of exclusive breastfeeding, nutritional status, and maternal education. Among the dietaryvariables,theearlyconsumptionofsugaryfoodsand drinks, as well as the percentage of energy coming from
Table1 Sampledescription.
n(%)
Maternalage
<20years 81(20.8%)
≥20years 307(79.2%)
Yearsofmaternalschooling
<8years 185(47.6%)
≥8years 203(52.4%)
Yearsofpaternalschooling
<8years 176(45.3%)
≥8years 212(54.7%)
Familyincome
≤4minimumwages 309(79.6%)
>4minimumwages 79(20.3%)
MaternalOccupation
Paid 131(33.8%)
Unpaid 257(66.2%)
PaternalOccupation
Paid 351(90.4%)
Unpaid 37(9.6%)
Timeofexclusivebreastfeeding
<4months 295(76%)
≥4months 93(24%)
Overweightmother
No 150(38.7%)
Yes 238(61.3%)
Numberofchildren
Onlychild 174(44.8%)
Morethan1 214(55.2%)
non-recommendedfoodsconsumedat12-16monthswasnot associatedwithoutcome.
Regardingincome,childrenwhosefamilieshadincomes higher than four minimum wages showed a 19% higher probabilityofnot consumingone servingoffruit aday. A higherlevelofpaternaleducationwasassociatedwiththe consumption of fruits, and each additional year of study influencedbyapproximately4%theprobabilityofthechild toconsumeoneportionoffruit.Moreover,theweekly fre-quency of consumption of fruits at 12 months showed a positive association with their consumption at 2-3 years, witheachday that themother offeredfruitstoher child leadingtoa5%increaseintheprobabilityofthechild con-sumingthematthepreschoolyears.
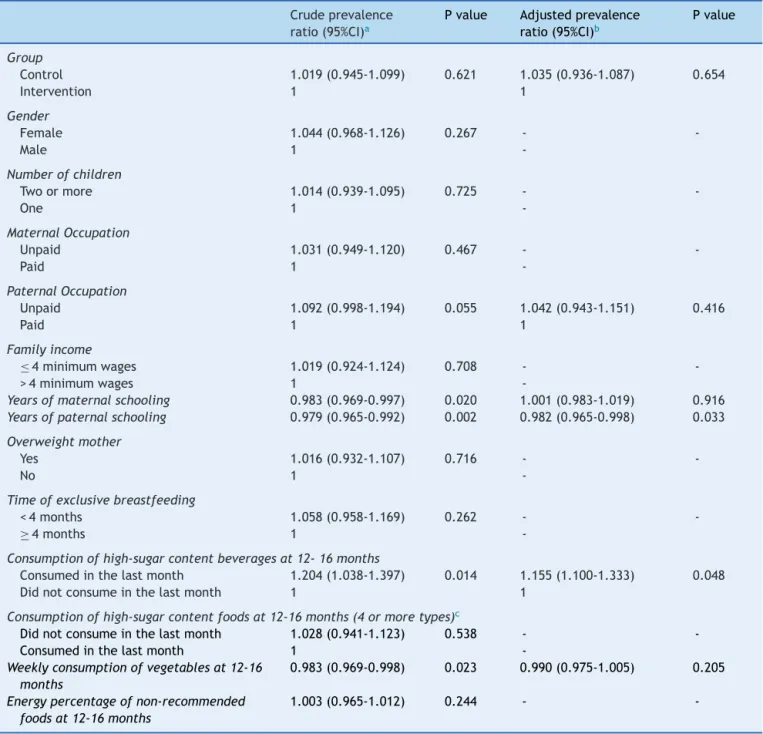
Table3describesthevariablesassociatedwiththe con-sumptionofvegetablesat2-3years.Eachyearofpaternal educationresultedinanincreaseofalmost2%inthe proba-bilityofconsumingatleastonedailyservingofvegetables; consumptionofsugarydrinksat12-16monthsincreasedthe probabilityofthechild notconsumingoneportionof veg-etablesbymorethan15%.
Discussion
Table2 Factorsassociatedtolowconsumptionoffruitsamongchildrenaged2---3years.
Crudeprevalence ratio(95%CI)a
Pvalue Adjustedprevalence ratio(95%CI)b
Pvalue
Group
Control 1.078(0.910-1.276) 0.385 1.088(0.955-1.13) 0.443
Intervention 1 1
Gender
Female 1.085(0.917-1.284) 0.344 -
-Male 1
-Numberofchildren
Twoormore 1.101(0.926-1.309) 0.276 -
-One 1
-MaternalOccupation
Unpaid 1.011(0.845-1.210) 0.906 -
-Paid 1
-PaternalOccupation
Unpaid 1.047(0.795-1.397) 0.743 -
-Paid 1
-Familyincome
≤4minimumwages 0.851(0.705-1.026) 0.090 0.803(0.664-0.971) 0.024
>4minimumwages 1 1
Yearsofmaternalschooling 1.013(0.981-1.047) 0.431 -
-Yearsofpaternalschooling 0.973(0.994-1.002) 0.065 0.961(0.928-0.997) 0.03
Overweightmother
Yes 1.031(0.858-1.239) 0.745 -
-No 1
-Timeofexclusivebreastfeeding
<4months 1.021(0.836-1.247) 0.838 -
-≥4months 1
-Consumptionofhigh-sugarcontentbeveragesat12-16months
Consumedinthelastmonth 1.094(0.856-1.399) 0.473 -
-Didnotconsumeinthelastmonth 1
-Consumptionofhigh-sugarcontentfoodsat12-16months(4ormoretypes)c
Didnotconsumeinthelastmonth 1.082(0.892-1.312) 0.424 -
-Consumedinthelastmonth 1
-Weeklyconsumptionoffruitsat12-16months 0.941(0.911-0.972) <0.001 0.950(0.919-0.982) 0.002
Energypercentageofnon-recommendedfoods at12-16months
1.001(0.994-1.009) 0.698 -
-CI,confidenceinterval.
aPearson’schi-square.
b Poissonregressionperformedwithvariableswithp≤0.20inthecrudeanalysis. c Assessedfoods:artificialjuice,cookies,softdrinks,candy,snacksandjello.
did not consume one serving of fruit a day. Similar data wereobserved in a Brazilian study ofchildren between 6 and59monthsofage,inwhichthelowprevalenceof con-sumptionoffruitsandvegetableswasobserved.Theauthors observedthatlessthan50%ofthechildrenconsumedfruit dailyand only 12% consumed leafy vegetables.10 There is
evidencethatdietarypatternsestablishedintheearlyyears willremainthroughout life,11,12 becauseearly exposureto
certainfoodsorflavorshasaheavyinfluenceontheir accep-tanceintheshortandlong-term.13
Thefindingsofthisstudycorroboratethisevidence,with the observation that fruit consumption at 12 months of
age wasassociated to its consumption at 2-3 years. It is emphasized thatthe recommendationsfor fruits and veg-etables are threedaily servings, that is, 240g and 180g, respectively.Thepercentageofchildrenwhoreachedthese recommendationswasnotsufficienttoanalyzethisproposal inthepresentstudy.
Anotherfindingwasthe association between consump-tionofsoftdrinksandother sugarydrinksinthefirstyear of lifeand lowerconsumption of vegetablesat 2-3years. Theconsumptionofthesebeverages,especiallysoftdrinks, hasincreasedsignificantlyamongchildren,14andsome
Table3 Factorsassociatedwithlowconsumptionofvegetablesamongchildrenaged2-3years.
Crudeprevalence ratio(95%CI)a
Pvalue Adjustedprevalence ratio(95%CI)b
Pvalue
Group
Control 1.019(0.945-1.099) 0.621 1.035(0.936-1.087) 0.654
Intervention 1 1
Gender
Female 1.044(0.968-1.126) 0.267 -
-Male 1
-Numberofchildren
Twoormore 1.014(0.939-1.095) 0.725 -
-One 1
-MaternalOccupation
Unpaid 1.031(0.949-1.120) 0.467 -
-Paid 1
-PaternalOccupation
Unpaid 1.092(0.998-1.194) 0.055 1.042(0.943-1.151) 0.416
Paid 1 1
Familyincome
≤4minimumwages 1.019(0.924-1.124) 0.708 -
->4minimumwages 1
-Yearsofmaternalschooling 0.983(0.969-0.997) 0.020 1.001(0.983-1.019) 0.916 Yearsofpaternalschooling 0.979(0.965-0.992) 0.002 0.982(0.965-0.998) 0.033
Overweightmother
Yes 1.016(0.932-1.107) 0.716 -
-No 1
-Timeofexclusivebreastfeeding
<4months 1.058(0.958-1.169) 0.262 -
-≥4months 1
-Consumptionofhigh-sugarcontentbeveragesat12-16months
Consumedinthelastmonth 1.204(1.038-1.397) 0.014 1.155(1.100-1.333) 0.048 Didnotconsumeinthelastmonth 1 1
Consumptionofhigh-sugarcontentfoodsat12-16months(4ormoretypes)c
Didnotconsumeinthelastmonth 1.028(0.941-1.123) 0.538 -
-Consumedinthelastmonth 1
-Weeklyconsumptionofvegetablesat12-16 months
0.983(0.969-0.998) 0.023 0.990(0.975-1.005) 0.205
Energypercentageofnon-recommended foodsat12-16months
1.003(0.965-1.012) 0.244 -
-CI,confidenceinterval.
a Pearson’schi-square.
b Poissonregressionperformedwithvariableswithp≤0.20inthecrudeanalysis. c Assessedfoods:artificialjuice,cookies,softdrinks,candy,snacksandjello.
beverageswithweightgainandadiposity15andother
comor-bidities,suchasincreasedbloodglucoselevelsinchildren andadults.15,16
BeauchampandMoran17demonstratedthatchildrenhave
the innate sweet taste preference, and that early intake of sugary liquids can further encourage this preference. Additionally,Skinner11observedthatwhilesweetfoodsare
amongthefavoritesofchildren,theleast-appreciatedfoods arevegetables.Thus,stimulationoftheinnatepreference forsweets,offeringsoftdrinksandartificialjuices, added tothe lowconsumption of vegetablesearly in life,which maynegativelyaffectthedevelopmentofeatinghabits.18
Socioeconomic and family factors are directly associ-atedwiththedevelopmentofpreescholers’eatinghabits.19
Althoughmaternal educationis the most studied variable and a strong influence on the outcomes of health and nutrition,20 in the present study it waslow paternal
edu-cationthatwasassociatedwithlowerconsumptionoffruits andvegetables.There is evidencethat low parental edu-cation is related to less understanding of health needs and a lower degree of child care,21 also interfering with
the knowledge and understanding of nutritional recom-mendations and requirements.19,22 Thus, as observed in
educationallevelofferfewerfruitsandvegetablestotheir children.23,24
The results of this study demonstrated that children from higher-income families were less likely to consume fruits.However,it is important toemphasize that,in the presentstudy,thesampleconsistedonlyoffamiliesoflow socioeconomicstatus,andthatthecomparisonbetweenthe differentlevelsofincomewasperformedonlyinthisgroup. Thus,ahypothesisforthisfindingisthat,inthispopulation, amongfamilieswithhigherincome,fruitsarebeingreplaced byprocessedfoodswithhigherenergydensity,duetohigher purchasingpower25andgreatercapacityfortheacquisition
ofthesefoods.14
A study performed in Brazil observed that increased consumptionoffoodswithhighenergydensitymaybe asso-ciatedwithreducedconsumptionoftraditionalfoodsinthe dietofBrazilians.14 It wasalsoobservedthatdietary
pat-ternscharacterized by high intakeof sweets,soft drinks, and snacks are more frequent in populations withhigher purchasingpower.14,26Studiesinotherdevelopingcountries
observedsimilarresults,associatinghighlyenergeticdietary patternswithhigher-incomefamilies.27,28
Thisstudyhaslimitationsthatneedtobeacknowledged. Thelowsocioeconomicstatusofthestudypopulationdoes not allow for the extrapolation of the present results to other populations.However,this populationthat usesthe BrazilianPublicHealthSystemcentershasgreaterbiological andsocialvulnerabilitywhencomparedwiththepopulation withhighersocioeconomicstatus, whichrequire careand effectivehealthpromotionstrategies.Anotherlimitationto beconsideredisthattheassessedchildrenparticipatedina randomizedfieldtrial,andtheperformedinterventionmay haveinfluencedtheresults.
However,minimizingtheeffectsoftheintervention,the groupvariablewasincludedintheregression,withthe pur-pose of servingasa control for its effectand wasshown nottobeassociated withoutcomes.Moreover,itwasnot possible to assess the factors associated with insufficient consumption of fruits and vegetables,as over 90% of the childrendidnotconsumetherecommendedthreedaily serv-ings.
The results of this study demonstrate that high preva-lenceofchildrenaged2---3years,treatedatBrazilianbasic health care centers, eat less than one serving of fruits andvegetablesperdayandsuggestthatlowpaternal edu-cation and feeding practices during the first year of life areinvolved in thisprocess. Thus,the implementationof healthyeatingpracticesinchildcarebyhealthprofessionals isofutmostimportance,sinceitwasdemonstratedbythe randomizedfieldtrial29,30thatmotherswithlowpurchasing
powerimprovethequalityofthefoodgiventotheirchildren afterreceivingdietarycounseling.
Funding
Fundac¸ãodeAmparoàPesquisadoEstadodoRioGrandedo Sul(FAPERGS).
Conflicts
of
interest
Theauthorsdeclarenoconflictsofinterest.
References
1.TrabulsiJC,MennellaJA.Diet,sensitiveperiodsinflavour learn-ing,andgrowth.IntRevPsychiatry.2012;24:219---30.
2.Mennella JA, Trabulsi JC. Complementary foods and fla-vor experiences: setting the foundation. Ann Nutr Metab. 2012;60:40---50.
3.Brasil. Ministério da Saúde. Secretaria de Atenc¸ão à Saúde. Departamento de Atenc¸ão Básica. Dez passos para uma alimentac¸ãosaudável:guiaalimentarparamenoresde2anos. Umguiaparaoprofissionaldasaúdenaatenc¸ãobásica.2nded.
Brasília:MinistériodaSaúde;2010.p.72.
4.PhilippiST,LatterzaAR,CruzAT,RibeiroLC.Adaptedfood pyra-mid:aguideforarightfoodchoice.RevNutr.1999;12:65---80.
5.WorldHealthOrganization(WHO).Diet,nutritionand preven-tion of chronic diseases: report of a joint WHO/FAO expert consultation. Geneva: WHO; 2002 (WHO Technical Report Series;916).
6.ButteNF, FoxMK,Briefel RR,Siega-Riz AM,Dwyer JT, Dem-ing DM, et al. Nutrient intakes of US infants, toddlers, and preschoolersmeetorexceeddietaryreferenceintakes.JAm DietAssoc.2010;110:S27---37.
7.FoxMK,CondonE,BriefelRR,ReidyKC,DemingDM.Food con-sumptionpatternsofyoungpreschoolers:aretheystartingoff ontherightpath?JAmDietAssoc.2010;110:S52---9.
8.BirchLL.Developmentoffoodacceptancepatternsinthefirst yearsoflife.ProcNutrSoc.1998;57:617---24.
9.Núcleo de estudos e pesquisa em alimentac¸ão (NEPA). Uni-versidadeEstadual deCampinas (Unicamp).Tabelabrasileira de composic¸ão de alimentos (TACO). 4th ed. Campinas:
NEPA/Unicamp;2011.p.161.
10.BortoliniGA,GubertMB,SantosLM.Foodconsumptionin Brazil-ian children by6 to 59months of age. Cad SaudePublica. 2012;28:71---1759.
11.Skinner JD, Carruth BR, Wendy B, Ziegler PJ. Children’s food preferences: a longitudinal analysis. J Am Diet Assoc. 2002;102:47---1638.
12.Beauchamp GK, Mennella JA. Early flavor learning and its impactonlaterfeedingbehavior.JPediatrGastroenterolNutr. 2009;48:S25---30.
13.BirchLL, FisherJO. Developmentof eatingbehaviors among childrenandadolescents.Pediatrics.1998;101:539---49.
14.InstitutoBrasileirodeGeografiaeEstatística(IBGE).Pesquisa deOrc¸amentosFamiliares2008-2009:Análisedoconsumo ali-mentarpessoalnoBrasil.RiodeJaneiro:IBGE;2011.
15.GibsonS.Sugar-sweetenedsoftdrinksandobesity:asystematic reviewoftheevidencefromobservationalstudiesand interven-tions.NutrResRev.2008;21:134---47.
16.InterActconsortium.Consumptionofsweetbeveragesandtype 2 diabetes incidence in European adults: resultsfrom EPIC-InterAct.Diabetologia.2013;56:1520---30.
17.BeauchampGK,MoranM.Acceptanceofsweetandsaltytastes in2-year-oldchildren.Appetite.1984;5:291---305.
18.VenturaAK,MennellaJA.Innateandlearnedpreferencesfor sweettasteduringchildhood.CurrOpinClinNutrMetabCare. 2011;14:379---84.
19.PatrickH,NicklasTA.Areviewoffamilyandsocialdeterminants ofchildren’seatingpatternsanddietquality.JAmCollNutr. 2005;24:83---92.
20.NobreLN,LamounierJA,FranceschiniSC.Preschoolchildren dietary patterns and associated factors. J Pediatr (Rio J). 2012;88:129---36.
21.FloresG, Bauchner H,Feinstein AR,Nguyen US.The impact ofethnicity,family income, and parental educationon chil-dren’shealthanduseofhealthservices.AmJPublicHealth. 1999;89:71---1066.
thelowfruitandvegetableconsumers?JEpidemiolCommunity Health.1999;53:294---9.
23.Bigio RS, Verly Junior E, Castro MA, César CL, Fisberg RM, Marchioni DM. Determinants of fruit and vegetable intake inadolescents using quantile regression.Rev SaudePublica. 2011;45:448---56.
24.Ebenegger V,Marques-Vidal PM,Nydegger A, Laimbacher J, NiedererI,BürgiF,etal.Independentcontributionofparental migrant status and educational level to adiposity and eat-ing habits in preschool children. Eur J Clin Nutr. 2011;65: 210---8.
25.CoelhoAB, AguiarDR,FernandesEA.Padrão de consumode alimentosnoBrasil.RevEconSociolRural.2009;47:335---62.
26.SichieriR,CastroJF.MouraAb.Factorsassociatedwithdietary patternsintheurbanBrazilianpopulation.CadSaudePublica. 2003;19:S47---53.
27.Shi Z, Lien N, Kumar BN, Holmboe-Ottesen G. Socio-demographic differences in food habits and preferences of schooladolescentsinJiangsuProvince.ChinaEurJClinNutr. 2005;59:48---1439.
28.ZaborskisA, Lagunaite R, Busha R, LubieneJ. Trend in eat-inghabitsamongLithuanianschool-agedchildrenincontextof socialinequality:threecross-sectionalsurveys2002,2006and 2010.BMCPublicHealth.2012;12:52.
29.VitoloMR,RauberF,CampagnoloPD,FeldensCA,HoffmanDJ. Maternaldietarycounseling inthefirst yearoflifeis associ-atedwithahigherhealthyeatingindexinchildhood.JNutr. 2010;140:7---2002.