T. G. Pecin
[email protected] Pontifical Catholic University of Rio de Janeiro Department of Civil Engineering 22453-900 Rio de Janeiro, Brazil
A. A. D. Almeida
[email protected] Fluminense Federal University Department of Civil Engineering 24210-240 Niterói, Brazil
J. L. Roehl
[email protected] Pontifical Catholic University of Rio de Janeiro Department of Civil Engineering 22453-900 Rio de Janeiro, Brazil
Tornadic Mechanical Global Actions
on Transmission Towers
Despite the evidence of energy transmission tower collapses due to tornadic events in the Brazilian territory, no national study treats the issue under strictly structural focus. In this context, as a starting point, mechanical global actions due to an approximate mathematical model of a F3 tornado, compatible with the Brazilian threat on two towers, one guyed and one self-supported tower, are evaluated; these tower models are largely used in the Paraná-Uruguai River Basins, critical on such occurrences. Comparisons with actions foreseen in design are performed in order to obtain the critical loading situations. Usage of tornadic response spectrum practices is proposed and particular aspects of tornadic loads on tower structures are analyzed.
Keywords: tornado, transmission tower, wind
Introduction1
The occurrence of tornadoes in Brazil has been frequently reported, especially in the South and Southeast regions. From an engineering point of view, special attention should be given to critical structures, such as nuclear power plants and energy transmission towers. Failure of these towers, due to probable atmospheric disturbances of small scale, as tornadoes, has occurred in the South and Southeast regions river basins, leading to interruptions of energy supply and, consequently, to important economic consequences.
Most of the existent works in the literature deal with the issue under meteorological and statistical focuses. Few studies discourse on the deterministic mechanical effects of tornado incidence on structures, probably due to the little knowledge developed on
tornado wind and pressure fields. Wen (1975) adapts the Kuo’s
model (1971) and presents a dynamic analysis of a high steel building, including convective effects. Eberline et al. (1991) relate the non-linear structural response of a coal conductive system and point out to a large structure sensibility to the tornado translation velocity. Dutta et al. (2002) show that the combined effect of the lateral wind load with its vertical component is more harmful than the first one taken separately. A numerical analysis of the rupture of an electric energy transmission tower due to a tornado is performed by Savory et al. (2001). No Brazilian study of this nature is known.
This report deals with the mechanical effects, in terms of global actions and internal stresses, resulting from the incidence of a tornado in two representative transmission tower models, a guyed and a self-supported tower, from South and Southeast regions river basins. The numerical evaluation is conducted starting from the application of tornado wind field model, Wen (1975). A Fujita F3 tornado is used, in accordance with the region threat. Comparisons of tornadic mechanical global actions with those foreseen in usual wind design are carried out. It is also proposed the usage of tornado response spectra
Nomenclature
B = projection of the body width on the velocity direction or incident acceleration
b = fluctuation parameter of the velocity components Cd = drag coefficient
Paper accepted November, 2010. Technical Editor: Domingos Alves Rade
Cm = inertia coefficient
D = distance from the center of the structure to tornado path F = force
Fb = total shear force on structure basis due to the design wind Fbl = total shear force on structure basis due to the design
wind in the longitudinal direction
Fbtr = total shear force on structure basis due to the design
wind in the transversal direction Fn = tornado axial force
Fnb = design wind axial force
Fq = global shear force
Fr = radial direction force Ft = tangential direction force Fv = vertical direction force f0 = system fundamental frequency
FAmax = maximum response amplification factor
M = overturning moment
Mb = design wind overturning moment
Mbl = design wind overturning moment in the longitudinal
direction
Mbtr = design wind overturning moment in the transversal
direction
Mr = structure basis overturning moment in the radial direction
Mt = structure basis overturning moment in the tangential direction
P = tower self-weight R = radial velocity
r = distance to the center of the tornado divided by the core radius, r'/ rmax
r’ = distance tornado center
rmax = core radius, where the maximum tangential velocity occurs
S0 = tornado to structure center distance at the beginning of
the analysis T = tangential velocity
Tmax = maximum tangential velocity
U0 = prevailing wind in the region
Uven = incident wind velocity
u = structure incident velocity in the x direction V = tornado translation velocity
Vmax = maximum horizontal wind velocity
Vro = rotational velocity
W = vertical velocity
w = structure incident velocity in the z direction z = height over the ground
Greek Symbols
= angle between tornado path and x axis
0 = thickness of the boundary layer where r>> 1
(r) = boundary layer thickness as a function of r
= angle between the axis x and the straight line uniting tornado and structure centers
= reason between the height above ground and the thickness of the boundary layer, z/
= angle between tornado path and the straight line uniting tornado and structure centers
= air specific mass
Development
Structural models
The towers considered in this work are representative of an electric energy transmission line in operation in Paraná Basin. Two suspension towers are considered, a self-supported, called SS, and a guyed, SG. The foundations are, in both structures, either precast concrete piles or footings, with variable dimensions according to particular soil conditions.
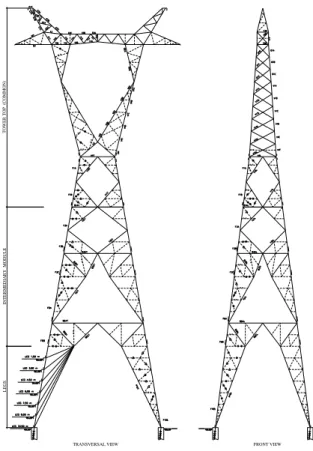
The height of the self-supported towers varies from 22.5 to 49.5 m, depending on the number of intermediary modules and leg lengths. As a standard model for this study, a 49.5 m height tower is considered, Fig. 1.
LEG S INTERM EDIARY M O D U L E TOWER TO P (C O M M O N )
TRANSVERSAL VIEW FRONT VIEW
Figure 1. SS tower.
The guyed towers, Fig. 2, have heights ranging from 24 to 42 m, depending on the amount of intermediary modules. A 42 m high tower is chosen as a standard point for this report.
The tower first five natural frequencies are shown in Table 1.
H=42.0m H=24.0m C1 M1 C10 T11A C2 C14 C13 C15 T4 M2 T5 T11B T13A T12B T12A T6C T10A T6AT6B T1A/T1BT2A/T2B T16A T3AT3A T14AT15A PH1B P20T P1E P1I P2E P2I P1I P1E PH2B P30T P3E P3I P20T P30T PH3B P40T P4E P4I P40T PH4B P50T P5E P5I P50T PH5B P60T P6E P6I P60T PH6B P70T P7E P7I P70T PH7B P8E P8I PH1B P20T P20T PH2B P2E P2I MSC PH9BP90T P9I P9E P90T P70T P70T P7I P7E MIC PH7B PIC M3.0 P8I P8E PH1A P20L P11 P12 P13 P20L PH2A P30L P30L PH3A P40L PH4A P40L P50L P50L PH5A P60L P60L PH6A P70L P70L PH7A T15E PSC T17 H=25.5m H=27.0m H=28.5m H=30.0m H=31.5m H=33.0m H=34.5m H=36.0m H=37.5m H=39.0m H=40.5m P1 4 C12 C11B C11A C11C
TRANSVERSAL VIEW FRONT VIEW
Figure 2. SG tower.
Table 1. Natural frequencies for self-supported, SS, and guyed, SG, tower models, Hz.
Mode 1 2 3 4 5
Tower SS 2.48 3.02 3.26 4.00 4.52
Tower SG 1.25 1.36 1.37 1.43 3.03
Tornado model
The analysis of tornado effects on structures presupposes the incidence of a tornado with velocity and pressure profiles already known. For that, laboratory simulations (e.g. Jischke and Light, 1983) and field measurements (e.g. Hoecker, 1960) are performed by the scientific community in order to propose adequate models of wind and pressure fields. The tornado wind field resembles a combined Rankine’s vortex, in spite of presenting much more complex behavior. The structure of such wind field has been a permanent research object among meteorologists. A great number of theoretical and experimental works have been done in the last few decades (Fujita, 1960; Ying and Chang, 1970; etc.). From these studies, basic knowledge about the wind loads has been obtained and used in tornado resistant design (e.g. Sherman, 1973).
Figure 3. Tornado velocities – adapted from Dutta et al. (2002).
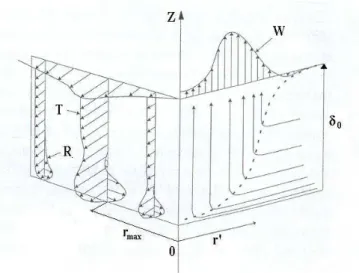
A theoretical model of the three-dimensional flow of a tornado-like vortex, where the profiles of the wind velocity are presented in function of the radial distance and height above the ground, is presented by Kuo (1971). The two non-linear boundary equations for the vertical and radial distribution of velocities are solved by an iterative method. It is found that the boundary layer thickness is very small in the center of the core. It increases rapidly with its distance to the center and maintains practically constant value in the outer region. The vertical profile of the velocity components (vertical, tangential and radial) presents different behavior in the two regions of the boundary layer. In the inner region there is oscillation of all the components, while they approach asymptotically without fluctuation their respective values in the outer region. The theoretical solution of Kuo can be visualized in Fig. 4.
Figure 4. Schematic representation of a tornado wind field proposed by Kuo – adapted from Savory et al. (2001).
Wen (1975) proposes a wind field that is qualitatively based on Kuo (1971) theoretical solution, but with a simplified format and reduced number of parameters to facilitate applications in engineering. According to the author, the thickness of the boundary layer as a function of the radial distance, (r), is given by the equation:
(1)
in which r = r’/rmax; rmax is the radius where the tangential velocity
is maximum; and 0 is the thickness when r >> 1.
It can be noted that the expression maintains the basic properties mentioned by Kuo (1971): the thickness tends to zero when the radial distance also decreases; it increases rapidly when r = 1 and remains constant when r >> 1.
About the velocity components, T, R and W, two regions are distinguished, defined by the boundary layer. Above the boundary layer, the radial component is null and the tangential component is given by:
(2)
in which Tmax is the maximum tangential velocity above the
boundary layer; = z/; and z is the height above the ground. Eq.
(2) shows similarities with the Rankine’s combined vortex, because
when r 0, T(r) r, and when r >> 1, T(r)1/r. The vertical
component of Kuo’s solution is adjusted by:
(3)
Still according to Kuo (1971), such vertical component has a very weak descending movement outside the core and a much strong ascending movement in the core, reaching the maximum between r = 0.6 and r = 1.0. Such motion is also inferred by Hoecker (1960) in field observations of a Dallas tornado, in USA (1957).
Inside the boundary layer, the velocity components are given by the equations:
;
(4)
in which R(,r) is the radial component and b(r) = 1.2exp(-0.8r4). The sinusoidal functions in the above expressions indicate the oscillatory character of the profiles of these velocities components in the boundary layer inner region. The parameter 'b' justifies the fluctuation stop existing in the outer region.
It may be observed that all model equations are functions of three free parameters: rmax, Tmax and 0 that can be adequately
chosen according to basic characteristics of the tornado, as its dimensions, intensity, etc. Wen (1975) makes a comparison of the velocity profiles described so far with those observed by Hoecker (1960) for three different heights (46, 92 and 305 m), obtaining satisfactory results.
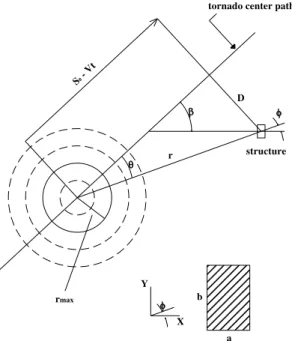
For the tornado path schematized in Fig. 5, the incident velocity profiles, u, v and w, according to the main directions of the structure, x, y and z, are given as:
(5)
in which T, R and W are given by Eqs. (2) to (4). With aid of Fig. 5, the expressions for the other parameters are obtained:
(6)
W
T V
R
(7)
in which U0(z) = prevailing wind in the region.
Therefore, , T and R at a fixed height, z, are functions of time only. D is the distance from the center of the structure to the tornado path, S0 is the distance between the tornado and the
structure, taking center to center, in the beginning of the analysis, and V is the translational velocity.
Figure 5. Problem geometry – adapted from Wen (1975).
The center of the structure is assumed located at the tornado path (D = = 0), situation in which the radial and tangential components correspond approximately to components u and v, respectively. In such situation, the radial and tangential velocity components have their directions inverted as the tornado approaches or stands back from the structure. Such behavior can be visualized in Fig. 5.
Similarly to the choice of the tower structural models to be analyzed, it is considered a tornado, with characteristics of a medium F3, compatible with the Brazilian territory hazard, particularly to the region of Paraná Basin, where the transmission line treated here is located. The adopted parameters are:
Tmax = 65 m/s;
rmax = 80 m;
V = 10 m/s;
0 = 460 m.
Evaluation of the pressure on the structure
It is generally accepted in the literature (Keulegan and Carpenter, 1958; Davenport, 1961; Etkin, 1966), for a slender bluff body, the force-velocity relationship described by Morrison’s equation:
(8)
in which F(t) is the total resistant force per unit length. It is the sum of two components, the drag and the inertia force being proportional to the square of the velocity and to the acceleration, respectively. The acceleration consists of a local term that is the partial time-derivative of the velocity expressions, and a convective term that is equal to the scalar product of the velocity vector and its gradient. The acceleration obtaining procedure can be seen in Wen (1975). Cd and Cm are the drag and inertia coefficients, is the specific mass of the fluid, Uven is the incident wind velocity and B is the
orthogonal projection width of the bluff body. The values of the coefficients are determined experimentally. Davenport (1961) and Vickery and Kao (1972) have obtained values of Cd close to unit and insensitive to the Reynolds number for buildings with sharp corners (Scruton and Rogers, 1971, apud Wen, 1975).
In the case of transmission towers, the inertia component in Eq. (8) can be neglected once the structural bar volume is little in relation to its exposure area to the wind.
Results
For an excitation with the singular characteristics of a tornado and considering the speculative origin of the mathematical model, very poor in physical confirmation, the analysis of the mechanical effects in a global perspective is recommended. Therefore, one rather opts for an evaluation focused on the global actions in order to have a synthetic idea of the mechanical effects on structures, for this situation of large tornado primary action variation. Initially, the results obtained for tower SS submitted to a F3 tornado are presented; total overturning moments, Mt,r, and shear forces, Ft,r, on
the tower base are related to the convention vectors in Fig. 6. The tornadic translational direction corresponds to the transversal design wind (perpendicular to transmission line). The other axis is referred to as the longitudinal direction. As it can be noted, it is still considered that the tornado path coincides in plant with the geometric center of the tower. It is also adopted the simplification of material point for the structure; this means that it is assumed the tower dimensions small compared to the tornado ones, with the actions being evaluated on model symmetry axis.
The parametric static response can be visualized through Figs. 7 to 9.
r
M
t
M
t
F
r
F
Center of tornado path
Figure 6. Vectors adopted for consideration of the global effects.
S0 - Vt
tornado center path
structure D
rmax
r
a b
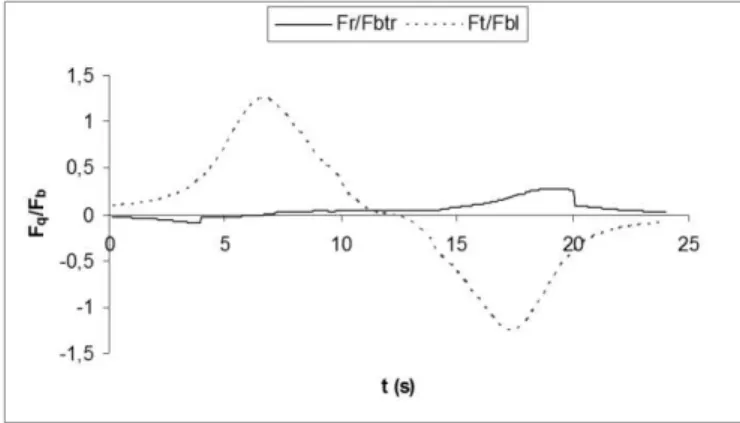
Figure 7. Tornadic total shear forces on tower SS base in relation to design wind forces.
Figure 8. Tornadic total overturning moments on tower SS base in relation to design wind moments.
Figure 9. Tornadic total vertical forces on tower SS base referred to its self-weight.
Tangential and vertical actions are preponderant in tornadic fields; they are anti-symmetrical and symmetrical, respectively.
This is a consequence of Kuo/Wen’s model and of the inertia component disregarding Morrison’s equation. The relationship
between the tornado tangential shear forces and those from wind code provision reaches up to 1.25. For the moments, such relationship is larger than 1.5.
The total vertical force overcomes the self-weight in 75% for the studied tower. This solicitation is not foreseen in usual winds design and it results in increased tension forces on tower legs and on its
foundations. The tornadic radial actions are not very important when compared to the correspondent wind code provisions.
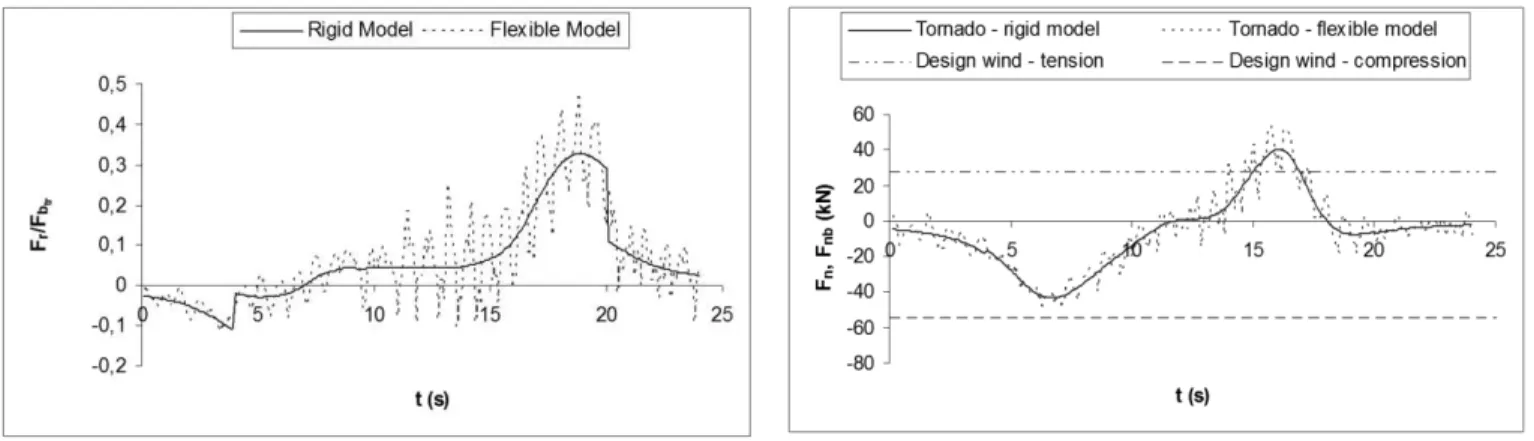
The SS tower undamped dynamic response is also obtained. In Figs. 10 and 11 it can be visualized the total shear forces obtained for the radial and tangential model directions. It was opted not to perform the dynamic analysis in the vertical direction due to low structure flexibility on this direction. The parameter 'rmax/V'
represents approximately the duration of the tornado pulse approach or removal to the structural target.
Figure 10. Static and dynamic response to total shear force in the radial direction for tower SS, f0 x rmax/V = 19.82.
Figure 11. Static and dynamic response to total shear force in the tangential direction for tower SS, f0 x rmax/V = 19.82.
It can be noted that the structure doesn't present considerable dynamic amplifications for the tornado in question. The dynamic responses resemble the rigid ones, with amplification factors close to unit. The maxima occur during the pulse. For radial direction a more pronounced free vibration is shown. It is also observed that the consideration of translational velocity alters the radial solicitation profile. The same differs from a double anti-symmetrical pulse, unlikely observed for the tangential direction. The structural behavior in free vibration indicates the dominance of the fundamental frequency.
Figure 12. Axial forces in the SS tower legs, f0 x rmax/V = 19.82. In the literature, the tornado structural analysis is frequently done through structure or tornado self-parameters variation, as core radius, model height, translational velocity, etc. Alternatively, the use of a response spectrum is proposed with its main time parameter focused on the product of the structure frequency by the duration of the tornado crossing along the tower. It can be a powerful analysis tool.
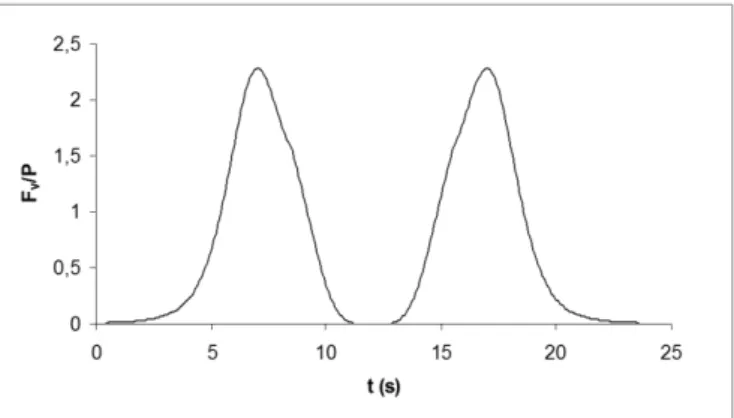
The response spectrum for the displacement at the top of the tower SS in the tangential direction is shown in Fig. 13, where rmax/V stands as the tornado crossing duration.
Figure 13. Dynamic response spectrum for displacement at the top of tower SS in tangential direction.
There are two peaks, with maximum amplifications of approximately 2.25 and 2.5. The main difference observed in relation to the classic spectrum for sinusoidal pulse is the presence of a valley between these two peaks, where FAmax is close to 1.4.
Such behavior is the same observed by Pecin (2006) for flexible framed structures and it reflects singular characteristics of tornadic excitation. Another interesting point is the fact that the dynamic amplification is not significant for values of “f0 x rmax/V” higher
than 5 or so. In the case here analyzed for the tower SS, for example, where “f0 x rmax/V” = 19.82, the response of the structure
is practically static. More flexible towers, associated with small crossing duration tornadoes, represent situations where the dynamic behavior can be significant.
The results obtained for the tower SG are described in sequence, considering the same incident tornado and the other conditions adopted for the previous tower. The parametric static response can be visualized through Figs. 14 to 16.
Results are similar to those observed for self-supported tower. The relationship between the tornado tangential force and that of the design wind reaches the peak of 1.68. For the moments, such
relation is larger than 2. As in the case of the previous tower, the design wind was calculated by IEC 60826/00 methodology. The total tornadic vertical force is 2.3 times larger than the self-weight of the considered structure. The radial solicitations are not relevant when compared to the cases foreseen in design.
The undamped dynamic response for the guyed tower in the radial and tangential directions is shown in Figs. 17 and 18.
Figure 14. Tornadic total shear forces on tower SG base in relation to design wind forces.
Figure 15. Tornadic overturning moments on tower SG base in relation to design wind moments.
Figure 17. Static and dynamic response to total shear force in the radial direction for tower SG, f0 x rmax/V = 10.04.
Figure 18. Static and dynamic response to total shear force in the tangential direction for tower SG, f0 x rmax/V = 10.04.
The FAmax for the radial direction is 1.47. In the tangential
direction, more important in terms of structural effects, the dynamic response is practically coincident to the static one. The other aspects are very similar to those already exposed for the self-supported tower. The fact of the dynamic amplification shows negligible for both towers is interesting because constitutes simplified factor for tornado resistance methodologies design draft.
Fig. 19 shows the axial force in one of the masts of the tower SG and compares it with the design forces. Similar to those noticed for the legs of the self-supported tower, the bars are submitted to compression and tension stress during tornado hit. The tension forces caused by tornado hit overcome the design forecast slightly. The compression of the mast by the design wind is higher than caused by tornado. The masts are not overloaded during the tornado passage because the guyes respond to tension solicitations due to the vertical force. The dynamic amplification for tension is approximately 1.3 and there is no considerable amplification for the compression.
The tension force in guyes can be visualized in Fig. 20. It overcomes the design force by more than two times. The guy specifically treated here is only mobilized during tornado removal, as can be noted. Naturally, other guyes are mobilized during tornado approach. The dynamic amplification is negligible.
Figure 19. Axial forces in the SG tower masts, f0 x rmax/V = 10.04.
Figure 20. Tension forces in the SG tower guyes, f0 x rmax/V = 10.04. Observation and Conclusions
Particular observations:
Tangential and vertical forces are predominant;
For the self-supported tower, the relationship between the tornadic tangential shear forces and those from design wind reaches the value of 1.25. For the moments, such relationship is about 1.6. To the guyed tower, such values are approximately 1.7 and 2.2;
The relationship between the ascending vertical force and the self-weight is equal to 1.75 for the self-supported tower and 2.3 for guyed one;
The tension force in self-supported tower legs resulting from tornado crossing is 2.2 times larger than those from design wind. For compression, such relationship is equal to 1.5;
The masts are not overloaded during the passage of the tornado because the guyes absorb the tension solicitations due to the vertical force;
The guy tension forces due to tornado is 2.2 times larger than the design force;
The towers don't present considerable dynamic amplifications for the analyzed F3 tornado;
General Conclusion
It can be inferred that the incidence of a F3 tornado, feasible in the national territory, in representative transmission line towers of Paraná-Uruguay Basin produces total shear forces and overturning moments at their bases that overcome the solicitations foreseen for the design wind. Additionally, there is the appearance of an ascending vertical force larger than the tower self-weight, situation not considered in the usual design. Such observation evidences an important foundation role in the tower resistance to tornadic action.
Acknowledgements
To the financial support supplied by CNPq, Brazilian national promoter entity of scientific and technological development. This
work is part of a joint research project involving
ELETRONUCLEAR – Eletrobrás Termonuclear S.A. and PUC-Rio.
References
Davenport, A.G., 1961, “The Application of Statistical Concepts to the Wind Loading on Structures”, Proceedings, The Institution of Civil Engineers, 19, pp. 449-472.
Dutta, P.K., Ghosh, A.K., Agarwal, B.L., 2002, “Dynamic response of structures subjected to tornado loads by FEM”, Journal of Wind Engineering
and Industrial Aerodynamics, Vol. 90, pp. 55-69.
Eberline, D.K., Wipf, T.J., Greimann, L.F., 1991, “Finite element
idealization of nonlinear structural response to tornado wind loads”, Finite
Elements in Analysis and Design, Vol. 10, pp. 59-74.
Etkin, B., 1966, “Theory of the Response of a Slender Vertical Structure
to a Turbulent Wind With Shear”, Meeting on Ground Wind Load Problems in Relation to Launch Vehicles, held at NASA Langley Research Center.
Fujita, T.T., 1960, “A Detailed Analysis of the Fargo Tornadoes”,
Research Paper no 42, U.S. Department of Commerce, Weather Bureau, Washington D.C.
Hoecker, W.H., 1960, “Wind Speed and Air Flow Pattern in the Dallas
Tornado of April, 1957”, Monthly Weather Review, 88, No. 5, pp. 167-180.
IEC 60826/00, “IEC 60826 – Loading Strength of Overhead
Transmission Lines”, IEC – International Eletrotechnical Comission, 2000. Jischke, M.C., Light, B.D., 1983, “Laboratory Simulation of Tornadic Wind Loads of a Rectangular Model Structure”, Journal of Wind
Engineering and Industrial Aerodynamics, 13, pp. 371-382.
Keulegan, G.H., Carpenter, L.H., 1958, “Forces on Cylinders and Plates
in an Oscillating Fluid”, Journal of Research, National Bureau of Standards, 60, pp. 423-440.
Kuo, H.L., 1971, “Axisymmetric flows in the boundary layer of a maintained vortex”, Journal of Atmospheric Sciences, Vol. 28, No. 1, pp. 20-41.
Pecin, T.G., 2006, “Avaliação das Ações Mecânicas de Tornados sobre
Estruturas Aporticadas Flexíveis”, Dissertação de Mestrado, Pontifícia Universidade Católica do Rio de Janeiro, PUC-Rio, 91 p.
Savory, E., Parke, G.A.R., Zeinoddini, M., Toy, N., Disney, P., 2001, “Modelling of tornado and microburst-induced wind loading and failure of a lattice transmission tower”, Engineering Structures, Vol. 23, pp. 365-375.
Scruton, C., Rogers, E.W.E., 1971, “Steady and unsteady wind loadings
of buildings and structures”, Philosophical Transactions of the Royal
Society, Vol. 269, pp. 353-383.
Sherman, Z., 1973, “Residential Buildings Engineered to Resist
Tornadoes”, Journal of the Structural Division, ASCE, 99, pp. 701-714. Vickery, B.J., Kao, K.H., 1972, “Drag of Along-Wind Response of Slender Structures”, Journal of the Structural Division, ASCE, 98, pp. 21-36.
Wen, Y.K., 1975. “Dynamic tornadic wind loads on tall buildings”,
Journal of the Structural Division, pp. 169-185.
Ying, S.J., Chang, C.C., 1970, “Exploratory Model Study of Tornado