Article
J. Braz. Chem. Soc., Vol. 26, No. 6, 1124-1135, 2015. Printed in Brazil - ©2015 Sociedade Brasileira de Química 0103 - 5053 $6.00+0.00
A
*e-mail: [email protected]
Investigation of the Environmental Transport of Human Pharmaceuticals to Surface
Water: A Case Study of Persistence of Pharmaceuticals in Effluent of Sewage
Treatment Plants and Hospitals in Malaysia
Fouad F. Al-Qaim,a,b Md P. Abdullah,*,a,c Mohamed R. Othman,a,c Zainab H. Mussa,a
Zuriati Zakaria,d Jalifah Latipa and Wan M. Afiqa
aSchool of Chemical Sciences and Food Technology, Faculty of Science and Technology,
Universiti Kebangsaan Malaysia (UKM), 43600 Bangi, Selangor, Malaysia
bDepartment of Chemistry, Faculty of Sciences for Women, Babylon University,
PO Box 4, 51001 Hilla, Iraq
cCentre for Water Research and Analysis (ALIR), Faculty of Science and Technology,
Universiti Kebangsaan Malaysia (UKM), 43600 Bangi, Selangor, Malaysia
dEnvironmental and Green Technology, Malaysia-Japan International Institute of Technology
(MJIIT), Universiti Teknologi Malaysia, 54100 Kuala Lumpur, Malaysia
The present work reports the occurrence and monitoring of 11 pharmaceuticals (i.e., caffeine, prazosin, enalapril, carbamazepine, nifedipine, gliclazide, levonorgestrel, simvastatin, hydrochlorothiazide, diclofenac-Na and mefenamic acid) in surface water and in the influent and effluent of sewage treatment plants (STPs) and hospitals (HSPs). A total of 105 water samples were analyzed using solid-phase extraction combined with liquid chromatography-time-of-flight/ mass spectrometry (SPE-LC-TOF/MS). The mean concentrations of the detected pharmaceuticals in STP influent and effluent ranged from < limit of quantification (LOQ) to 3909 ng L−1 and
12 to 577 ng L−1, respectively. The mean concentrations of the detected pharmaceuticals in the
hospital influent and effluent ranged from 28 to 1644 ng L−1 and 20 to 1540 ng L−1, respectively.
The highest concentration detected in the sampling points was 9099 ng L−1 for caffeine in influent
STP. The presence of prazosin has never been reported before in literature. In this study, prazosin was detected in all studied samples, and the highest concentration was 525 ng L−1 in influent STP.
Chemometric analysis was used to assess the presence of pharmaceuticals in samples.
Keywords: pharmaceuticals in water, chemometric analysis, monitoring of pharmaceuticals, pharmaceutical removal
Introduction
Presence of a large number of pharmaceuticals in different bodies of water may affect the purity of drinking water. Given that surface water is the most affected, pharmaceuticals may initially pose a problem to water utilities that use surface water as a water resource for drinking-water production. Trace amounts of emerging organic contaminants (EOCs), such as pharmaceuticals and hormones, can enter the environment. In the 1990s, researchers began to identify and quantify these EOCs in influent and effluent of sewage treatment plants (STPs),
surface water, and drinking water in Asia, Europe, the
United States, and Canada.1-11
Presence of pharmaceuticals in STPs was discovered in the 1970’s, in which two compounds namely, clofobric acid
and salicylic acid, were detected in a municipal sewage.12
Since then, research in the field has expanded dramatically, and almost 100 pharmaceuticals or their metabolites have
been detected in water samples.13
Various studies have recently shown that a large number of pharmaceuticals are ubiquitously present in surface water that are influenced by influent and effluent of STPs
and influent and effluent of hospitals.13-16 Although some
to humans because of their extremely low concentrations (in
the range of few ng L−1) compared with therapeutic doses (in
the ranges of milligrams).15 Presence of these compounds
in drinking water is still a sign of contamination originating from sewage, so the analysis of low concentrations (i.e.,
ng L−1) of pharmaceuticals found in water samples requires
highly sensitive and selective analytical methods in detecting pharmaceuticals in samples. Solid phase extraction (SPE)
cartridges are the most appropriate solution to meet this requirement followed by liquid chromatography combined
with mass spectrometry.2,17-19 The structure, therapeutic
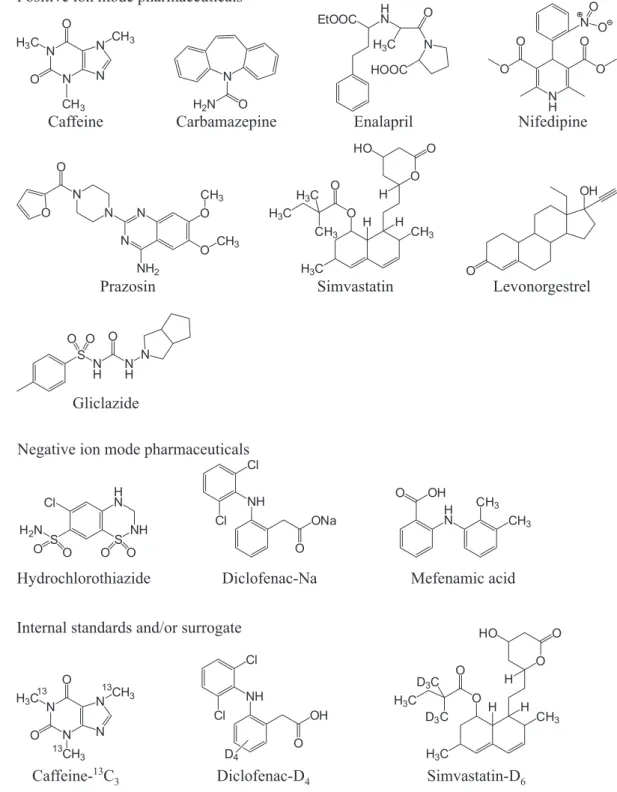
classes and physicochemical properties for all studied pharmaceuticals are presented in Figure 1 and Table 1. In Malaysia, research in this field is still at its infancy, so conducting such study is required to collect more information about Malaysian aquatic environment.
Positive ion mode pharmaceuticals
Caffeine Carbamazepine Enalapril Nifedipine
N
N N
N H3C
O O C C H H 3 3 N
H2N O
EtOOC H N
H3C N
O HOOC N H O O O O N O O
Prazosin Simvastatin Levonorgestrel
N N N N O O NH2 O CH3 O CH3
H3C H O O
CH3 H3C
H3C
H CH3 O H O HO O OH Gliclazide S N H N H N O O O Mefenamic acid Diclofenac-Na Hydrochlorothiazide
Negative ion mode pharmaceuticals
S NH H N O O S O O
H2N Cl Cl Cl NH ONa O H N OH O CH3 CH3 Simvastatin-D6 Diclofenac-D4
Caffeine- C13 3
Internal standards and/or surrogate
N
N N
N CH3 O
H3C
O CH3 13 13 13 NH Cl Cl OH O D4 CH3 H O O H H O O C D3
H3C D3C
H3C
HO
Experimental
Material and methods
Study site
All samplings were performed in Negeri Sembilan, one of Malaysian’s 13 states, which lies on the western coast of Peninsular Malaysia, immediately south of Kuala Lumpur and borders Selangor on the north, with Pahang in the east and Malacca and Johor to the south. The population of Negeri Sembilan is approximately 1.0 million, and the total
area is approximately 6686 km2. Samples were collected
from four STPs, three hospital (HSPs), and two receiving surface water (SW) in the state. A total of 13 sampling points, in the present study, include the SW as well as the influents and effluents of STPs and HSPs as presented in Figure S1 in the Supplementary Information (SI) section.
Sample collection
Table 2 shows some characteristics of the four STPs and three HSPs. Samples were also collected from the surface water SW at two points (SW STP 1 and SW HSP 2). The first three STPs (STP1, STP2, and STP3) are the main sources of sewage effluent in the Langat River, and STP4 is considered the biggest source in the Negeri Sembilan. Sampling was conducted from May to December 2013 (eight months). All samples were collected in 1 L amber glass bottles with Teflon-lined caps to ensure sample
integrity using a high-density polyethylene plastic bucket previously rinsed with distilled water and MeOH. The bottle head space was kept to a minimum by completely filling the bottles. The bottles were rinsed in the field twice with the sample and completely filled on the third sampling. Disposable gloves were used by the sampler to prevent any personal care products from contaminating the sample bottles. The collection of samples from influent and effluent of sewage treatment plants is to evaluate the treatment performance and is to explain which compounds are still persistent after treatment.
Method of analysis
The pharmaceuticals present in the collected samples were analyzed using a previously developed and validated method based on SPE, followed by liquid
chromatography-time-of-flight/mass spectrometry (LC-TOF/MS).27 Briefly;
the samples were preserved by adding 1 g L−1 of sodium azide
to prevent microbial degradation. Aliquots of 100, 250, 500, and 1000 mL were taken from the STP and HSP influent, STP and HSP effluent, SW, and deionized water (DIW), respectively. The aliquots were then passed through a 0.7 µm Whatman GF/F filter (UK) to remove particulate matter present in the water samples. Subsequently, the samples were stored at 4 °C to minimize the degradation of pollutants until the samples were extracted using SPE. The pharmaceuticals were extracted from the aqueous samples using Oasis HLB (3 cc, 60 mg) SPE cartridges by means of a 10-sample GAST
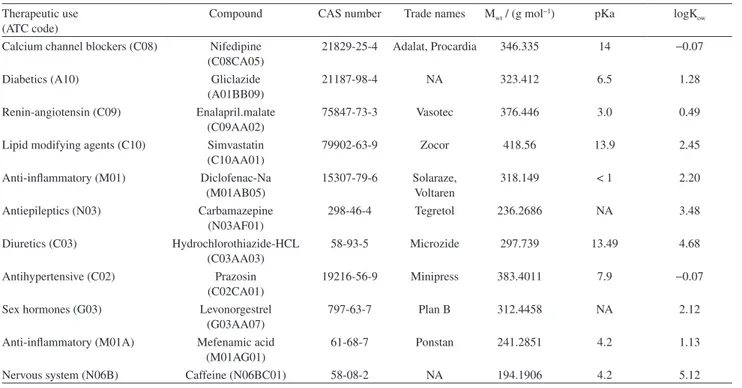
Table 1. Physicochemical properties of the selected pharmaceuticals20-26
Therapeutic use (ATC code)
Compound CAS number Trade names Mwt / (g mol−1) pKa logK ow
Calcium channel blockers (C08) Nifedipine (C08CA05)
21829-25-4 Adalat, Procardia 346.335 14 −0.07
Diabetics (A10) Gliclazide (A01BB09)
21187-98-4 NA 323.412 6.5 1.28
Renin-angiotensin (C09) Enalapril.malate (C09AA02)
75847-73-3 Vasotec 376.446 3.0 0.49
Lipid modifying agents (C10) Simvastatin (C10AA01)
79902-63-9 Zocor 418.56 13.9 2.45
Anti-inflammatory (M01) Diclofenac-Na (M01AB05)
15307-79-6 Solaraze, Voltaren
318.149 < 1 2.20
Antiepileptics (N03) Carbamazepine (N03AF01)
298-46-4 Tegretol 236.2686 NA 3.48
Diuretics (C03) Hydrochlorothiazide-HCL (C03AA03)
58-93-5 Microzide 297.739 13.49 4.68
Antihypertensive (C02) Prazosin (C02CA01)
19216-56-9 Minipress 383.4011 7.9 −0.07
Sex hormones (G03) Levonorgestrel (G03AA07)
797-63-7 Plan B 312.4458 NA 2.12
Anti-inflammatory (M01A) Mefenamic acid (M01AG01)
61-68-7 Ponstan 241.2851 4.2 1.13
Nervous system (N06B) Caffeine (N06BC01) 58-08-2 NA 194.1906 4.2 5.12
SPE vacuum manifold (DOA-P504-BN, USA). Exactly 500 ng of the internal standard mixture, which was composed of caffeine-13C
3 (CAF-13C3), simvastatin-D6 (SMV-D6), and
diclofenac-D4 (DIC-D4), was added to the samples performed
and mixed thoroughly before the extraction was performed. The solid-phase adsorbent was pre-conditioned with 2 mL
of methyl t-butyl ether (MTBE), 2 mL of MeOH, and 2 mL
of deionized water before the samples were loaded in the SPE cartridges. The samples were loaded at a flow rate of
9 mL min−1 under vacuum conditions. After sample loading,
the solid-phase adsorbent was washed with 2 mL of DIW. The cartridges were then dried under vacuum at 15 mL
min−1 for 25 min to 30 min to remove the residual water.
The pharmaceutical compounds were subsequently eluted in 12 mL-glass tubes by sequentially passing 5 × 1 mL of MTBE, 2 × 1 mL of acetone-MeOH (21:9, v/v), and 3 × 1 mL of acetone-MeOH (9:21, v/v). The combined eluents were evaporated to dryness under a gentle stream
of N2 gas. The dry extracts were reconstituted with 500 µL
of MeOH-DIW (10:90, v/v) and transferred to a 250 µL-deactivated glass insert with polymer feet inserted in amber glass vial (Agilent Technologies, USA). Exactly 30 µL of the extract was automatically injected into LC-electrospray ionization (ESI)-TOF/MS system for analysis.
LC-TOF/MS analysis
Instrumental analysis was carried out using a Dionex Ultimate 3000/LC 09115047 system (USA) equipped with a vacuum degasser, quaternary pump, and autosampler.
The ESI interface consisted of the standard Z-sprayTM ion
source fitted with an electrospray probe.
The analytes that were detected in ESI (+) and ESI (−)
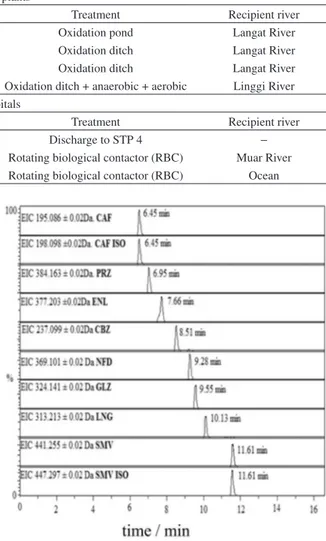
modes were separated on the same column, as previously mentioned. The eight compounds, namely, caffeine, prazosin, enalapril, carbamazepine, nifedipine, gliclazide, levonorgestrel and simvastatin, and two internal standards
that include CAF-13C
3 and SMV-D6 were analyzed in positive
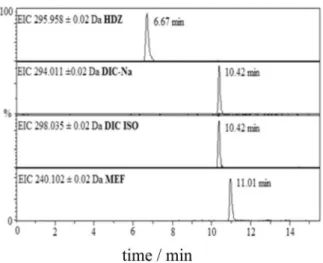
ion (PI) mode as shown in Figure 2. The three compounds,
including hydrochlorothiazide, diclofenac-Na, and
mefenamic acid, as well as the internal standard DIC-D4 were
analyzed in negative ion (NI) mode as presented in Figure 3.
Quality control
Recoveries of the studied pharmaceuticals in the different matrices of water samples were determined by initially spiking the samples with a standard mixture solution. The samples were then enriched using SPE. Six replicates were evaluated on different days, and the spiking
levels used were 0.5, 1, 2, and 5 µg L−1 as shown in Table S1.
Instrumental quantification limits are defined as the lowest concentration with a signal to noise ratio (S/N) of 10. Table S2 shows the linearity and limit of quantification (LOQ) of all the water samples.
Selectivity of the proposed method was investigated by analyzing the chromatograms obtained from the individual
Table 2. Information about the studied STPs and HSPs
Sewage treatment plants
Sampling point Influent flow / (m3 d−1) Population serviced Treatment Recipient river
STP 1 3801 7405 Oxidation pond Langat River
STP 2 5721 24612 Oxidation ditch Langat River
STP 3 1346 5984 Oxidation ditch Langat River
STP 4 40000 180000 Oxidation ditch + anaerobic + aerobic Linggi River
Effluent of hospitals
Sampling point No. beds Population serviced Treatment Recipient river
HSP 1 850 3400 Discharge to STP 4 −
HSP 2 314 1256 Rotating biological contactor (RBC) Muar River
HSP 3 93 372 Rotating biological contactor (RBC) Ocean
standards, standard mixture, and solvent without standards. Robustness of the method was studied by changing the mobile phase flow, location of instrument, and volume of injection. The retention time was constant under all the conditions, indicating that the method was robust (Table S3).
Results and Discussion
Monitoring of pharmaceuticals in surface water, influent, and effluent of STP and HSPs
Occurrence of pharmaceuticals in sewage treatment plants
A total of 64 samples (i.e., influent and effluent of STPs) were collected and analysed by using LC-TOF/MS (Tables 3 and 4).
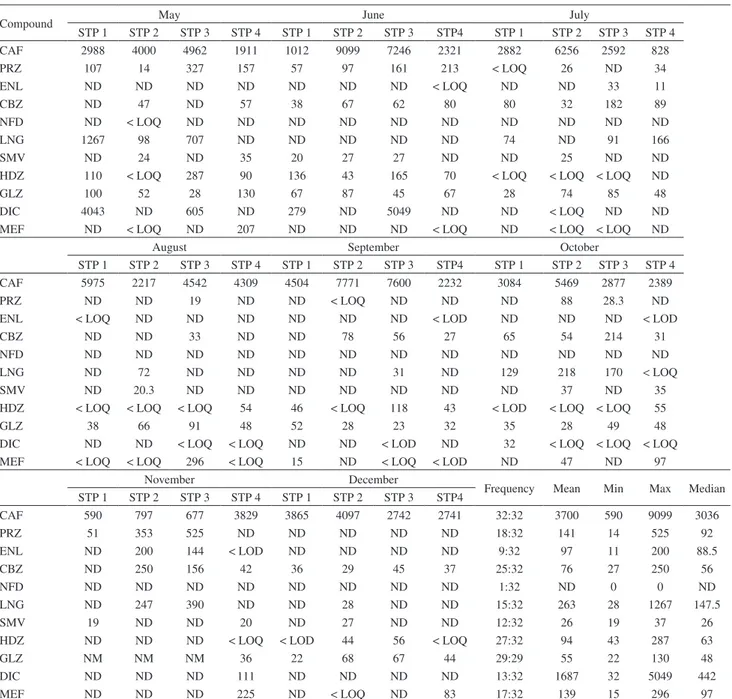
The frequency of detection and the concentration were
32:32 and 9099 ng L−1, respectively; these values were
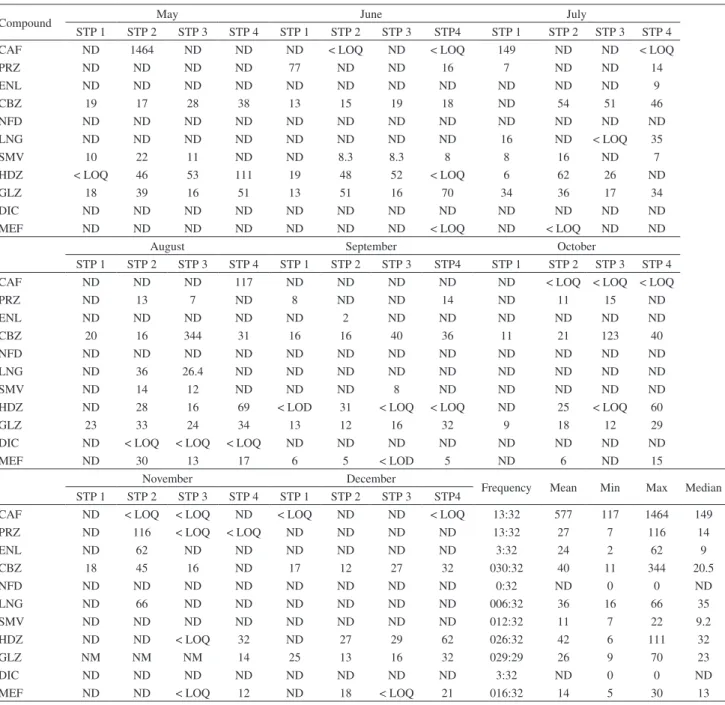
expected for caffeine in influent of sewage treatment plants. The mean concentration of caffeine in the effluent of sewage
treatment plants was 577 ng L−1, which is considered low,
compared with the results of other previous studies in the
United Kingdom and Ireland at 2048 and 2700 ng L−1,
respectively.28,29 Caffeine was moderately removed through
the treatment process; hence, the high concentration might be related to irregular treatment timing, as observed in STP2. Consequently, the number of detection was 13:32 in the effluent of sewage treatment plants.
The maximum concentration of caffeine in the influent
of the STPs was usually 9099 ng L−1; however, the high
concentration of caffeine detected in untreated wastewater was not only because of the amount of caffeine present in the pharmaceuticals, but also because of the presence of this compound in some products, such as coffee, tea, chocolate, and sports drinks.
The antihypertensive pharmaceuticals: prazosin, enalapril, nifedipine and hydrochlorothiazide were abundant in influent STP samples and had frequencies of detection of 18:32, 9:32, 1:32 and 27:32 respectively, and the maximum concentration was 525, 200, < LOQ and
287 ng L−1, respectively. The poor detection of nifedipine
may be related to the low consumption of consumers or rapid photodegradation when exposed to the environment. This result was in agreement with studies provided in
Malaysia and Germany.12,29 Three pharmaceuticals, namely
carbamazepine, hydrochlorothiazide and gliclazide were the most persistent compounds after treatment with a
maximum concentration of 344, 111 and 70 ng L−1,
respectively. In some cases, carbamazepine had higher effluent concentration than the STP influent. This finding has been noticed in other previous studies.7,9,30 In this study,
diclofenac-Na was detected in the influent and effluent
of STP with a maximum concentration of 5049 ng L−1
and < LOQ, whereas mefenamic acid had maximum
concentration of 296 and 30 ng L−1.
In comparison, STP 4 caters for 25-fold more than STP1 and STP3. Furthermore, the pharmaceuticals detected over the same 8 months (May 2013 to December 2013) were found to be slightly low. This result might be attributed to the tertiary treatment conducted on the STP4.
Occurrence of pharmaceuticals in hospitals
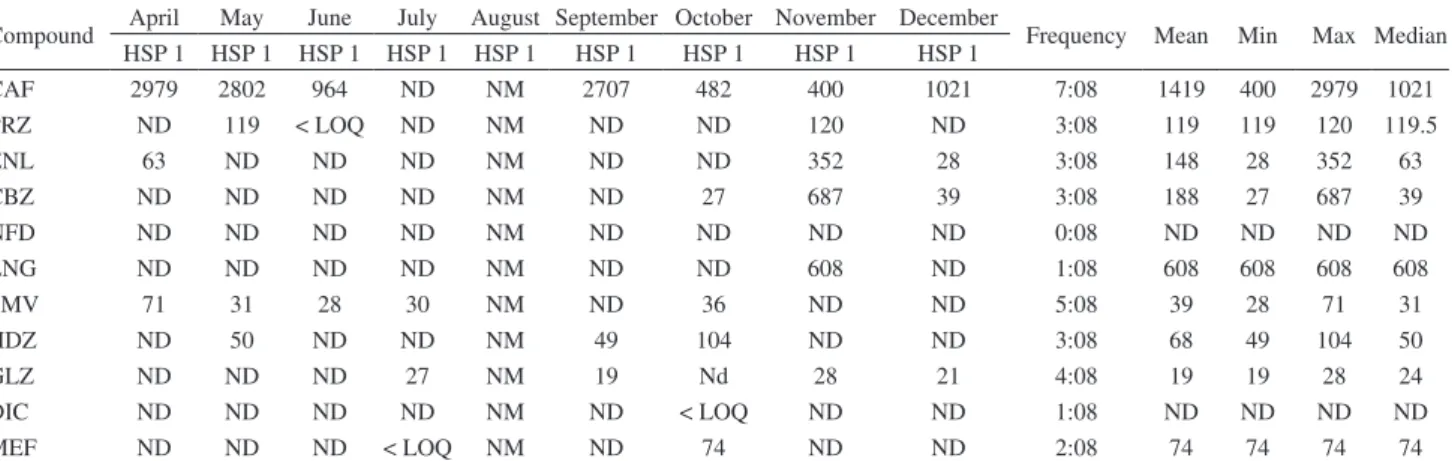
A total of 24 samples were collected from 3 hospitals. Eight samples of the influent were collected from one hospital (HSP1), and 16 samples of the effluent were collected from the other two hospitals (HSP2 and HSP3) (Table 5 and 6). Table 5 shows the concentrations of studied pharmaceuticals in the influent of hospital HSP1. This hospital discharges directly to STP4; hence, no effluent sample was collected from this hospital. The concentration of pharmaceuticals in the influent
HSP1 ranged from non-detected to 2979 ng L−1 as the
maximum concentration. The highest concentration
was for caffeine, that is, 2979 ng L−1 at high frequency
detection 7:8. Antihypertensive pharmaceuticals, namely, prazosin, enalapril and hydrochlorothiazide, were detected at frequency detection of 3:8, whereas nifedipine was undetected in all samples. Levonorgestrel and diclofenac were detected only once in all collected samples. The concentration of pharmaceuticals in the effluent of hospital HSP2 and HSP3 are summarized in Table 6. The highest
maximum concentration of 4131 ng L−1 was for caffeine,
and the frequency of detection was 16:16. The occurrence of synthetic hormone (levonorgestrel) in the effluent of hospitals is presented in Table 6. However, the maximum and minimum concentrations of levonorgestrel were
105 and 73 ng L−1, respectively. The antidiabetic drug
(gliclazide) was persistent in the effluent of hospitals and had a frequency of detection of 15:17 and a maximum
concentration of 66 ng L−1. Hydrochlorohtiaizde was
the most frequent detected drug compared with other pharmaceuticals in similar therapeutic classes at a
maximum concentration of 78 ng L−1. Carbamazepine was
found at a concentration range of 12 to 142 ng L−1 and the
frequency of detection was 12:18. Nifedipine was detected
only once at a concentration of 264 ng L−1. The efficiency
of treatment for sewage treatment plants compared with hospitals is considered better in terms of the number of detection and concentration of pharmaceuticals.
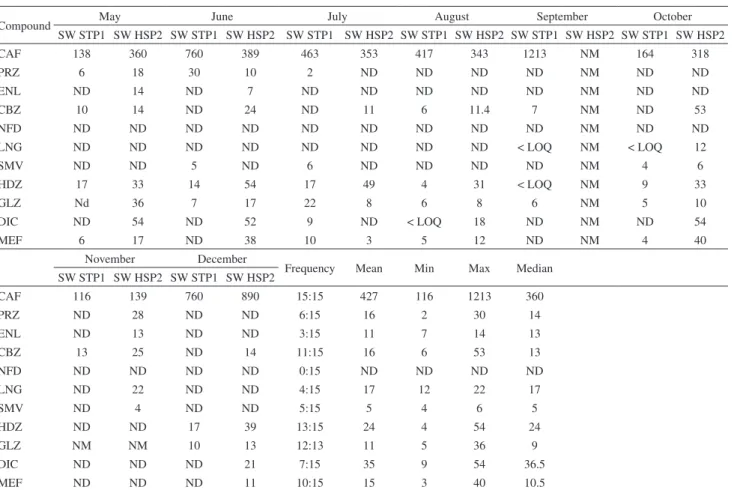
Occurrence of pharmaceuticals in surface water
A total of 15 samples were collected from two rivers (Table 7). Caffeine is one of the most widely used nervous system drugs (stimulant drug) and is available over the counter. Caffeine was continuously detected in the surface water at a high frequency number of detection (15:15)
Table 3. Mean, minimum, maximum and median concentrations (ng L−1) for all studied pharmaceuticals in influent sewage treatment plants during eight months
Compound May June July
STP 1 STP 2 STP 3 STP 4 STP 1 STP 2 STP 3 STP4 STP 1 STP 2 STP 3 STP 4
CAF 2988 4000 4962 1911 1012 9099 7246 2321 2882 6256 2592 828
PRZ 107 14 327 157 57 97 161 213 < LOQ 26 ND 34
ENL ND ND ND ND ND ND ND < LOQ ND ND 33 11
CBZ ND 47 ND 57 38 67 62 80 80 32 182 89
NFD ND < LOQ ND ND ND ND ND ND ND ND ND ND
LNG 1267 98 707 ND ND ND ND ND 74 ND 91 166
SMV ND 24 ND 35 20 27 27 ND ND 25 ND ND
HDZ 110 < LOQ 287 90 136 43 165 70 < LOQ < LOQ < LOQ ND
GLZ 100 52 28 130 67 87 45 67 28 74 85 48
DIC 4043 ND 605 ND 279 ND 5049 ND ND < LOQ ND ND
MEF ND < LOQ ND 207 ND ND ND < LOQ ND < LOQ < LOQ ND
August September October
STP 1 STP 2 STP 3 STP 4 STP 1 STP 2 STP 3 STP4 STP 1 STP 2 STP 3 STP 4
CAF 5975 2217 4542 4309 4504 7771 7600 2232 3084 5469 2877 2389
PRZ ND ND 19 ND ND < LOQ ND ND ND 88 28.3 ND
ENL < LOQ ND ND ND ND ND ND < LOD ND ND ND < LOD
CBZ ND ND 33 ND ND 78 56 27 65 54 214 31
NFD ND ND ND ND ND ND ND ND ND ND ND ND
LNG ND 72 ND ND ND ND 31 ND 129 218 170 < LOQ
SMV ND 20.3 ND ND ND ND ND ND ND 37 ND 35
HDZ < LOQ < LOQ < LOQ 54 46 < LOQ 118 43 < LOD < LOQ < LOQ 55
GLZ 38 66 91 48 52 28 23 32 35 28 49 48
DIC ND ND < LOQ < LOQ ND ND < LOD ND 32 < LOQ < LOQ < LOQ MEF < LOQ < LOQ 296 < LOQ 15 ND < LOQ < LOD ND 47 ND 97
November December
Frequency Mean Min Max Median STP 1 STP 2 STP 3 STP 4 STP 1 STP 2 STP 3 STP4
CAF 590 797 677 3829 3865 4097 2742 2741 32:32 3700 590 9099 3036
PRZ 51 353 525 ND ND ND ND ND 18:32 141 14 525 92
ENL ND 200 144 < LOD ND ND ND ND 9:32 97 11 200 88.5
CBZ ND 250 156 42 36 29 45 37 25:32 76 27 250 56
NFD ND ND ND ND ND ND ND ND 1:32 ND 0 0 ND
LNG ND 247 390 ND ND 28 ND ND 15:32 263 28 1267 147.5
SMV 19 ND ND 20 ND 27 ND ND 12:32 26 19 37 26
HDZ ND ND ND < LOQ < LOD 44 56 < LOQ 27:32 94 43 287 63
GLZ NM NM NM 36 22 68 67 44 29:29 55 22 130 48
DIC ND ND ND 111 ND ND ND ND 13:32 1687 32 5049 442
MEF ND ND ND 225 ND < LOQ ND 83 17:32 139 15 296 97
with the highest concentration of 1213 ng L−1. This result
might be due to the non-prescribed property of caffeine. However, caffeine was detected in surface water in Italy and Romania, with maximum concentration of 1056 and
3480 ng L−1, respectively.31,32 The lowest concentration
of caffeine detected in surface water was 116 ng L−1; this
result was in agreement with our previous study, wherein
the concentration of caffeine was 257 ng L−1.10
Antihypertensive pharmaceuticals, prazosin, enalapril, nifedipine and hydrochlorothiazide, were detected
at varying frequencies. However, nifedipine was undetected in surface water during all periods of the study. This phenomenon may be related to the fact that nifedipine is easily degraded and light sensitive. Hence, nifedipine did not show high persistency in the environment. Nifedipine was also seldom reported in the environment and was absent in 11 rivers and streams
samples collected from Germany.12 This was the first
time that prazosin was reported in environment matrices
and was found at a concentration of 2 to 30 ng L−1. The
Table 4. Mean, minimum, maximum and median concentrations (ng L−1) for all studied pharmaceuticals in effluent sewage treatment plants during eight months
Compound May June July
STP 1 STP 2 STP 3 STP 4 STP 1 STP 2 STP 3 STP4 STP 1 STP 2 STP 3 STP 4
CAF ND 1464 ND ND ND < LOQ ND < LOQ 149 ND ND < LOQ
PRZ ND ND ND ND 77 ND ND 16 7 ND ND 14
ENL ND ND ND ND ND ND ND ND ND ND ND 9
CBZ 19 17 28 38 13 15 19 18 ND 54 51 46
NFD ND ND ND ND ND ND ND ND ND ND ND ND
LNG ND ND ND ND ND ND ND ND 16 ND < LOQ 35
SMV 10 22 11 ND ND 8.3 8.3 8 8 16 ND 7
HDZ < LOQ 46 53 111 19 48 52 < LOQ 6 62 26 ND
GLZ 18 39 16 51 13 51 16 70 34 36 17 34
DIC ND ND ND ND ND ND ND ND ND ND ND ND
MEF ND ND ND ND ND ND ND < LOQ ND < LOQ ND ND
August September October
STP 1 STP 2 STP 3 STP 4 STP 1 STP 2 STP 3 STP4 STP 1 STP 2 STP 3 STP 4
CAF ND ND ND 117 ND ND ND ND ND < LOQ < LOQ < LOQ
PRZ ND 13 7 ND 8 ND ND 14 ND 11 15 ND
ENL ND ND ND ND ND 2 ND ND ND ND ND ND
CBZ 20 16 344 31 16 16 40 36 11 21 123 40
NFD ND ND ND ND ND ND ND ND ND ND ND ND
LNG ND 36 26.4 ND ND ND ND ND ND ND ND ND
SMV ND 14 12 ND ND ND 8 ND ND ND ND ND
HDZ ND 28 16 69 < LOD 31 < LOQ < LOQ ND 25 < LOQ 60
GLZ 23 33 24 34 13 12 16 32 9 18 12 29
DIC ND < LOQ < LOQ < LOQ ND ND ND ND ND ND ND ND
MEF ND 30 13 17 6 5 < LOD 5 ND 6 ND 15
November December
Frequency Mean Min Max Median STP 1 STP 2 STP 3 STP 4 STP 1 STP 2 STP 3 STP4
CAF ND < LOQ < LOQ ND < LOQ ND ND < LOQ 13:32 577 117 1464 149
PRZ ND 116 < LOQ < LOQ ND ND ND ND 13:32 27 7 116 14
ENL ND 62 ND ND ND ND ND ND 3:32 24 2 62 9
CBZ 18 45 16 ND 17 12 27 32 030:32 40 11 344 20.5
NFD ND ND ND ND ND ND ND ND 0:32 ND 0 0 ND
LNG ND 66 ND ND ND ND ND ND 006:32 36 16 66 35
SMV ND ND ND ND ND ND ND ND 012:32 11 7 22 9.2
HDZ ND ND < LOQ 32 ND 27 29 62 026:32 42 6 111 32
GLZ NM NM NM 14 25 13 16 32 029:29 26 9 70 23
DIC ND ND ND ND ND ND ND ND 3:32 ND 0 0 ND
MEF ND ND < LOQ 12 ND 18 < LOQ 21 016:32 14 5 30 13
Table 6. Mean, minimum, maximum and median concentrations (ng L−1) for all studied pharmaceuticals in effluent hospitals during nine months
Compound April May June July August September
HSP 2 HSP 3 HSP 2 HSP 3 HSP 2 HSP 3 HSP 2 HSP 3 HSP 2 HSP 3 HSP 2 HSP 3
CAF 574 3437 574 2194 41 2426 682 2526 450 4131 136 2269
PRZ 13 ND 13 ND 6 69 ND ND ND ND 19 ND
ENL 40 88 40 6 3 ND ND ND ND ND ND ND
CBZ 14 ND 14 32 12 ND 23 ND 25 ND 142 ND
NFD ND 264 ND ND ND ND ND ND ND ND ND ND
LNG ND ND ND ND ND 73 ND ND ND ND ND ND
SMV 8 ND 8 63.2 ND ND ND ND ND ND ND 19
HDZ 23 78 23 72 31 48 47 52 74 25 33 32
GLZ Nd 30 25 26 8 66 13 20 19 9 20 14
DIC 60 ND 59 ND 32 115 51 21 88 ND 15 ND
MEF 31 ND < LOQ < LOQ < LOQ 284 28 85 50 ND < LOQ 193
October November December
Frequency Mean Min Max Median HSP 2 HSP 3 HSP 2 HSP 3 HSP 2 HSP 3
CAF 545 2043 174 1916 363 1937 18:18 1468 41 4131 1299
PRZ 112 ND 117 ND 10 14 9:18 41 6 117 14
ENL ND ND 51 < LOQ ND ND 7:18 38 3 88 40
CBZ ND 16 81 18 44 15 12:18 36 12 142 20.5
NFD ND ND ND ND ND ND 1:18 264 264 264 264
LNG ND < LOQ 105 ND ND ND 3:18 89 73 105 89
SMV < LOQ 14 8 ND ND 10 8:18 19 8 63 10
HDZ 15 45 ND 32 55 ND 16:18 43 15 78 39
GLZ 12 20 NM 12 16 ND 15:17 21 8 66 19
DIC 43 15 ND ND ND ND 10:18 50 15 115 47
MEF 23 < LOQ ND < LOQ < LOQ ND 14:18 99 23 284 50
CAF: caffeine; PRZ: prazosin; ENL: enalapril; CBZ: carbamazepine; NFD: nifedipine; LNG: levonorgestrel; SMV: simvastatin; HDZ: hydrochlorothiazide; GLZ: gliclazide; DIC: diclofenac-Na; MEF: mefenamic acid; ND: not detected; < LOQ: the lowest limit at which analyte could be quantified.
Table 5. Mean, minimum, maximum and median concentrations (ng L−1) for all studied pharmaceuticals in influent hospitals during nine months
Compound April May June July August September October November December Frequency Mean Min Max Median HSP 1 HSP 1 HSP 1 HSP 1 HSP 1 HSP 1 HSP 1 HSP 1 HSP 1
CAF 2979 2802 964 ND NM 2707 482 400 1021 7:08 1419 400 2979 1021
PRZ ND 119 < LOQ ND NM ND ND 120 ND 3:08 119 119 120 119.5
ENL 63 ND ND ND NM ND ND 352 28 3:08 148 28 352 63
CBZ ND ND ND ND NM ND 27 687 39 3:08 188 27 687 39
NFD ND ND ND ND NM ND ND ND ND 0:08 ND ND ND ND
LNG ND ND ND ND NM ND ND 608 ND 1:08 608 608 608 608
SMV 71 31 28 30 NM ND 36 ND ND 5:08 39 28 71 31
HDZ ND 50 ND ND NM 49 104 ND ND 3:08 68 49 104 50
GLZ ND ND ND 27 NM 19 Nd 28 21 4:08 19 19 28 24
DIC ND ND ND ND NM ND < LOQ ND ND 1:08 ND ND ND ND
MEF ND ND ND < LOQ NM ND 74 ND ND 2:08 74 74 74 74
CAF: caffeine; PRZ: prazosin; ENL: enalapril; CBZ: carbamazepine; NFD: nifedipine; LNG: levonorgestrel; SMV: simvastatin; HDZ: hydrochlorothiazide; GLZ: gliclazide; DIC: diclofenac-Na; MEF: mefenamic acid; ND: not detected; < LOQ: the lowest limit at which analyte could be quantified.
number of frequency detection of prazosin and enalapril was 6:15 and 3:15, respectively. This result might be due to the rapid metabolization of enalapril by liver esterases to enalaprilat. However, a few previous studies reported that enalapril was undetected in surface water
or < LOQ.33,34 The maximum concentration of enalpril
was 14 ng L−1. Hydrochlorothiazide is a diuretic drug
and is the most detected pharmaceutical (13:15) in this group. The maximum and lowest concentrations were
54 and 4 ng L−1, respectively. Hydrochlorothiazide
was detected in Spain, at varying concentrations 164
lovastatin, is used to treat primary hypercholesterolemia, and is effective in reducing total and low-density lipoprotein (LDL)-cholesterol. Simvastatin was detected
in surface water at low concentrations of 6 ng L−1, as
a maximum concentration with a poor frequency of detection 5:15. This result was in line with previous
study reported by Al-Odaini,29 who detected simvastatin
in Malaysia at concentration less than method detection limit (MDL). Carbamazepine, diclofenac, mefenamic acid, and gliclazide, that belong to different therapeutic classes, have been detected at different concentrations
of 53, 54, 40 and 36 ng L−1, respectively (Table 7). The
anti-diabetic drug, gliclazide, was detected at a high frequency number of 12:13. This observation might be attributed to 8% of the population in Malaysia take this
drug.20 The impact of pharmaceuticals detected in surface
water varied from sewage treatment plants to hospital discharge. However, most pharmaceuticals detected in SW HSP2 have concentration higher than those detected in SW STP1. This result could be attributed to the efficiency of treatment process in sewage treatment plants and hospitals.
Table 7. Mean, minimum, maximum and median concentrations (ng L−1) for all studied pharmaceuticals in surface water during eight months
Compound May June July August September October
SW STP1 SW HSP2 SW STP1 SW HSP2 SW STP1 SW HSP2 SW STP1 SW HSP2 SW STP1 SW HSP2 SW STP1 SW HSP2
CAF 138 360 760 389 463 353 417 343 1213 NM 164 318
PRZ 6 18 30 10 2 ND ND ND ND NM ND ND
ENL ND 14 ND 7 ND ND ND ND ND NM ND ND
CBZ 10 14 ND 24 ND 11 6 11.4 7 NM ND 53
NFD ND ND ND ND ND ND ND ND ND NM ND ND
LNG ND ND ND ND ND ND ND ND < LOQ NM < LOQ 12
SMV ND ND 5 ND 6 ND ND ND ND NM 4 6
HDZ 17 33 14 54 17 49 4 31 < LOQ NM 9 33
GLZ Nd 36 7 17 22 8 6 8 6 NM 5 10
DIC ND 54 ND 52 9 ND < LOQ 18 ND NM ND 54
MEF 6 17 ND 38 10 3 5 12 ND NM 4 40
November December
Frequency Mean Min Max Median SW STP1 SW HSP2 SW STP1 SW HSP2
CAF 116 139 760 890 15:15 427 116 1213 360
PRZ ND 28 ND ND 6:15 16 2 30 14
ENL ND 13 ND ND 3:15 11 7 14 13
CBZ 13 25 ND 14 11:15 16 6 53 13
NFD ND ND ND ND 0:15 ND ND ND ND
LNG ND 22 ND ND 4:15 17 12 22 17
SMV ND 4 ND ND 5:15 5 4 6 5
HDZ ND ND 17 39 13:15 24 4 54 24
GLZ NM NM 10 13 12:13 11 5 36 9
DIC ND ND ND 21 7:15 35 9 54 36.5
MEF ND ND ND 11 10:15 15 3 40 10.5
CAF: caffeine; PRZ: prazosin; ENL: enalapril; CBZ: carbamazepine; NFD: nifedipine; LNG: levonorgestrel; SMV: simvastatin; HDZ: hydrochlorothiazide; GLZ: gliclazide; DIC: diclofenac-Na; MEF: mefenamic acid; ND: not detected; NM: not measured; < LOQ: the lowest limit at which analyte could be quantified; SW STP1: surface water downstream effluent STP1; SW HSP 2: surface water downstream effluent of hospital HSP 2.
Chemometric analysis
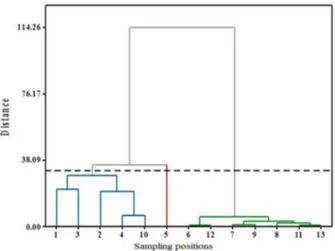
Chemometric analysis results showed that the water sampling stations were classified into three clusters, as shown in the dendogram (Figure 4).
Figure 4. Dendogram showing different clusters of different sampling stations of water samples on pharmaceutical pollution. 1: INF STP 1; 2: INF STP 2;3: INF STP 3;4:INF STP 4; 5: INF HSP 1;6: EFF STP 1; 7: EFF STP 2;8: EFF STP 3;9:EFF STP 4; 10: EFF HSP 3; 11: EFF HSP 2;12: SW STP 1;13: SW HSP 2.
design of the sampling point, which is as pipe discharge direct to the sewage treatment plant STP 4, it was not sink like other stations as common. The other sampling points, including the effluent of the STPs, effluent of the hospital HSP 2, and their related downstream river, was considered as cluster three. These locations were grouped together because of the high similarity in terms of concentration and frequency of detection in these locations.
Figure 5 shows the dendogram cluster of the pharmaceuticals, in which three clusters were formed. All studied compounds were clustered in different groups because they do not form one cluster. These differences were attributed to the differences in the
physicochemical properties, environmental fate, and ability of the pharmaceuticals to resist degradation.
Caffeine, gliclazide, and diclofenac-Na comprised the first cluster. The second cluster included prazosin, mefenamic acid, and hydrochlorothiazide, whereas enalapril, simvastatin, carbamazepine, and levonorgestrel constituted the third cluster. The studied pharmaceuticals were clustered based on their environmental behaviour or properties. The grouping of caffeine, gliclazide, and diclofenac-Na may be due to their high consumption and non-prescribed pharmaceuticals (caffeine).
The principal component analysis was used to select the number of components extracted. According to the eigenvalue-one criterion, only principal components (PCs) with eigenvalues greater than 1 are considered as important values. In the scree plot test (Figure 6), three PCs were selected, in which the eigenvalues for PC1, PC2, and PC3 were 5.756, 1.5877, and 1.091, respectively. The scores of the samples corresponding to PC1 and PC2 are presented in Figure 7. Each sample was identified by the name of the corresponding sampling station. The sample sites were classified in three different groups. The first group corresponds to the zone with high concentration influence, which included the influent of the four STPs (i.e., INF STP 1, INF STP 2, INF STP 3, and INF STP 4) and the effluent of the HSP 2. The second group corresponds to the influent of the hospital (INF HSP 1). Meanwhile, the third group includes the effluent of the STPs, effluent of the HSP 3, and their downstream river (i.e., SW STP 1 and SW HSP 2), which considered less pollution compared with zones 1 and 2.
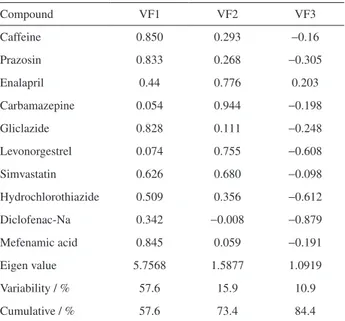
Table 8 shows the loading of varimax-rotated factor matrix for three-factor models. Evidently, the first factor was generally more correlated with the variables than the second and the third factors. The terms ‘strong’, ‘moderate’, and ‘weak’ as applied to factor loadings, refer to absolute loading values of > 0.75, 0.75-0.5, and 0.5-0.3, respectively.
Figure 5. Dendogram showing different clusters of pharmaceuticals detected at different water samples.
Factor 1 (VF1), which contributed 57.6% of the total variability (Table 8), was strong-positive correlated to caffeine, whereas prazosin, gliclazide, and mefenamic acid were related to clusters 1 and 2.
Factor 2 (VF2) explains 15.9% of the data variability, with a clear contribution from enalapril, carbamazepine, levonorgestrel, and simvastatin; these compounds were included entirely in cluster 3. Factor 3 (VF3) explains 10.9% of the variability. However, only two compounds were included in the VF3, namely diclofenac-Na and hydrochlorothiazide, which belong to clusters 1 and 2, respectively.
Overall, the 10 pharmaceuticals detected in the bodies of water in Malaysia were distributed in the influent and effluent of the STPs and HSPs, as well as in the SW.
Conclusions
A methodology using LC-TOF/MS analysis of caffeine, prazosin, enalapril, carbamazepine, nifedipine, levonorgestrel, simvastatin, hydrochlorothiazide, gliclazide, diclofenac-Na, and mefenamic acid was developed and successfully applied to analyze the different environmental aquatic samples in the SW, and influent and effluent of the STPs and HSPs. These pharmaceuticals were chosen based on their reported high consumption rates in Malaysia and frequent detection worldwide. The proposed method was precise, sensitive, and robust. Moreover, the method was accurate and the method facilitated the detection of 11 compounds from the water samples. Accurate mass measurements were monitored for each of the pharmaceuticals, which were studied using TOF/MS. The LOQs varied broadly, depending on the compound; the
values of the LOQ ranged from 0.4 ng L−1 to 3 ng L−1,
1.6 ng L−1 to 13 ng L−1, 2.2 ng L−1 to 46 ng L−1, 2.8 ng L−1 to
28 ng L−1, 11 ng L−1 to 182 ng L−1, and 5 ng L−1 to 267 ng L−1
in drinking water, SW, sewage treatment plants and hospital effluents, and in sewage treatment plants and hospital influent, respectively. The current work investigated the presence of the eleven pharmaceuticals in the SW and influent and effluent of the sewage treatment plants and hospitals in Malaysia.
The results showed that a number of the studied compounds namely; caffeine, carbamazepine, gliclazide, simvastatin, hydrochlorothiazide and mefenamic acid; pose moderate to high persistence in sewage treatment effluents, as well as in the receiving rivers. The compounds detected in the 105 samples at all sampling points during the nine-month monitoring from April 2013 to December 2013 were as follows: 81.5% caffeine, 43% prazosin, 18.5% enalapril, 75% carbamazepine, 92.7% gliclazide, 28.7% levonorgestrel, 41.7% simvastatin, 86.1% hydrochlorothiazide, 37% diclofenac-Na, and 61.1% mefenamic acid. Nifedipine was detected in only one of the 105 tested samples.
This study confirmed that the bodies of water in Malaysia contained varying levels of different pharmaceutical residues.
Supplementary Information
Supplementary data are available free of charge at http://jbcs.sbq.org.br as PDF file.
Acknowledgments
The authors thank Mr. Alefee for providing the LC-TOF/MS facility used in this study and the ALIR
Table 8. Rotated factor loadings and communalities varimax rotation
Compound VF1 VF2 VF3
Caffeine 0.850 0.293 −0.16
Prazosin 0.833 0.268 −0.305
Enalapril 0.44 0.776 0.203
Carbamazepine 0.054 0.944 −0.198
Gliclazide 0.828 0.111 −0.248
Levonorgestrel 0.074 0.755 −0.608
Simvastatin 0.626 0.680 −0.098
Hydrochlorothiazide 0.509 0.356 −0.612
Diclofenac-Na 0.342 −0.008 −0.879
Mefenamic acid 0.845 0.059 −0.191
Eigen value 5.7568 1.5877 1.0919
Variability / % 57.6 15.9 10.9
Cumulative / % 57.6 73.4 84.4
Figure 7. Scores of all 13 water samples on the plane defined by the first
staff for supplying the ultra-pure water and sampling facilities. This work was financially supported by the UKM-DLP-2012-024, UKM-AP-2011-21, and BKP-FST-K001671.
References
1. Okuda, T.; Yamashita, N.; Tanaka, H.; Matsukawa, H.; Tanabe, K.; Environ. Int.2009, 35, 815.
2. Ferrer, I.; Zweigenbaum, J. A.; Thurman, E. M.; J. Chromatogr. A 2010, 1217, 5674.
3. González, A. S.; Catalá, M.; Maroto, R. R.; Gil, J. L. R.; de Miguel, Á. G.; Valcárcel, Y.; Environ. Int.2010, 36, 195. 4. Liu, J. L.; Wong, M. H.; Environ. Int.2013, 59, 208.
5. Trenholm, R. A.; Vanderford, B. J.; Snyder, S. A.; Talanta2009,
79, 1425.
6. Lajeunesse, A.; Gagnon, C.; Int. J. Environ. Anal. Chem.2007,
87, 565.
7. Yuan, S.; Jiang, X.; Xia, X.; Zhang, H.; Zheng, S.; Chemosphere 2013, 90, 2520.
8. Chen, H. C.; Wang, P. L.; Ding, W. H.; Chemosphere2008, 72,
863.
9. Lacey, C.; Basha, S.; Morrissey, A.; Tobin, J. M.; Environ. Monit. Assess.2012, 184, 1049.
10. Al-Qaim, F. F.; Abdullah, M. P.; Othman, M. R.; Latip, J.; Afiq, W.; J. Braz. Chem. Soc.2014, 25, 271.
11. Al-Qaim, F. F.; Abdullah, P.; Othman, M. R.; Latip, J.; Afiq, W. M.; Trop. J. Pharm. Res.2013, 12, 609.
12. Ternes, T.; Bonerz, M.; Schmidt, T.; J. Chromatogr. A2001,
938, 175.
13. Ferrer, I.; Thurman, E. M.; J. Chromatogr. A2012, 1259, 148. 14. Koreje, K. O.; Demeestere, K.; Wispelaere, P.; Vergeynst, L.;
Dewulf, J.; Langenhove, H. V.; Sci. Total Environ.2012, 437,
153.
15. Dévier, M.; Manach, K.; Viglino, L.; Gioia, L.; Lachassagne, P.; Budzinski, H.; Sci. Total Environ.2013, 443, 621.
16. Gómez, M. J.; Petrović, M.; Fernández-Alba, A. R.; Barceló, D.;
J. Chromatogr. A2006, 1114, 224.
17. Patrolecco, L.; Ademollo, N.; Grenni, P.; Tolomei, A.; Caracciolo, A. B.; Capri, S.; Microchem. J.2013, 107, 165.
18. Verlicchi, P.; Al-Aukidy, M.; Jelic, A.; Petrović, M.; Barceló, D.;
Sci. Total Environ.2014, 470, 844.
19. Nielen, M. W. F.; Engelen, M. C.; Zuiderent, R.; Ramaker, R.;
Anal. Chim. Acta2007, 586, 122.
20. Malaysian Statistics on Medicine (Ministry of Health Malaysia, Kuala Lumpur, 2007), http://apps.who.int/medicinedocs/en/d/ Js17580en/ accessed in March, 2015.
21. Open Data Drug and Drug Target Database, http://www. drugbank.ca/, accessed in March, 2015.
22. Zendelovska, D.; Simeska, S.; Sibinovska, O.; Kostova, E.; Miloševska, K.; Jakovski, K.; Javanovska, E.; Kikerkov, I.; Trojačanec, J.; Zafirov, D.; J. Chromatogr. B2006, 839, 85.
23. Vieno, N. M.; Tuhkanen, T.; Kronberg, L.; J. Chromatogr. A 2006, 1134, 101.
24. Lacey, C.; McMahon, G.; Bones, J.; Barron, L.; Morrissey, A.; Tobin, J. M.; Talanta2008, 75, 1089.
25. Wille, K.; Noppe, H.; Veheyden, K.; Bussche, J. V.; Wulf, E.; Caeter, P. V.; Janssen, C. R.; Barbander, H. F.; Vanhaecke, L.;
Anal. Bioanal. Chem.2010, 397, 1797.
26. Paschke, A.; Brümmer, J.; Schüürmann, G.; Anal. Bioanal. Chem.2007, 387, 1417.
27. Al-Qaim, F. F.; Abdullah, M. P.; Othman, M. R.; Latip, J.; Zakaria, Z.; J. Chromatogr. A2014, 1345, 139.
28. Baker, D. R.; Kasprzyk-Hordern, B.; J. Chromatogr. A2011, 1218, 1620.
29. Al-Odaini, N. A.; Zakaria, M. P.; Yaziz, M. I.; Surif, S.;
J. Chromatogr. A2010, 1217, 6791.
30. Lavén, M.; Alsberg, T.; Yu, Y.; Adolfsson-Erici, M.; Sun, H.;
J. Chromatogr. A2009, 1216, 49.
31. Loos, R.; Wollgast, J.; Huber, T.; Hanke, G.; Anal. Bioanal. Chem.2007, 387, 1469.
32. Moldovan, Z.; Chemosphere2006, 64, 1808.
33. López-Serna, R.; Pérez, S.; Ginebreda, A.; Petrović, M.; Barceló, D.; Talanta2010, 83, 410.
34. Garcia-Ac, A.; Segura, P. A.; Viglino, L.; Fürtös, A.; Gagnon, C.; Prévost, M.; Sauvé, S.; J. Chromatogr. A2009, 1216, 8518.
35. Petrović, M.; Škrbić, B.; Živančev, J.; Ferrando-Climent, L.; Barcelo, D.; Sci. Total Environ.2014, 468, 415.
Submitted: November 25, 2014