Abstract
Fiber-matrix interface performance has a great influence on the mechanical properties of fiber reinforced composite. This influence is mainly presented during fiber pullout from the matrix. As fiber pullout process consists of fiber debonding stage and pullout stage which involve complex contact problem, numerical modeling is a best way to investigate the interface influence. Although many numerical research works have been conducted, practical and effective technique suitable for continuous modeling of fiber pullout process is still scarce. The reason is in that numerical divergence frequently happens, leading to the modeling interrup-tion. By interacting the popular finite element program ANSYS with the MATLAB, we proposed continuous modeling technique and realized modeling of fiber pullout from cement matrix with desired interface mechanical performance. For debonding process, we used interface elements with cohesive surface traction and exponential failure behavior. For pullout process, we switched interface elements to spring elements with variable stiffness, which is related to the interface shear stress as a function of the interface slip displacement. For both processes, the results obtained are very good in comparison with other numerical or analytical models and experimental tests. We suggest using the present technique to model toughening achieved by randomly distributed fibers.
Keywords
Modeling of fiber, pullout, fiber-matrix interface model, finite element method, variable stiffness spring element.
Continuous Modeling Technique of Fiber Pullout from a Cement
Matrix with Different Interface Mechanical Properties Using
Finite Element Program
1 INTRODUCTION
It is well known that tensile strength of the brittle material, such as concrete, ceramic and glass, is much lower than its compressive strength. However, the addition of fibers into the brittle matrix
Leandro Ferreira Friedrich a Chong Wang a
a Applied Mechanics Group, Graduate
Program in Engineering, Federal University of Pampa, Alegrete, RS, Brazil.
[email protected] [email protected]
http://dx.doi.org/10.1590/1679-78252575
can significantly increase the material fracture strength. We can rate the main advantages of fiber reinforcement composites with the brittle matrix as (1) improvement in fracture toughness and ten-sile strength of the composite and (2) inhibition of crack-open and propagation. These desirable features have been obtained with a low fiber volume fraction, generally less than 2% (Fantilli and Vallini, 2008).
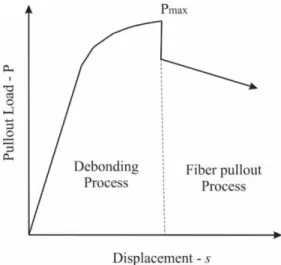
The fiber-matrix interface property directly affects the mechanical behavior of the composite. The most common way to observe the interface effect is through fiber pullout tests, which consists of debonding process and followed pullout process (Figure 1). For these two processes, the adhesion between fiber and matrix is the key (Kim and Mai, 1998). Engineers and researchers always seek for new techniques of characterizing interface and numerical methods to determine the strengths of the composite reinforced by the fibers with the characterized interface in order to obtain better compo-sites with expected mechanical performance. For this, a number of numerical and computational models has been developed.
Figure 1: Typical fiber pullout test curve.
Since many parameters are involved in the pullout process such as the mechanical properties of fiber, matrix, and interface, as well as the geometry of the fiber (Wang and Friedrich, 2013), it is still difficult to continuously model a single fiber pullout test. Others factors such as mesh and con-tact problems increase the difficulty. Although the modeling of fiber pullout problem has been stud-ied for almost twenty years, we note that the reports on the research advance are decreased sub-stantially recently. The reason would rather be attributed to the great difficulty in the numerical convergence of modeling than that the problem has been resolved. Also, we note that there is scarcely the numerical modeling that can systematically deal with whole fiber pullout process with desired interface mechanical properties. No one of the reported works can continuously model whole fiber pullout with desired interface mechanical properties without interrupting and modifying the modeling program.
This work presents continuously modeling technique without interruption to simulate the whole process of fiber pullout from cement matrix using popular finite elements program ANSYS® inter-acting with the MatLab®. At debonding stage, we suggest using interface elements with the cohe-sive zone model (CZM) presented by Xu and Needleman (1994) and obtain a satisfied relationship between the tractions acting on the fiber surface and the displacements jump across the interface. At fiber pullout stage, we propose employing nonlinear spring elements to model the debonded in-terface. The nonlinear spring elements are of variable stiffness and able to relate interface shear behavior with fiber slip displacement relative to the matrix. The number of the nonlinear spring elements on the interface decreases with the fiber slip displacement. The switching from debonding process to pullout process is made automatically through a computational subroutine implemented in the software MatLab®.
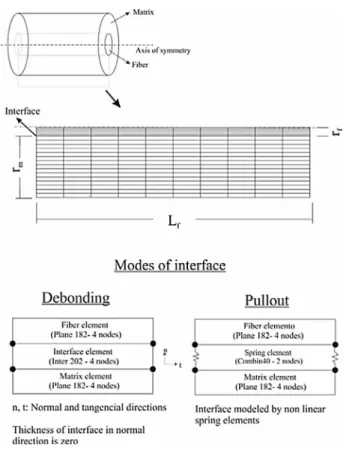
2 PROPOSED FINITE ELEMENT MODEL FOR FIBER PULL-OUT PROCESS
Figure 2: Axisymmetric concentric-cylinder model, mesh, and modes of the interface.
The debonding process is uniquely dependent on the required properties of the cohesive inter-face; meanwhile, the pullout process is dependent on the spring stiffness. When considering shear stress as constant, known as constant-
model (Marshall et al. 1985, Gopalaratman and Shah 1987, Li 1992), we can write it asmax
e
P dL
(1)
or
max
e
P d
L
(2)
where Pmax is the maximal pullout load before the debonding process is over, d the fiber diameter and Le the embedded length. If
is constant, then the right term in Equation 2 is also constant. We denote the initial stiffness of the spring at the end of debonding process asmax i
e
P
k d
L
(3)
( ) (s)
(s)s
i e
k L s
k
n
(4)
where n(s) is the number of effective springs. Using the spring stiffness determined in previous load step, we compute current slip displacement s and know the position of the fiber end node or how much nodes on the matrix side has been exceeded by the fiber end node, then, the number of effec-tive springs can be accounted as the total nodes number on the matrix side minus the nodes num-ber exceeded by the finum-ber end node (Figure 3). In this way, we can get the springs stiffness, ki, for the next load step through Equation 4.
Figure 3: Determination ofEffective springs.
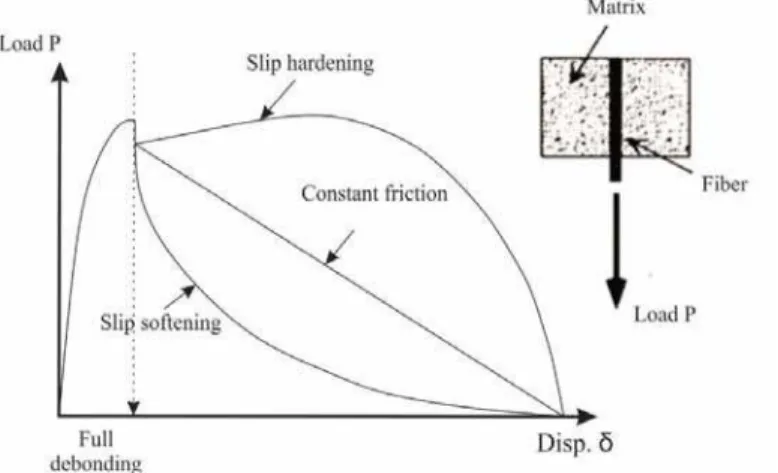
However, the constant
model is not suitable to describe the fiber pullout, since there is ample evidence which shows that the shear stress varies with the interface slip displacement and causes slip-hardening or slip-softening (Figure 4) as reported by Li and Stang (1997), Lin and Li (1997) and Wang et al. (1988). The variation may be attributed to several factors such as fiber surface abrasion, interface roughness, matrix plasticity, fragmentation of fibers coatings at the interface, etc.In these cases, the spring stiffness is also a function of the variation of the shear stress and thus, we propose the spring stiffness as
( ) ( )
(s)
( ) e
s d L s
k
n s s
(5)
Using this relation, we can simulate the pullout of fibers in different types, for example, steel fi-ber with slip softening behavior, as seen in the experimental works of Naaman and Shah (1976) and Li et al. (1991) and synthetic fibers with slip hardening behavior commonly observed in this fiber type, where the interfacial stress increases with slip distance (Wang et al. (1988), Li et al. (1995) and Ting et al. (2015)). This hardening behavior is due to wear between the surfaces, occurring at the moment when low hardness fibers try to slide over the stiffer matrix, a resistance to movement is imposed by the accumulation of the fiber debris, and thus increases the interface shear stress. These characteristics bring us a comprehensive model for simulating a great number of cases and helping to evaluate others factors such as fiber bridging stress and toughening.
3 COMPUTER ANALYSIS PROCEDURE
The MATLAB is a powerful program that offers not only different optimization algorithms already implemented but also the possibility of conducting an optimization algorithm defined by the user. Thus, the interactive use of the MATLAB and the ANSYS allows the user to fully control and op-timize the simulation in order to get the best results as soon as possible.
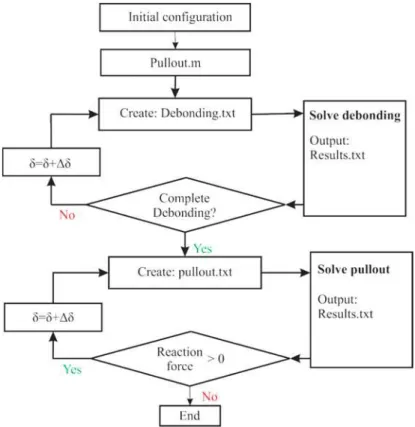
Figure 5 shows the computational procedure made in this work. We performed simulations us-ing the commercial software ANSYS® 11.0. With the aid of MATLAB® R2012a software, we shortened the simulation time and facilitated switching between debonding and pullout processes and taking the loop of the displacement δ applied at the right end of the fiber (Figure 3).
Following the procedure, first, we start the subroutine pullout.m in Matlab and create the text file "debonding.txt" by introducing an initial small displacement δ about 0.01 mm. The txt file con-tains the commands in ANSYS Parametric Design Language (APDL), which generate the geometric model, mesh and displacement restrictions of the model and finite element solution in batch mode. The displacement restrictions are imposed on the boundary of matrix cylinder.
As a result, the ANSYS yields the file "Results.txt" in two columns: the first for the applied displacement δ and the second for the reaction force obtained as the sum of the reactions at the displacement prescript nodes. If debonding is over, the reaction force will drop to zero. Therefore, after the computation of current load is accomplished, we check whether the reactions sum is zero in order to verify whether debonding has been finished. If not yet, we increase the displacement by an amount same as the initial displacement applied. The new results are stored as a new line in the "Results.txt" file.
springs n(s) as shown in Equations 4 or 5 and alters the spring stiffness, depended on what shear stress behavior is expected. Following this, a new larger displacement δ is added. The modeling is kept on until no effective spring is available, which means that the pullout process is over.
Figure 5: Computational procedure for fiber pullout.
4 RESULTS AND DISCUSSION
4.1 Debonding Process
The cohesive zone model consists of a constitutive relationship between tractions T acting on the interface and the corresponding separation distances i.e. displacement jump Δ across the interface (Lin et al. 2001). The use of cohesive zone allows a better control over the debonding process. As soon as the final separation is accomplished, the pullout process will start.
In the present work, the fiber-matrix interface was based on the exponential failure model of Xu and Needleman (1994) and the modeling was accomplished through commercial finite element soft-ware ANSYS 11.0 where for interface separation, only three parameters are needed: (1) maximum normal stress max at the interface; (2) normal characteristic length n and (3) tangential charac-teristic length t.
interface parameters used, are listed in Table 1. Since there is little information on the tested spec-imens, we assume that the matrix is 1.43 mm in diameter and 12 mm in length, approximately corresponding to fiber volume fraction 2%.
Fiber Matrix Interface debonding
df Lf Ef ν fca Em ν maxc nb
b t
(mm) (mm) (GPa) (MPa) (GPa) (MPa) (mm) (mm)
0.204 12 210 0.3 36.5 34 0.2 2.54 0.012 0.12
a
By experimental test from Leung and Shapiro (1999) where the elastic modulus was 30 GPa; bEstimate; cBy Li and Mobasher (1998).
Table 1: Mechanical and geometrical properties of the specimen considered.
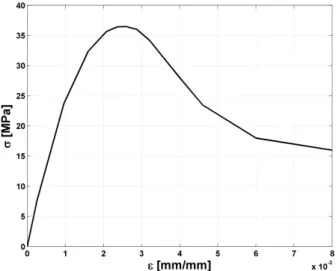
The matrix is characterized by the stress-strain curve in compression, as shown in Figure 6, with the maximum compressive strength equal fc. We suggested a curve and implanted it into the ANSYS in order for the modeling to be more realistic.
Figure 6: Stress-strain curve in compression suggested for the concrete.
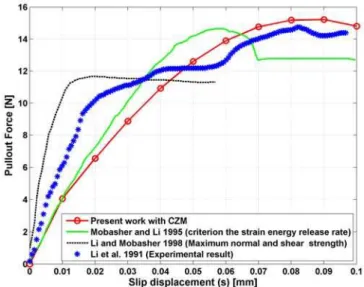
The obtained results are compared with the experimental test of Li et al. (1991) and the two numerical models of Mobasher and Li (1995) and Li and Mobasher (1998) (Figure 7). These two numerical models dealt the interface in different manners. The first developed a theoretical model of interface failure based on the criterion of maximum strain energy release rate applied to a partially debonding length; meanwhile, the second dealt the interface as a third linear elastic phase of the composite, where the debonding criterion is given by integrating maximal normal and shear stresses into the finite element method.
the other numerical models can not extend to a sufficient slip displacement and the debonding pro-cess is ended too early. Furthermore, our pullout force peak appears at an instant closest to the experimental one. The maximal peak load obtained in the debonding process is a very important parameter for the pullout modeling, as shown in Equation 3, because it determines the initial spring stiffness that would compromise the results.
Figure 7: Comparison of pullout force vs slip displacement of present work, Mobasher and Li (1995), and Li and Mobasher (1998) with the experimental test of Li et al. (1991).
To check whether the slip displacement step size affects the pullout force, we repeated the com-putation and plot Figure 8 bellow with slip displacement in different step sizes. From Figure 8 we see that the slip displacement step size doesn’t affect the pullout force. This coincides with our intuition that the slip displacement step size shouldn’t influence the pullout force.
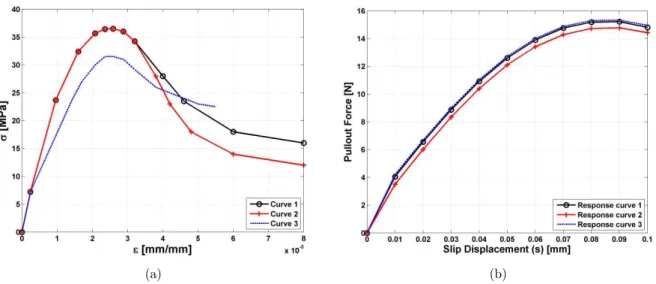
It has been verified that implanting the curve of stress-strain for concrete in compression into the ANSYS is indispensable. If the matrix phase is considered only as linear elastic, the results will be overestimated. Figure 9 shows the influence of three different concrete compressive curves on the pullout load. As observed, although the compressive curves are different, there is the unnoticeable difference in the responses obtained. It is not yet clear why there is little difference among the re-sponses of the three compressive curves. Perhaps, the response is mainly depended on the interface performance parameters max, n (normal separation characteristic length) and t (tangential sep-aration characteristic length) as well as the matrix stiffness. However, there is an obvious difference between the response of linear elastic curve and the ones of the real compressive curves, which have the softening characteristic that inhabits continue raise of pullout load after the peak load reaches
Pmax. The curve 2 with a lower residual strength after the peak stress presents a slightly lower re-sponse than the others do.
(a) (b)
Figure 9: Influence of stress-strain compression curve of concrete on the pullout force. (a) Different concrete compressive curves. (b) Responses of pullout force.
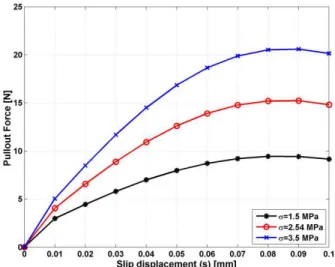
Figure 10 shows the influence of the interface strength (max) during the debonding process. We note there is a significant increase in the maximum pullout force with increasingmax.
Figure 10: Influence of the interface strength max with the interface characteristic parameters 0.12
t mm
and n 0.012mm.
As the debonding predominantly occurred in the tangential direction, we also investigated the influence of tangential separation characteristic length t on the pullout force. The curves of the pullout force versus slip displacement show an inverse relationship between the maximal pullout force and the interface characteristic length (Figure 11). This relationship may be attributed to the cohesive law of Xu and Needlemann (1994) used by the ANSYS, which imposes the conservation of the works realized by normal and tangential separations, resulting in the increase of shear stress and pullout force when the interface characteristic length decreases.
Figure 11: Influence of the tangential separation characteristic length t, considering
max 2.54
4.2 Pullout Process
4.2.1 Slip Softening Modeling
As seen, the debonding process is represented very well by exponential failure model. Since the ex-perimental test of Li et al. (1991) did not show the pullout process, thus, we validated the pullout model (Equation 4) by means of the experimental test of Leung and Shapiro (1999) who investigat-ed the influence of steel fibers with different yield strengths (fy). To simulate the slip softening
behavior commonly observed in the composite reinforced by steel fibers, an appropriable interface shear stress model
(s) should be introduced into the Equation 4.In this work, after debonding process is accomplished, we adopted the relationship
(s) suggest-ed by Fantilli and Vanilli (2003) (Figure 12a) as:1
( )
max 1
( ) ( ) kc s s
fin fin
s e if s s
(6)
where,
max is the maximum shear stress (Equation 1); s the slip displacement, which is approxi-mately equal to the applied displacement; s1the applied displacement just immediately beforedebonding process was completed;
fin is the asymptotic value of shear stress and kc a coefficient.These latter two parameters given in Figure 12b are dependent on fiber type and its manufacture process. There is the difference between the present work and of Fantilli and Vanilli in the determination of parameters s1 and
max. Fantilli and Vanilli (2003) estimated s1 and defined
maxas function of fiber diameter and the concrete compressive strength. We got s1 and
max in a morenatural manner through simulating debonding process and identifying when the debonding process was over and the respectively applied displacement and maximal pullout force. It is clear that all these parameters rely on the CZM and the results obtained from the modeling of the debonding process, which is fundamental to complete the following modeling of fiber pullout process.
Figure 12: (a) Bond-slip relationship; (b) Bond parameters used by Fantilli and Vallini (2003).
compressive strengths of the matrix respectively. The required stress-strain relationship for concrete in compression is the same as in Figure 6, used for the debonding process validation. The composite has 0.05% of fiber volume fraction, which is defined here by the ratio of the volume of a single fiber to the matrix volume mentioned in section 4.1.
Fiber Matrix Interface debonding
df Lf/ Le Ef νf fca Em ν maxc nb
b t
(mm) (mm) (GPa) (MPa) (GPa) (MPa) (mm) (mm)
0.5 20/10 210 0.3 36.5 30 0.15 2.54 0.35 0.45
a
By experimental test from Leung and Shapiro (1999) where the elastic modulus was 30 GPa; bEstimate; cBy Li and Mobasher (1998).
Table 2: Mechanical and geometrical properties of the specimen by Leung and Shapiro (1999).
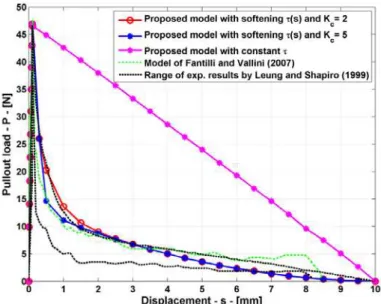
The comparison of results from the pullout process modeling is demonstrated in Figure 13. It is clear that the constant- model causes large discrepancies and the model of considering the inter-face shear as a function of the slip displacement, associated to maximum pullout load obtained in the debonding process, is more suitable for modeling pullout process. The model proposed in this work presents a good agreement with experimental result, especially when the slip displacement is larger than 2 mm. Therefore, the use of spring elements for simulating interface is able to control interface performance.
In comparison, our result and the analytical result of Fantilli and Vanilli (2007) are similar. With kc=2 as used by Fantilli and Vanilli, our result prevails against the one of Fantilli and Vanilli only when the slip displacement is larger than 2 mm. However with kc=5, our result is closer to the experiment curve over the whole pullout process.
4.2.2 Slip Hardening Modeling
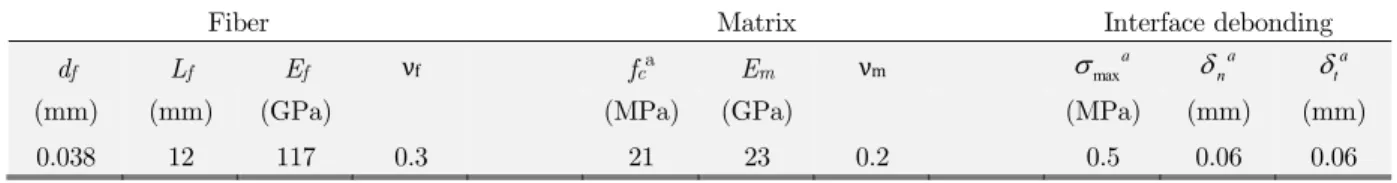
To exemplify interface slip hardening behavior we referred the experimental test of Li et al. (1995) where polyethylene fibers were added into a cement matrix. The geometric and mechanical proper-ties of fiber, cement matrix, and interface parameters are listed in Table 3. The composite has 2% of fiber volume fraction.
Fiber Matrix Interface debonding
df Lf Ef νf fca Em νm maxa na
a t
(mm) (mm) (GPa) (MPa) (GPa) (MPa) (mm) (mm)
0.038 12 117 0.3 21 23 0.2 0.5 0.06 0.06
a
Estimate.
Table 3: Mechanical and geometrical properties of the specimen considered.
For the comparison, the same experimental test was referred to the analytical model of Lin and Li (1997) with a simple interface constitutive relationship adopted from Bao and Song (1993) to quantify the slip-hardening interface behavior, which is:
0
( )s (1 s d/ )f
(7)
where the df is fiber diameter, 0
the frictional sliding shear stress at the tip of debonded zone where no slip occurs and
a dimensionless hardening parameter. The latter two parameters need to be determined empirically.In terms of Equation 7, Lin and Li (1997) derived the pullout load:
2 (1 ) ( )
sinh sinh (1 )( )( ( ))
f o o
o o o
f f
d L s s
P s s L s s
d d
(8)
where
2
, 4(1 ) / , cosh 1
f f f
o f o
m m f
V E d L
E s
V E d
(9)
This work adopted the slip hardening model created by Wang et al. (1998). The relationship between interface shear stress and slip displacement s in Equation 4 was taken as a quadratic function of s:
0 1 2
( )s a a s a s²
(10)
Figure 14 gives the comparison of the results. Clearly, the proposed model produces an alike but better fiber pullout curve than the curves of Lin and Li (1997), who used an optimal parameter
0.0125
, before the load hits its maximum. After the load attains the maximum, all the modeled curves deviate from the experimental curve, since the experimental curve is not quadratic. As seen, the
parameter is very sensible. To adequate value, many trials should be done. This is an uneasy matter.
with a value larger than 0.015 or less than 0.005 leads larger deviation from the experi-ment. With
0.0125, you get a good approximation to the experiment before the peak load but large deviation after then; with
0.0085, you have the inverse result. In comparison, our model has no need of trials but requires three load values. The first value is available automatically when the debonding is complete; the second value is fit to the maximal experimental one, and the third one is P=0 when the full fiber is pulled out from the matrix. Among the three values, only the sec-ond one is obligated to the experiment, the others are acquired naturally. With these three values, we got a better approximation to the experiment. Therefore, we can say that the presented model integrated into the ANSYS is suitable for the modeling because it is more simple but capable of describing very well the fiber pullout process.Figure 14: Comparison of results of the proposed model with the experimental test of Li et al. (1995) and the analytic model of Lin and Li (1997) with different
values.5 REMARKS
As satisfactory results were obtained in the modeling, the following techniques are suggested to realize continuous modeling of fiber pullout process:
• The compression test curve of the matrix material with a residual strength after peak load must be integrated into the modeling because linear elasticity behavior brings about super stiffness and leads modeling to fail.
• For pullout process, the use of spring elements with variable stiffness, which is associated to interface shear stress as a function of interface slip displacement through Equation 4 or 5 proposed in this work, prevails over contact elements and allows for modeling different inter-face shear behavior such as slip softening or hardening and constant shear.
Though we have realized the modeling by means of the ANSYS, the points given above may be included in any finite element programming for continuous modeling of fiber pullout process. The suggested computational procedure with the interaction of the ANSYS and the MATLAB can re-duce substantially the time consumption in computation, which is of great advantage when there are a large number of parameters involved. With the presented technique, we are able to model toughening achieved by randomly distributed fibers.
Acknowledgement
The authors acknowledge the Brazilian Federal Agency for the Support and Evaluation of Graduate Education (CAPES) for its finance support in this work.
References
Bao, G. and Song, Y., (1993). Crack bridging models for fiber composites with degraded interfaces, Journal Mechani-cal Physics and Solids 41: 1425-1444.
Beckert, W. and Lauke, B., (1997). Critical discussion of the single-fibre pull-out test: does it measure adhesion, Composites Science and Technology 57: 1689–1706.
Fantilli, A. P., and Vallini, P., (2003) A cohesive model for fiber-reinforced composites. In: Proceedings ISEC-02 Conference, Balkema, 1443–1449.
Fantilli, A. P., and Vallini, P., (2007). A cohesive interface model for the pullout of inclined steel fibers in cementi-tious matrices, Advanced Concrete Technology 5(2): 247–258.
Fantilli, A. P., Vallini, P., (2008). A cohesive interface model for the pullout of inclined steel fibers in cementitious matrices, Journal of Materials in Civil Engineering 20: 588-598.
Gopalaratnam, V. S., Shah, S. P., (1987) Tensile failure of steel fiber-reinforced mortar, Journal of Engineering Mechanics 113(5): 635-652.
Kanda, T., Lin, Z. and Li, V.C., (2000). Tensile stress-strain modeling of pseudo strain hardening cementitious com-posites, ASCE Journal of Materials in Civil Engineering 12(2): 147-156.
Kim, J.K. and Mai, Y.W., (1998). Engineered Interfaces in Fiber Reinforced Composites, Elsevier, Oxford.
Leung, C. K. Y. and Shapiro N., (1999). Optimal steel fiber strength for reinforcement of cementitious materials, Journal of Materials in Civil Engineering 112: 116–123.
Li, C.Y. and Mobasher B., (1998). Finite element simulations of fiber pullout toughening in fiber reinforced cement based composites, Advanced Cement Based Materials 7: 123-132.
Li, V. C. and Stang, H., (1997). Interface property characterization and strengthening mechanisms in fiber reinforced cement based composites, Advanced Cement Based Materials, 96-l.
Li, V. C., Wang, S., and Wu, C., (2001). Tensile strain-hardening behavior of polyvinyl alcohol engineered cementi-tious composite (PVA-ECC), ACI Materials Journal 98(6): 483–492.
Li, V. C., Wu, H. C. and Chan, Y. W., (1995). Interfacial property tailoring for pseudo strain-hardening cementitious composites, In Advanced Technology on Design and Fabrication of Composite Materials and Structures 261-268. Li, Z., Mobasher, B. and Shah, S. P, (1991). Characterization of interfacial properties of fiber reinforced cementitious composites, Journal of the American Ceramic Society 73(9): 2156-2164.
Lin, G., Geubelle. P.H. and Sottos. N.R., (2001). Simulation of fiber debonding with friction in a model composite pushout test, International journal of solids and structures 38: 8547-8562.
Lin, Z. and Li, V. C., (1997). Crack bridging in fiber reinforced cementitious composites with slip-hardening interfac-es, Journal of the Mechanics and Physics of Solids 45(5): 763-787.
Liu, H.-Y., Zhang, X.Y, -W. Mai and X.-X. Diao, (1999). On steady-state fibre pull-out II. Computer simulation, Composites Science and Technology 59: 2191–2199.
Marshall, D.B., Cox, B.N. and Evans, A.G., (1985). The mechanics of matrix cracking in brittle matrix fiber compo-sites, Acta Metall 33(11): 2013-2021.
Mobasher, B., and Li, C.Y., (1995). Modeling of stiffness degradation of the interfacial zone during fiber debonding, Composites Engineering 5(10-11): 1349-1365.
Naaman, A.E. and Shah, S.P., (1976). Pullout mechanisms in steel fiber reinforced concrete, Journal of structural engineering (ASCE) 102(8): 1537–1548.
Pochiraju, K.V., Tandom, G.P. and Pagano, N.J., (2001). Analyses of single fiber pushout consider interfacial fric-tion and adhesion, Journal Mechanical Physics and Solids 49: 2307–2338.
Rodrigues, E.A., Manzoli, O.L., Bitencourt, L.A.G., Prazeres, P.G.C. and Bittencourt, T.N., (2015), Failure behavior modeling of slender reinforced concrete columns subjected to eccentric load, Latin American Journal of Solids and Structures 12: 520-541.
Ting, H., Zhang, Y. X., Su, Cheng. and Lo, S. R., (2015). Effect of Slip-Hardening Interface Behavior on Fiber Rup-ture and Crack Bridging in Fiber-Reinforced Cementitious Composites, Journal of engineering mechanics 1-14. Tsai, J., Patra, A.K. and Wetherhold, R. (2005). Finite element simulation of shaped ductile fiber pullout using a mixed cohesive zone/friction interface model, Composites: Parte A 36: 827-838.
Wang C. and Friedrich L. F., (2013). Computational model of spalling and effective fibers on toughening in fiber reinforced composites at an early stage of crack formation, Latin American Journal of Solids and Structures 10: 797-811.
Wang Y., Li, V. C. and Backer S., (1988). Modeling of fiber pullout from a cement matrix. Composites, The interna-tional journal of cement composites and lightweight concrete 10(3): 143-149.
Wei, G. Liu, G. Xu, and C. X. Sun, (2012). Finite element simulation of perfect bonding for single fiber pull-out test, Advanced Materials Research 418–420: 509–512.
Xu, X.P. and Needleman, A., (1994). Numerical simulation of fast crack growth in brittle solids, Journal of the Me-chanics and Physics of Solids 42: 1397–1434.