Original article (short paper)
Metabolic proile and spontaneous physical
activity modulation under short-term food
restriction in young rats
Wladimir Rafael Beck Pedro Paulo Menezes Scariot
Stefânia Santos do Carmo Fúlvia Barros Manchado-Gobatto
Claudio Alexandre Gobatto
Universidade Estadual de Campinas, Limeira, SP, Brasil
Abstract — Aims: The aim of this study was to investigate the effects of short-term food restriction (6-weeks) on metabolic
proile and spontaneous physical activity (SPA) of young male Wistar rats. Methods: Thirty rats had their baseline SPA
measured at 21 days-old and were separated into two groups at 28 days-old: Control (CG) and 50% of food restriction
(FR). The food restriction protocol lasted six weeks, being the SPA measured weekly by a gravimetric apparatus. At the end of the experiment, biochemical analyses were performed in serum and tissue samples with statistical signiicance set at 5%. Results: FR showed less SPA than CG, as occurred for body mass, water intake, adipose tissue and liver, heart and soleus glycogen, serum glucose, total protein, triglycerides and total cholesterol (P<0.05). Conclusion: Data set demonstrates that low substrate stores signaled to decrease spontaneous physical activity to save energy.
Keywords: spontaneous activity, food restriction, gravimetric apparatus, rats.
Introduction
Spontaneous physical activity (SPA) comprises all movements performed without consideration of the volitional or forced physical exercise 1, which represents an important component
of the total daily energy expenditure 2 and consequently to the
control of energy balance and fat mass storage 3. Therefore, efforts
in order to identify the mechanisms involved in SPA regulation have been made 4 and despite the recognition of some peptides,
hormones, their targets and communication 4, the complex control
of SPA currently remains under investigation 5, 6, 7.
Santos-Pinto 8 consistently postulated that the total daily
energy expenditure, which is given by the sum of energy spent through thermic effect of food, resting metabolic rate and physi -cal activity 9, is modulated in relation to food intake 8. It is well
established that disproportional energy intake in relation to energy spent towards positive energy balance chronically leads to
cata-strophic consequences, irstly characterized by obesity and then ectopic fat deposition in many tissues, such as liver, kidney and heart, promoting insulin resistance and metabolic syndrome. The
alarming growth of this scenario around the world called for
stud-ies employing protocols to reduce the energy intake, to increase the energy expenditure, or both simultaneously. Food restriction (FR) protocols have been extensively employed in this context.
Martin 2 postulated that it is unclear if the effect of calorie
restriction in SPA is its reduction. Indeed, some authors conirm
this statement 10, 11, 12, 13 and others found the inverse outcome 14, 15, 16, 17. Such different statements are certainly also due to the em -ployment of distinct protocols for calorie restriction with different
durations. It has also been described that an acute increase of SPA
during FR in rats is due to the increased activity hypothalamic
neuropeptides, which is a transient behavior motivated by food
seeking 18 and literature suggests that if FR is chronically
main-tained it leads to a decrease in SPA 18. In this regard, an interesting
idea of a mechanism to save energy in times of FR was proposed
8, being recently improved by involving neuronal, endocrine and
metabolic elements 4.
Whereas it is obvious that eficiency in fuel utilization of
mammals is higher in long-term food restricted animals 19, it is
not clear whether differences regarding SPA also exist in short
periods of FR. Furthermore, it is not known to date how FR could affect metabolic responses in young rats. This is a critical issue because eating disorders, e.g. anorexia nervosa and bulimia nervosa, and depression are more prevalent in young populations,
which intentionally restrict caloric intake to substantially reduce body weight 20.
Based on such background, the aim of this study was to in -vestigate the effects of short-term food restriction (6-weeks) on
metabolic proile and SPA of young male Wistar rats.
Material and Methods
Animals
We assessed thirty 21-day old male Wistar rats obtained from
the institutional facility. The animals were housed (ive per cage of 41 x 34 x 16 cm) at 21±1°C, 45-55% of air relative
humidity and light/dark cycle of 12/12h with lights turn on at
06:00h. The experiment was conducted after approval of the
institutional ethics commission on the use of animals to research
Experimental design
The irst procedure employed was the measurement of total daily amount of food consumed during a week by 21-day old rats. Then,
the animals were randomly separated into two identical groups at
28-days old. The control group (CG; n=15) was fed with balanced standard rodent chow (Nuvilab®, Brazil) ad libitum, while the food restriction group (FR; n=15) received 50% of the CG food, relativized by body mass. Body mass, food and water intake and
spontaneous physical activity were measured once a week at each
cage, during six weeks, being food, water intake and spontaneous physical activity correspondent to 24h-period.
Spontaneous physical activity measurement
The spontaneous physical activity (SPA) was measured weekly using a gravimetric method that allows the assessment at a normal
cage and absolutely no perception by the rats, according to Beck
21. SPA of rats was measured for 24 h for each group. Animal`s
cages were placed on two iron platforms where a load cell was
ixed between them (PLA30Kgf, Lider Balanças ®). The signal was ampliied (MKTC5-10®, MK control and instrumentation™)
and then processed through analog/digital conditioning module
(USB-6008®). Signals were collected at a frequency of 30 Hz using LabView Signal Express® software (National Instruments™). The signal acquisition system was calibrated by applying known mass.
Regression equations (R2= 0.99) were then computed enabling
conversions of milivolts (mv) signals to kilograms (kg) units.
Obtaining and storage of biological material
At the end of the experiment 71-day old animals were anesthe
-tized with sodium thiopental (30-40mg/Kg, intraperitoneal) and after conirming the absence of caudal and pupillary relex were euthanized by thoracotomy followed by diaphragm rupture. Blood samples were collected through cardiac puncture, centrifuged at
3000RPM for 15 minutes and the serum was stored at -80°C in
aliquots to avoid future thaw cycles for biochemical analysis. The
animals remained in the regular food regime before euthanasia
according to each group, in order to analyze the six-week effects on blood and tissues. Moreover, the euthanasia followed similar time of day to avoid any chronobiologic interference.
After blood collection, we extracted tissue samples from the liver, heart, white gastrocnemius, soleus, interscapular brown
adipose tissue and visceral white adipose tissue (summation of
epididymal and retroperitoneal white adipose tissue). The procedure
was conducted in less than 10 minutes by two experienced
research-ers, being the tissue samples immediately stored in liquid nitrogen.
Biochemical analysis
Serum glucose, triglycerides, total cholesterol and total protein
were analyzed using colorimetric kit (In vitro DiagnósticaLtda®,
Itabira, MG, Brazil). All of the analyses were performed in a mi
-croplate reader (ASYS Expert Plus UV, Biochrom, Cambs, CB4
0FJ, UK) and the measured absorbance were normalized against a calibration curve based on the manufacturer's instructions.
Free fatty acids levels were determined using the Regouw`s
method 22. 0.2 ml of serum was added to 7 ml of the solvent mixture
containing chloroform, heptane and methanol at a ratio of 28: 21: 1, followed by vigorous shaking and centrifugation. The precipitate
at the bottom of the tubes was aspirated and transported to other
tubes, added to a solution containing copper (II) nitrate [0.05 M], triethanolamine [0,10], sodium hydroxide [0,035 N] and sodium chloride [35%] at pH 8.1, followed by further shaking and centrifu
-gation. Finally, 3.0 ml of the precipitate was aspirated and added to 0.5 ml of sodium diethyldithiocarbamate solution. The FFA concentration was 435 nm against palmitic acid calibration curve.
The liver (500 mg), heart, soleus and gastrocnemius muscles (200–250 mg) were digested in potassium hydroxide. Sodium sulfate was added and the precipitated glycogen was puriied using ethanol [70%]. The glycogen concentration was analyzed accord
-ing to a colorimetric method us-ing 10 μL of phenol and 2.0 mL of sulfuric acid with absorbance at 490 nm, according to Dubois 23.
Statistical analysis
Data were described in means and standard error of the means. Data normality was tested using Kolmogorov-Smirnov test. Independent t tests were used to compare the differences between groups (control and food restriction) for the variables measured
after six weeks of experiment. Measurements taken over multiple weeks, such as SPA, body mass and food and water intake were
analyzed by factorial two‐way ANOVA to determine the main
effects (time and diet effects) and interaction. Newman-Keuls post hoc test was used when appropriate. Statistical signiicance was set at 5%.
Results
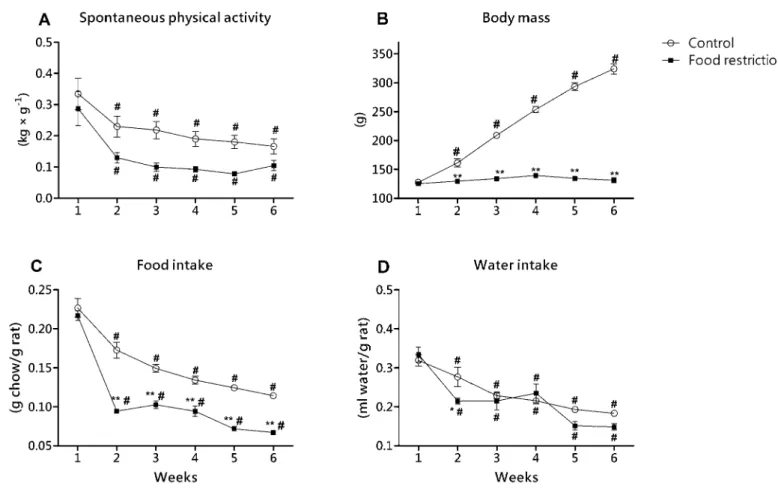
Figure 1 shows data obtained during six weeks of experiment. Although signiicant differences were not found in the same week in the measurement between groups (P>0.05), food restriction group (FR) showed less SPA than control group (CG), demonstrating the diet effect on SPA outcomes (F=27.95; P<0.01; Figure 1A). Analyzing all the animals, there was also signiicant decrease in SPA during the experiment (six weeks) (F=11.39; P<0.01), lead
-ing to no signiicant interaction between diet and time for this parameter (F=0.45; P=0.81).
Body mass was signiicantly higher in CG than FR from the second week onwards (P<0.01), showing signiicant diet effect on body mass (F=1041.6; P<0.01; Figure 1B). Body mass increased through time (F=118.36; P<0.01), however, the FR group did not change the body mass when we compared all the weeks (P>0.05), whereas CG increased body weight every week, statistically from the second week onwards (P<0.01). These results lead to a signiicant interaction between diet and time for body mass (F=102.28; P<0.01).
signiicant decrease in relative food intake throughout the experi
-ment (F=115.29; P<0.01). We found signiicant interaction between diet and time effects for relative food intake (F=6.16; <0.01).
The FR group also shows a decrease in relative water intake
for FR in relation to CG during the experiment (F=4.99; P=0.03; Figure 1D). We also found a decrease through time (F=26.18; P<0.01) without interaction between effects.
Figure 2 illustrates the results from adipose tissue extracted
at the end of the six-week experiment. The epididymal and ret
-roperitoneal summation, relative to body mass, was higher for
Figure 1. Data obtained during the six-week experiment for the control and food restriction groups; * P<0.05 in relation to control group to the same week; ** P<0.01 in relation to control group to the same week. # P<0.05 in relation to the irst week for the same group.
CG than FR (Figure 2A), whereas the relative brown adipose tissue showed no differences between groups (Figure 2B).
Except for the white gastrocnemius, the glycogen of all other tissues showed signiicant differences between groups in the end of the experiment (Figure 3).
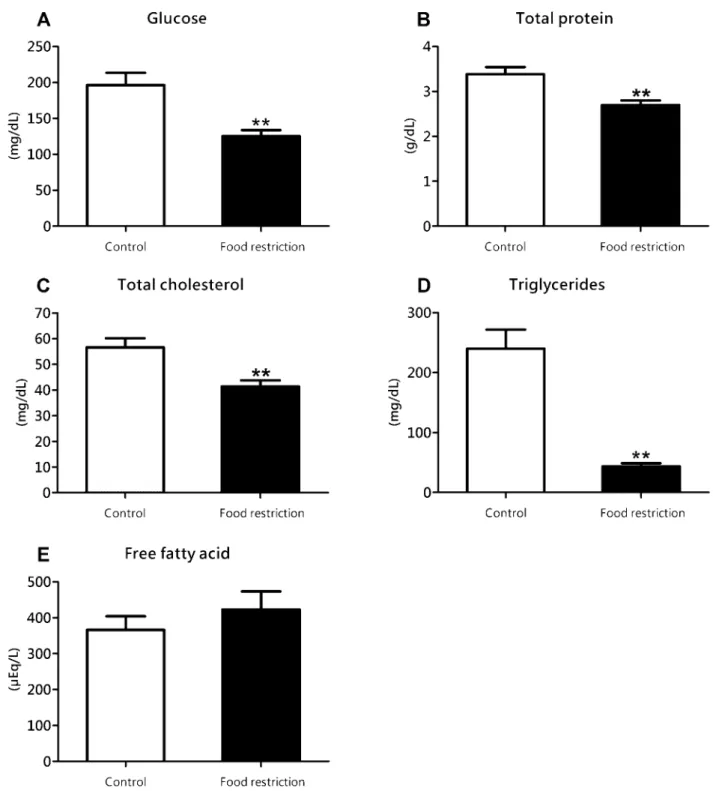
The serum parameters were signiicantly modiied by the diet employed, as showed in igure 4.
Discussion
The main indings of the present study were that the short-term food restriction adopted leads to a signiicant decrease in SPA and signiicant modulations for the metabolic proile of the rats through time.
Regarding the spontaneous physical activity, our results
were in agreement with some authors 10, 11, 12, 13 but in discor-dance with others 14, 15, 16, 17. The classic behavior towards acute increase of SPA under food restriction 18 was not observed in
our experiment, and indeed, SPA signiicantly decreased through time. The lack of interaction between diet and time was found
probably due to the apparent higher decrease in SPA for FR
through time, when compared to smaller decrease in SPA for CG. In fact, behavior observed in our experiment follows the
hypothesis of Santos-Pinto 8, who attribute the lower oxygen
Figure 3. Glycogen measurements in the liver (Figure 3A), heart (Figure 3B), white gastrocnemius (Figure 3C) and red soleus (Figure 3D) for control and food restriction groups in the end of the experiment. ** P<0.01 in relation to control group.
consumption with saving energy for rats under food restriction
protocol, a behavior probably triggered by low energy stores in
communication with brain neuropeptides responsible for SPA
modulation. It is interesting to note that the important SPA dif -ferences between groups through time occurred independent
of brown adipose tissue (Figure 2), which is associated with
thermogenesis 24 and likely modulations of locomotion.
Relative food and water intake were lower for the food
restriction group, as well as absolute body mass. However,
when considering all of the animals of the experiment we found
an increase in body mass through time. It occurred at a
diet-dependent manner since when comparing the same group through time we found statistical increase in such parameter only for the
control group. The decrease in food intake was dependent of the diet employed, as expected. Probably the decrease in relative
food intake occurred also due to the disproportional increase in
body mass in relation to food intake of the CG. It is interesting
to note that the relative food intake behavior was similar to the
spontaneous physical activity, in which the FR group showed apparent higher decrease than CG (Figure 1). Other interesting
result was that the decrease in relative water intake through time
Figure 4. Serum concentration of glucose (Figure 4A), total protein (Figure 4B), total cholesterol (Figure 4C), triglycerides (Figure 4D) and free fatty acid (Figure 4E) determined at the end of the experiment for control and food restriction groups; ** P<0.01 in relation to control group.
The lower food availability leads to lower white adipose tissue
for FR group, probably due to the use of this energy for replace
-ment of poor food intake, as occurred for the liver glycogen and serum glucose, triacylglycerol and cholesterol. In periods
of food restriction it was described a change from glycolytic to oxidative muscles 19 and it is known that the glucose uptake by
the oxidative muscles increases during food restriction 25, so, it
is expected a decrease in serum glucose followed by decrease
in the liver glycogen, as classically described to glycidic liver
metabolism 26. That glucose uptake by the oxidative muscles
also leads to an increase in glycogen stores for heart and soleus, as found in our experiment. Therefore, observing the big picture of the metabolic status, FR forced the organism balancing and reallocating substrates to survive, showing a high eficiency on energy usage, corroborating with some authors statements4,19.
Allthose modulations of metabolic and locomotor activity discussed above have been associated with neural
communica-tion, being the neuropeptide Y (NPY) and agouti-related peptide
during food restriction there is no possibility of feeding and it is
possible that those signals persist. If correct, the consequences of chronically higher activity of NPY and AgRP in this case, with no food available, can be the inhibition of thermogenesis 24 and
SPA 18 when trying to promote positive (or less negative) energy
balance and maybe inluencing the eficiency of energy usage 4, 19.
In summary, our experiment showed that even short-term food restriction of 50% imposes signiicant modulations on the metabolic proile towards the use of energy stores preferably in oxidative tissues of young rats. This condition led to lower energy stores, which literature postulated that increases signaling for NPY and AgRP activity in the arcuate nucleus of hypothalamus,
promotes a downstream signaling that consequently decrease
the spontaneous physical activity. Such scenario occurs in the effort to establish a positive energy balance, which was not possible due to the diet regime employed.
References
1. Garland T, Jr., Schutz H, Chappell MA, Keeney BK, Meek TH, Copes LE, et al. The biological control of voluntary exercise, spontaneous physical activity and daily energy expenditure in relation to obesity: human and rodent perspectives. J Exp Biol. 2011;214(2):206-29.
2. Martin CK, Heilbronn LK, de Jonge L, DeLany JP, Volaufova J, Anton SD, et al. Effect of calorie restriction on resting metabolic rate and spontaneous physical activity. Obesity 2007;15(12):2964-73.
3. Levine JA, Lanningham-Foster LM, McCrady SK, Krizan AC, Olson LR, Kane PH, et al. Interindividual variation in posture allocation: possible role in human obesity. Science. 2005;307(5709):584-6.
4. Pluger PT, Castañeda TR, Heppner KM, Strassburg S, Kruthaupt T, Chaudhary N, et al. Ghrelin, peptide YY and their hypotha -lamic targets differentially regulate spontaneous physical activity. Physiol Behav. 2011;105(1):52-61.
5. Machado FS, Rodovalho GV, Coimbra CC. The time of day differently inluences fatigue and locomotor activity: is body temperature a key factor? Physiol Behav. 2015;140(1):8-14. 6. Wilson JL, Enriori PJ. A talk between fat tissue, gut, pan
-creas and brain to control body weight. Mol Cell Endocrinol. 2015;418(2):108-19.
7. Webber ES, Bonci A, Krashes MJ. The elegance of energy balance: Insight from circuit-level manipulations. Synapse. 2015;69(9):461-74.
8. Santos-Pinto FN, Luz J, Griggio MA. Energy expenditure of rats subjected to long-term food restriction. Int J Food Sci Nutr. 2001;52(2):193-200.
9. Hill JO, Wyatt HR, Peters JC. Energy balance and obesity. Circulation. 2012;126(1):126-32.
10. Chausse B, Solon C, Caldeira da Silva CC, Masselli Dos Reis IG, Manchado-Gobatto FB, Gobatto CA, et al. Intermittent fasting induces hypothalamic modiications resulting in low feeding eficiency, low body mass and overeating. Endocrinol. 2014;155(7):2456-66.
11. Heilbronn LK, de Jonge L, Frisard MI, DeLany JP, Larson-Meyer DE, Rood J, et al. Effect of 6-month calorie restriction on bio-markers of longevity, metabolic adaptation, and oxidative stress in overweight individuals: a randomized controlled trial. JAMA. 2006;295(13):1539-48.
12. Kemnitz JW, Weindruch R, Roecker EB, Crawford K, Kaufman PL, Ershler WB. Dietary restriction of adult male rhesus monkeys: design, methodology, and preliminary indings from the irst year of study. J Gerontol. 1993;48(1):B17-26.
13. Severinsen T, Munch IC. Body core temperature during food restriction in rats. Acta Physiol Scand. 1999;165(3):299-305. 14. Duffy PH, Feuers RJ, Hart RW. Effect of chronic caloric re
-striction on the circadian regulation of physiological and be-havioral variables in old male B6C3F1 mice. Chronobiol Int. 1990;7(4):291-303.
15. Duffy PH, Feuers RJ, Leakey JA, Nakamura K, Turturro A, Hart RW. Effect of chronic caloric restriction on physiological variables related to energy metabolism in the male Fischer 344 rat. Mech Ag Dev. 1989;48(2):117-33.
16. Parashar V, Rogina B. dSir2 mediates the increased sponta-neous physical activity in lies on calorie restriction. Aging. 2009;1(6):529-41.
17. Weed JL, Lane MA, Roth GS, Speer DL, Ingram DK. Activity measures in rhesus monkeys on long-term calorie restriction. Physiol Behav. 1997;62(1):97-103.
18. Tang-Christensen M, Vrang N, Ortmann S, Bidlingmaier M, Horvath TL, Tschop M. Central administration of ghrelin and agouti-related protein (83-132) increases food intake and de-creases spontaneous locomotor activity in rats. Endocrinol. 2004;145(10):4645-52.
19. De Andrade PB, Neff LA, Strosova MK, Arsenijevic D, Patthey-Vuadens O, Scapozza L, et al. Caloric restriction induces energy-sparing alterations in skeletal muscle contraction, iber composi -tion and local thyroid hormone metabolism that persist during catch-up fat upon refeeding. Front Physiol. 2015;6(254):1-13. 20. Jahng JW, Kim JG, Kim HJ, Kim BT, Kang DW, Lee JH. Chronic
food restriction in young rats results in depression- and anxiety-like behaviors with decreased expression of serotonin reuptake transporter. Brain Res. 2007;1150:100-7.
21. Beck WR, Scariot PPM, Gobatto CA. Melatonin is an Ergogenic Aid for Exhaustive Aerobic Exercise only during the Wakefulness Period. IJSM. 2016;37(01):71-6.
22. Regouw BJ, Spijkers JB, Weeber YM, Cornelissen PJ, Helder RA. A simpliied method for the determination of free fatty acids in plasma. Pharm Weekbl. 1972;107(50):803-9.
23. Dubois M, Gilles KA, Hamilton JK, Rebers PA, Smith F. Colorimetric Method for Determination of Sugars and Related Substances. Anal Chem. 1956;28(x):350-6.
24. Wang Q, Bing C, Al-Barazanji K, Mossakowaska DE, Wang XM, McBay DL, et al. Interactions between leptin and hypothalamic neuropeptide Y neurons in the control of food intake and energy homeostasis in the rat. Diabetes. 1997;46(3):335-41.
26. Pilkis SJ, Granner DK. Molecular physiology of the regulation of hepatic gluconeogenesis and glycolysis. Annu Rev Physiol. 1992;54(x):885-909.
27. Joly-Amado A, Cansell C, Denis RG, Delbes AS, Castel J, Martinez S, et al. The hypothalamic arcuate nucleus and the control of peripheral substrates. Best Pract Res Clin Endocrinol. 2014;28(5):725-37.
28. Morton GJ, Schwartz MW. The NPY/AgRP neuron and energy homeostasis. Int J Obes Relat Metab Disord. 2001;25 (5):S56-62.
Acknowledgments
This work was supported by Fundação de Amparo à Pesquisa do Estado de São Paulo - FAPESP under grants number 2012-20501-1 and 2011/13226-1
Corresponding author
Claudio Alexandre Gobatto.
School of Applied Sciences, University of Campinas, Department of Sport Scienc
-es, Laboratory of Applied Sport Physiology. Pedro Zaccaria Street, 1.300, Jardim Santa Luíza, Limeira, São Paulo.
Email: [email protected]
Manuscript received on August 25, 2016 Manuscript accepted on October 27, 2016