Overview of the Phase Diagram
of Ioni Magneti Colloidal Dispersions
F. Cousin ()
, E. Dubois ()
,V. Cabuil ()
, F. Boue ()
,and R.Perzynski ()
()
Laboratoire desLiquidesIoniquesetInterfaes Chargees,CNRSUMR7612,
ase63,UniversitePierre etMarieCurie,4,
PlaeJussieu,75252Parisedex05,Frane
()
Laboratoire LeonBrillouin,CEA-CNRSUMR12,
CE-Salay,91191 Gif-sur-Yvette,Frane
()
LaboratoiredesMilieuxDesordonnesetHeterogenes, CNRSUMR7603,
ase78,Universite PierreetMarieCurie,4, Plae Jussieu,75252Parisedex05,Frane
Reeivedon8January,2001
Westudyionimagnetiolloidaldispersions,whihareonstitutedof-Fe2O3 nanopartiles
dis-persedinwater, andstabilized witheletrostatiinterpartilerepulsion. Thephase diagramV
versus (: osmoti pressure, V: partile volume,: partile volumefration) is explored,
es-peially inthe range of high and high . The osmoti pressure of the olloidal dispersion
is knowneitherbyameasurement eitherbeause itis imposed duringthesamplepreparationby
osmoti ompression. The struture of the olloidal dispersion is determined from Small Angle
NeutronSattering (SANS).Tworegimes anbedistinguished. Athigh pressure,uidand solid
phases anexist. Theirstrutureisgovernedbystrongeletrostatirepulsion, therangeofwhih
is hereevaluated. At lowpressure, gas,liquidand glassysolidsanexist. Their strutureresults
fromastikyhardspherepotential.
I Introdution
Ioni magneti olloidal dispersions are onstituted of
nanometrimagnetipartilesdispersed inwater[1-3℄.
Suhdispersions arewidelyused fortehnial
applia-tionsbeausetheyare sensitiveto aversatileexternal
parameter,themagnetield. Inthepresentwork,the
hemiallysynthesized nanopartilesareonstitutedof
maghemite (-Fe
2 O
3
). They are oated with itrate
ligands, whih ensureanegativedensity ofhargeson
the partile surfae. The resulting interpartile
ele-trostatirepulsionensuresthestabilityoftheolloidal
solution[4℄.
Suh olloidaldispersionsan bedesribedassolid
spheressuspendedinaontinuousmedium,thesolvent.
This allowsmakingananalogybetweenthe phase
be-haviorofolloidaldispersions andatomisystems.
Al-though thespatial sales are very dierent, the
inter-partilepotentialhasasimilar shapein bothsystems.
Therefore,oneanexpetthesamekindsofphasesfor
olloidaldispersionsasforatoms: gas(lowpartile
on-entration), liquid (largepartile onentration), uid
(abovearitial point)and solid (amorphousor
rys-olloidalsystemlookslikethephasediagramofatomi
systems,withgas-liquidanduid-solidtransitions[5,6℄.
Suh agas-liquidtransition resultsfromaspeial
bal-aneofattrativeandrepulsiveinterations[7℄,balane
whihsarelyoursforeletrostatiallystabilized
ol-loidal systems, as the one onsidered and here [8,9℄.
Moreover, for our magneti olloids, the existene of
thisgas-liquidtransitionalsomeansthat themagneti
dipolar interationhasamarginalinuene onthe
in-terpartilepotentialinzeromagnetieldexperiments
(asthose performedhere)[10,11℄.
Partoftheexperimental phasediagram ofthe
ol-loidal dispersion onsidered here (osmoti pressure
versusvolumefration)hasbeenpreviouslybuiltup
by oupling Small Angle Neutron Sattering (SANS)
measurements to determinations of phase separation
thresholds[6℄. Thesepreviousworksweredealingwith
low osmotipressuresand smallvolume frations,and
withgas-liquidphasetransitions. Hereweshallexplore
the borders of the previous diagram, i.e. the range
of high osmoti pressuresand large volume frations,
using samples prepared byosmoti ompression. Our
to SANS struture fator determinations allows us to
givearstharaterizationoftheirloalstrutureand
to loatethem on the diagram with respet to
thegas-liquidphaseseparations.
II Samples and methods
The partiles are hemially synthesized in water by
opreipitation ofFeCl
2
andFeCl
3
in analkaline
solu-tion [12℄. It leadsto -Fe
2 O
3
partilesof density =
5g/m 3
dispersedinanaidiaqueousmedium(pH
2). Theirsurfaeisthen oatedwithtrisodiumitrate
moleules, andthepH of thesolutionisset to 7. The
partilessurfaehargeisnegative,saturatedatavalue
of2harges/nm 2
,andneutralized byNa +
ounterions
[4℄. As the adsorbed itrate ions are in equilibrium
with unadsorbeditrate ions,theionistrengthin the
solutionisduetotheonentration[Cit℄
free
ofthese
un-adsorbeditrateionsandto theirsodiumounterions.
Thevolumefrationofthesolutionisdetermined
from hemial titration of iron [13℄. The partile size
distribution, assumed to be a lognormal one, is
ex-tratedfromthemagnetizationurvesmeasuredforlow
volume frations ( < 1%) [3℄. A two parameter t
of these urvesallowsdetermining the meandiameter
d
0 (lnd
0
=< lnd>) and thedistribution width [3℄.
The twosamples A and Bused herehavesame mean
diameter d
0
= 7nm but adierentpolydispersity
in-dex:
A
= 0:35 and
B
= 0:2. In order to hek the
gooddispersionofthepartilesatlowvolumefration,
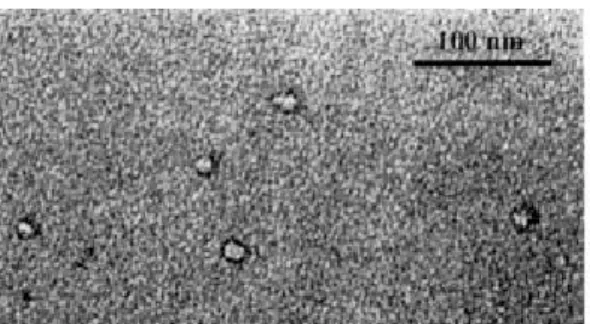
transmissioneletronmirosopy(seeFig. 1)hasbeen
performedonaplatinum-arbonrepliaobtainedafter
ahigh-pressurefreezefrature(77Kand200bars)[14℄.
Figure1. Transmissioneletronmirosopypiture aftera
freeze fratureunderhighpressure forsampleAwith=
0.05%.
Attheendofthehemialsynthesis,theitrate
on-entration[Cit℄
free
isatleast 5:10 2
mol/L, leadingto
amaximalosmotipressureoftheorderof4000Paat
= 10%. Suh pressuresare measuredfor <10%
with a membrane osmometer(Knauer ref A0330)
be-tween 10 Pa and 4000 Pa with an auray of 5 Pa
[15,16℄. The membrane (ellulose 20 kDa) separates
twoompartments,onelledwiththeolloidal
disper-sionandtheotherlledwithasodiumitratesolution,
the onentration of whih equals [Cit℄
free
in the
ol-loidaldispersion.
In order to reah experimentally higher osmoti
pressures,thesamplesareheresubmittedtoanosmoti
ompression.Theolloidaldispersion,plaedina
dial-ysis bag (12-14 kDa), is immerged in a bath solution
of known osmoti pressureand known ioni strength.
Theosmoti pressureis xed by apolymer(Dextran,
M
W
= 110000 g/mol, Fluka) plaed in the reservoir,
polymer whih xes the hemial potential of water.
Thepressureisalibratedandindependentoftheioni
strength [17℄. The ioni strength is imposed by the
itrate onentration of the bath solution. The
equi-librium is reahed in a few weeks. The pressure and
theionistrength oftheolloidalmagnetisuspension
thenequalthat oftheexternal bath. As thenal
vol-umefration dependson and [Cit℄
free
, itis dierent
fromtheinitial value,anditis determinedagainafter
equilibrium.
SANS experiments are performed on the PAXY
spetrometer (Orphee reator, LLB, CEA Salay,
Frane). Three dierent ongurations of neutron
wavelengthand detetordistane ( =10
A, =
3.1m),(=5
A,=1m),(=5
A,=3.1m)were
used. Itleadstoaglobal rangeofsatteringvetorsq
between0.008 A 1 and0.4 A 1
. Theexperiments
be-ingperformedinlightwater,themeasuredintensity
af-tersubtrationoftheinoherentsignalisproportional
tothenulearontribution ofthepartiles[18℄. In
or-der to determine the form fator of the partiles, the
satteredintensityofsamplesAandBismeasuredfor
non-interating dilute partiles, i.e. avolumefration
0
around 1%in theonditionsofionistrength used
here. ThestruturefatorS(q;)ofonentrated
dis-persions isdeduedfromthedetetedintensityI(q;)
using: S(q;)=(I(q;)=)=(I(q;
0 )=
0 ).
III Results and disussion
Osmotipressuremeasurements:
These measurementsareperformedwiththe
mem-braneosmometerforsampleAatthreedierentitrate
onentrations. TheresultsareplottedinFig. 2as=
versus. At low,=maybeexpanded inavirial
development = kT V (1+ 2 N a VA 2 +O( 2 )); (1)
whereV isthevolumeofthepartile(thatweshall
as-similatefurtherontoitsweightaverage),isthe
den-sityofthepartile(g/m 3
)N
a
istheAvogadronumber,
andA
2
istheseondvirialoeÆient(mol.g 2
.m 3
). If
tendstoward0,=tendstowardkT=V thatequals
here30Pa. Inthepresentexperiment:
-=inreaseswith whih isharateristiofa
-=versusstronglydependsontheitrate
on-entration.
-thelineardevelopmentof=asafuntion of
giveninexpression(1)isnolongervalidin our
experi-mentalrangeof. Higherordertermshavetobetaken
intoaounthere.
Figure2. Reduedosmoti pressure = asa funtionof
volume fration for sampleA at threedierent [Cit℄free
values. Fromtoptobottom,[it℄
free =10 3 mol/L;5.10 3 mol/L;10 2
mol/L.Dashed line, dotted line and full line
respetively orrespond tobesttsofexpressions 2and3,
withÆ =68
A,48
Aand38
A.
Thus otherexpressions of involvinghigherorder
terms have to be used to desribe the system.
Car-nahan and Starlinghave proposed for hard spheres a
semi-empirial equation of state that gives the exat
virialoeÆientsuntil thefourthorder [19℄:
=
kT
V
1++ 2 3 (1 ) 3 ; (2)
In ourolloidal dispersions, in theregime explored in
Fig. 2,theinteration isrepulsiveandthesysteman
be onsidered as onstituted of eetive hard spheres
ofdiameter d
0
+2Æ,where Æsalesastherangeofthe
interpartileinteration. Theeetivevolumefration
HS
anbedenedby:
HS = 1+ 2Æ d 0 : (3)
Thebesttsofthe=datausingexpressions(2)and
(3) are presentedin Fig. 2. It givesan evaluation of
Æ for the three dierent ioni strengths of the
exper-iment ([Cit℄
free = 10
3
mol/L, Æ = 68 A; [Cit℄ free = 5.10 3
mol/L, Æ =46
A; [Cit℄
free = 10
2
mol/L,Æ =
38
A). Wesee that theinteration rangeÆ is[Cit℄
free
dependent.
WeanomparethisinterationrangeÆtothe
De-byelengththatharaterizestherangeofthe
1 0 = 4l B X i i z 2 i ! 1 2 (4) l B
being the Bjerrum length (7.2
A in water at 298
K),
i andz
i
beingrespetivelytheonentrationand
thevalenyoftheionispeiesi. Sodiumitrateis
ex-peted to behave asa 3:1 eletrolyte. This leads, for
[Cit℄ free = 5.10 3 mol/L,to 1 0 =18
A ,value muh
smaller than the experimental value of Æ in the same
onditions, 46
A . As a matter of fat, if we suppose
nowthatsodiumitratebehavesasa1:1eletrolyteof
sameonentration,weobtain 1
0
=43.5
Afor[Cit℄
free
=5.10 3
mol/L.Itis muh losertotheexperimental
valueofÆ.
1.E+06
1.E+07
1.E+08
1.E+09
1.E+10
1.E+11
0.01
0.1
1
10
100
Π
V (Pa.Å
3
)
Φ
(%)
Gas
+ Liquid
Gas
Liquid
Solid
Fluid
*
Critical
point
A
2
= 0
Solid
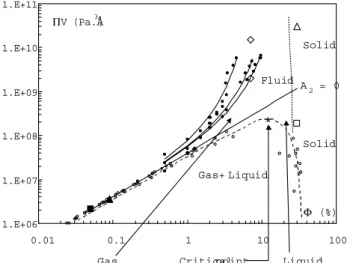
Figure 3. Phase diagram V versus from referene [6℄.
The open dots orrespond to the oexistene lines of the
gas-liquidtransition and thedashedlineis aguidefor the
eye,showingtheloationoftheritialpoint. Thefulldots
and full lines orrespond respetively to the data and ts
from Fig. 2. The straight line orrespondsto V for A2
=0. Theblaksquareorrespondstotheonditions ofthe
freeze frature piture of Fig. 1. The blak triangle
or-respondstotheonditions ofoexistene assoiated tothe
thresholddeterminationsofFig. 4. Thetwoopendiamonds
orrespondtotheuidphasesfromFig. 5. Theopen
trian-gleorrespondsto thesolidphasefromFig. 6observedat
highosmotipressure. Theopensquareorrespondstothe
solidphase fromFig. 7observed at lowosmoti pressure.
Thedottedlineisanevaluationofthefrontierbetweensolid
anduidphases.
These =data and theirts arealso reported in
Fig. 3 that represents the phase diagram of the
ol-loidalsystem, asdeterminedin referene[6℄. Itshows
thattheseosmotipressuredeterminationsarerealized
inthemonophasiuidareaofthediagram,abovethe
straightlineA
2
=0. Inthis area,A
2
>0,andthe
re-pulsiveinterationisdominating. Pleasenotethat the
onditions of thefreeze frature experimentof Fig. 1
(=0:05%andV =2.110 6
Pa.
A 3
),alsoreportedin
Fig. 3,orrespondto thesameregime. ForlowerV
values, A
2
phase transition (measured using optial mirosopy)
onrm the speial behaviorof theitrate eletrolyte.
Thephaseseparationanbeinduedbysaltaddition,
hereeitheritrateorsodiumhloride,theseondbeing
a monovalent eletrolyte. Fig. 4 plots the thresholds
for sample B at = 0.09% andV =3.6.10 6
Pa.
A
3
. Itshowsthatitrateadditionisnearlyequivalentin
onentration to NaCl addition to produe the phase
separation and thus onrms that sodium itrate
be-haveshereasa1:1eletrolyte. This ouldresultfrom
nite size eets of itrate ions assoiated (or not) to
ounterionsondensation.
Figure4. Liquid-gasphaseseparationinduedby addition
of NaCl (SampleB, =0.09 %, V =3.6.10 6
Pa.
A 3
)
-ThresholdofNaClonentrationasafuntionoftheinitial
sodiumitrateonentrationofthesolution.
SmallAngleNeutronSatteringexperiments:
These experiments have been used to explore the
area of veryhigh osmoti pressures in the phase
dia-gram,areawhereinterpartilerepulsionisdominating.
This areaanonlybeexplored withsamplesprepared
byosmotiompression. Twodierentkindsofphases
an be observed: uid ones, whih ow under
grav-ity, and solid ones, whih do not ow under gravity.
The struture fator is determined by SANS for two
uid phases (Fig. 5) and one solid phase (Fig. 6).
The two uid phases are made of sample B with the
samevolumefrationofpartiles(7%)andtwodierent
ionistrengths([Cit℄
free
=2.5.10 3
mol/Land1.5.10 2
mol/L, see Fig. 5). The twoorrespondingstruture
fators S(q) are very lose to eah other. Their low
value(0.15)intheverylowqlimitisharateristiof
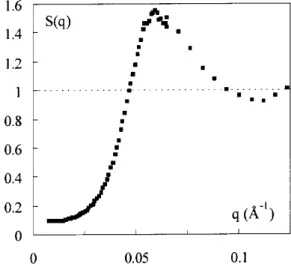
Figure5. Fluidphases -Struture fatorS(q) for sample
Bat=7%andtwoitrateonentrations. [it℄
free =2.5
10 3
mol/L(fullsymbols);[it℄free =1.510 2
mol/L(open
symbols).
Thesolidphase(Fig. 6) ismade ofsampleA with
avolumefration29.5%andanionistrength[Cit℄
free
=10 2
mol/L.Itsstruturefatorhasthesameshape
asthatofaliquid,andisthusharateristiofaglassy
struture. Suh a lak of long range order probably
results from a too large polydispersity in size of the
nanopartiles[8,20℄.
Figure6. Solidphaseathighosmotipressure(=50000
Pa)-StruturefatorS(q)forsampleAat=29.5%and
[it℄free =10 2
mol/L.
Inthis high-pressureregime,the distane d
qmax =
2=q
max
, whihis assoiated to themaximum q
max of
thestruture fator,orrespondstothemean distane
d
mean
betweenpartiles in thesolution. Forexample,
for the uid sample with [Cit℄
free
= 2.5.10 3
mol/L,
d
q max =137
Aandd
mean
=136.5
A.Wealsoobserve
that d
q max
varies as 1=3
, like d
mean
. We onlude
that, for suh high pressures, the partiles are
At lower osmoti pressures, the phase diagram
(Fig. (3)) presentsat lowvolumefration agas-liquid
transition assoiated to aritial point [6,15℄. In the
area of large partile volume frations, a glassy solid
phase, prepared by osmoti ompression, is also
ob-served. Fig. 7presentsthestruturefatorofasolution
based on sample B of volume fration 30% and ioni
strength[Cit℄
free
=1.5mol/L.Contrary totheformer
ase,themaximumofthestruturefatororresponds
heretotheontatdistanebetweentwopartiles
(tak-ing into aountthe thiknessof the adsorbed itrate
layer): d
qmax =75
Aandd
ontat =80
A.Forsuhlow
pressures, the partiles are no longer homogeneously
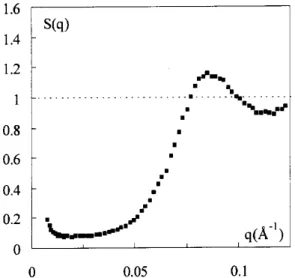
dispersed inthesample. Letusalsonoteanupturnof
S(q)at lowq,harateristiofaninterpartile
attra-tion. It results that the interpartilepotential is that
ofstikyhardspheres.
Figure7. Solidphaseatlowosmotipressure(=750Pa)
-StruturefatorS(q)forsampleBat=30%and[it℄free
=1.5 mol/L.
IV Conlusion
We are able to prepare highly onentrated
disper-sionsofmagnetipartilesofknownionistrengthand
knownosmotipressure,whihallowustoexplorelarge
areasatthebordersofthephasediagram. Tworegimes
anbedistinguished:
at low salinity (high osmoti pressure), the system
presentsuidphasesandsolidphasesonly. Their
struture is ruled by thestrong eletrostati
re-pulsion, therange ofwhih ishereevaluated. It
is of the order of the Debye length if it is
al-ulated onsidering thesodium itrate asan 1:1
eletrolyte. Thesolid phasehereobtainedhas a
olloidal glass struture. This has to be related
rst to thesample polydispersity, and seond to
maynotallowittoexploreallongurations.
athighsalinity(lowosmotipressure),aglassysolid
phase is also observed at large partile volume
frations. The struture fator is then modied
byan attrative interation. Within this range,
therepulsion issreened,andtheattrativepart
oftheinterpartile potentialanbeseendiretly
on the struture fator. The resulting potential
anbedesribedasthatofstikyhardspheres.
Inthat work, we haveexplored the borders of the
phase diagrams towards large pressures and volume
frationsassummarizedinFig. 3. Althoughthisgives
agoodideaoftheglobalphasebehavior,severalpoints
remaintostudyin forthomingworks:
- where is exatly the boundarybetweenthe uid
andthesolidphase?
-howdoesthe olloid behavein the neighborhood
oftheritialpoint?
-arethereatriplepointandaoexistenebetween
gasandsolidphasesat lowosmotipressure?
- is there a oulation area in the diagram, for
low ioni strengths, when the surfae harge density
dependsonthe[Cit℄
free
onentration?
As mentioned in the introdution, the magneti
dipolar interation has a negligible inuene for suh
experimentswithoutanappliedmagnetield. We
ob-serve the same kindof phasediagram aswith a
non-magnetiolloidaldispersion. Thenextstepwill beof
ourse the study of the uid, liquid and solid phases
obtainedundermagnetield.
Aknowledgments
We thank Delphine Talbot for preparing the
ini-tialolloidaldispersions. High-pressurefreezefrature
replias have been done by J.P. Lehaire in
Labora-toiredeBiologieMarine,UniversiteParisVI.The
or-responding eletron mirosopy piture has been
ob-tainedbyM. Lavergnein Centre RegionaldeMesures
Physiques,UniversiteParisVI.
Referenes
[1℄ R.Rosensweig,inFerrohydrodynamis(Cambridge
Uni-versityPress,Cambridge,1985).
[2℄ E. Blums, A. Cebers and M.M. Maiorov in Magneti
uids,editedbydeGruyter(NewYork,1997).
[3℄ inMagnetiuids andAppliations -Handbook, edited
byBerkovsky(BegellHouse,NewYork,1996).
[4℄ E. Dubois, V. Cabuil, F. Boue, and R. Perzynski, J.
Chem.Phys.111,7147(1999).
[5℄ F. Cousin and V. Cabuil, Prog. Colloid Polymer Si.
115,77(2000).
Lang-[7℄ C.F. Tejero, A. Daanoun, H.N.W. Lekkerkerker, M.
Baus,Phys.Rev.Lett.73,752(1994).
[8℄ P.N. Pusey, in Liquids, freezing and glass transitions,
edited by J.P. Hansen, D. Levesque, J. Zinn-Justin
(North-Holland,Amsterdam,1991)765.
[9℄ J.M. Vitor and J.P. Hansen, J. Chem. So., Faraday
Trans.2, 81,43(1985).
[10℄ M.E.vanLeeuwenandB. Smit, Phys.Rev.Lett. 71,
3991(1993).
[11℄ M.J. Stevens and G.S. Grest, Phys. Rev.E 51, 5962
(1995).
[12℄ R. Massart, IEEE Trans. Mag. MAG-17,1247 (1981);
R.Massart,FrenhPatent79-188-42(1979);U.S.Patent
4329241(1982).
[13℄ G. Charlot, in Les methodes de la himie analytique,
editedbyMassonetCie(Paris,1966)737.
[14℄ D.Fauhadour, T.Pouget, J-P.Lehaire,L. Rouleau
and L. Normand, Revue de l'Institut Franais du
Petrole,vol54(4),513(1999).
[15℄ F.CousinandV.Cabuil,Journalofmoleularliquids,
83(1-3),203(1999).
[16℄ F. Cousin, Thesis of the University Paris VI, Paris
(2000).
[17℄ C.Bonnet-Gonnet,Thesis oftheUniversity Paris VI,
Paris(1993).
[18℄ F. Gazeau, F. Boue, E. Dubois, S. Neveu and R.
Perzynski,tobepublished.
[19℄ N.F.CarnahanandK.E.Starling, J.Chem.Phys.51,
635(1969).