ISSN 0104-6632 Printed in Brazil
www.abeq.org.br/bjche
Vol. 32, No. 01, pp. 283 - 291, January - March, 2015 dx.doi.org/10.1590/0104-6632.20150321s00002825
Brazilian Journal
of Chemical
Engineering
MODELING AND SIMULATION OF A BENZENE
RECOVERY PROCESS BY EXTRACTIVE
DISTILLATION
L. B. Brondani
*, G. B. Flores and R. P. Soares
*Universidade Federal do Rio Grande do Sul, (UFRGS), Departamento de Engenharia Química, R. Eng. Luis Englert, s/n. Campus Central, CEP: 90040-040, Porto Alegre - RS, Brazil.
Phone: + (55) (51) 3308 3528, Fax: + (55) (51) 3308 3277 E-mail: {lauren, rafael}@enq.ufrgs.br
(Submitted: July 10, 2013 ; Revised: March 20, 2013 ; Accepted: March 27, 2014)
Abstract - Extractive distillation processes with N-formylmorpholine (NFM) are used industrially to separate benzene from six carbon non-aromatics. In the process studied in this work, the stream of interest consists of nearly 20 different hydrocarbons. A new set of NRTL parameters was correlated based on literature experimental data. Both vapor-liquid equilibrium as well as infinite dilution activity coefficient data were taken into account; missing parameters were estimated with the UNIFAC group contribution model. The extractive distillation process was simulated using ASPEN Plus®. Very good agreement with plant data was obtained. The influences of the main operational parameters, solvent to feed ratio and solvent temperature, were studied. Theoretical optimum operating values were obtained and can be implemented to improve the industrial process. Extreme static sensitivity with respect to reboiler heat was observed, indicating that this can be the source of instabilities.
Keywords: Extractive distillation; N-formylmorpholine; NFM; Process simulation; Benzene.
INTRODUCTION
Benzene has being widely used in the chemical industry as a raw material for innumerous com-pounds. Due to its high toxicity, it is being replaced by other hydrocarbons with similar characteristics. This movement is also driven by stricter regulations. For instance, in Brazil, the commercialization of finished products containing more than 0.1% ben-zene by volume in their composition is not permit-ted. However, benzene is still widely employed in, for example, styrene polymers; phenol for resins and adhesives (via cumene); and cyclohexane, used in nylon manufacture.
This motivates the petrochemical industry to better understand and control high purity separation proc-esses. Due to the similar boiling point of aromatics
and non-aromatics with the same carbon number, conventional distillation processes are impractical and extractive distillation processes become eco-nomically interesting.
According to Emmrich et al. (2001), Krupp Uhde originally developed the Morphylane process (ex-tractive distillation process) for the recovery of high-purity benzene from hydro-refined coke oven ben-zole, the reason being that the existing liquid-liquid methods of extraction were unable to process coke oven benzole due to its high aromatic content. The liquid-liquid extraction techniques exploit the differ-ent solubilities of aromatics and non-aromatics in a polar solvent.
process studied in this paper, NFM (N-formylmor-pholine, shown in Figure 1) is used to accomplish the separation of benzene from a stream containing other hydrocarbons, mainly with six carbons.
Figure 1: NFM molecule (N-formylmorpholine).
According to ZHIGANG et al. (2005), the addi-tion of polar solvents to hydrocarbon mixtures re-sults in increased volatilities of paraffins relative to naphthenes, olefins, diolefins and alkynes, and in increased volatilities of naphthenes relative to aro-matics. Therefore, the addition of a polar solvent reduces the effort in the separation by distillation of certain mixtures which otherwise would be impracti-cal. Thus, among other desired characteristics, its polarity and its high boiling point make NFM a good solvent for the required separation.
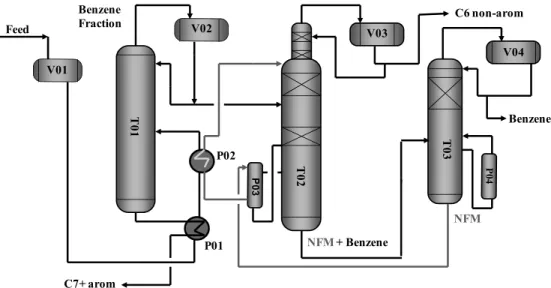
Figure 2 shows a schematic drawing of the unit studied.
The C6C8 stream from the pyrolysis gasoline hy-drogenation process is first fractionated into C6 and C7+ cuts in the distillation column (T01). The C6 cut is sent to the extractive distillation column (T02). In this column, NFM is added as the entrainer to extract benzene, exiting at the bottom of the column. The overhead stream contains C6 non-aromatics (over-head product). The bottom stream is fed into a
strip-per column (T03) where the separation of benzene, at the top, from the solvent, at the bottom, occurs.
The column studied, T02, frequently does not specify the desired products with the desired stabil-ity. It should simultaneously specify both products: the overhead product (non-aromatic C6) and the bottom product (benzene). Therefore, the main goal of the work was to develop a model which agrees with plant data. A new set of NRTL parameters was estimated based on experimental data available in the literature. The insight obtained from this model will hopefully provide the directions for a more stable operation.
THERMODYNAMIC MODEL
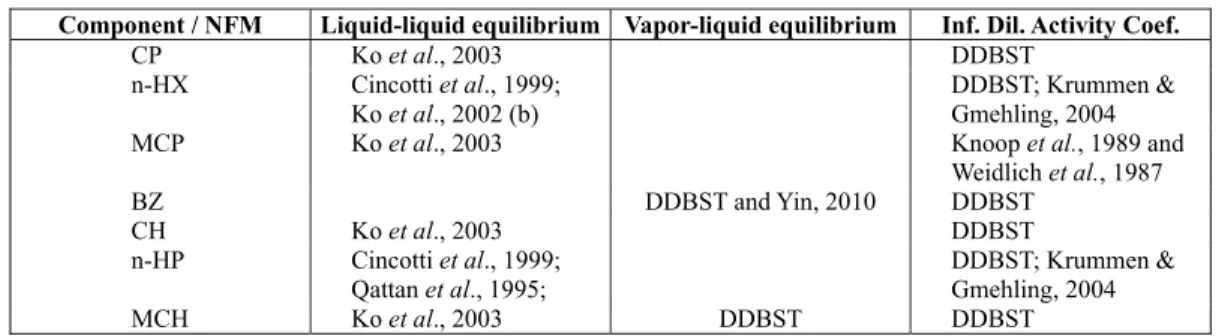
Since extractive distillation processes are strongly affected by the non-ideal interactions between the entrainer and the stream of interest, one of the main difficulties when simulating these processes is the correct thermodynamic representation of the mixture behavior in contact with the solvent. Thus, most of the work was devoted to the thermodynamic modeling. First, a literature survey for phase equilibrium and infinite dilution activity coefficient (IDAC) data with NFM and the substances involved was accomplished. Information for mixtures with NFM and the following compounds was found in the literature: cyclopentane (CP), n-hexane (n-HX), methylcyclopentane (MCP), benzene (BZ), cyclohexane (CH), n-heptane (n-HP) and methylcyclohexane (MCH). Table 1 shows a sum-mary of the collected information.
V01
V02
T0
2
T0
3
V03
V04
Benzene
NFM + Benzene
NFM
C7+ arom Benzene
Fraction C6 non-arom
P01 P02 Feed
Table 1: Available binary mixture data of the components of interest with NFM,
Component / NFM Liquid-liquid equilibrium Vapor-liquid equilibrium Inf. Dil. Activity Coef.
CP Ko et al., 2003 DDBST
n-HX Cincotti et al., 1999; Ko et al., 2002 (b)
DDBST; Krummen & Gmehling, 2004 MCP Ko et al., 2003 Knoop et al., 1989 and
Weidlich et al., 1987
BZ DDBST and Yin, 2010 DDBST
CH Ko et al., 2003 DDBST
n-HP Cincotti et al., 1999; Qattan et al., 1995;
DDBST; Krummen & Gmehling, 2004
MCH Ko et al., 2003 DDBST DDBST
From this information the parameters for the NRTL (Non-random two-liquid) model were esti-mated and the resulting correlation compared with experimental data for different temperatures. The choice of this model was based on its ability to rep-resent deviations from ideality at low pressure and because it was already used successfully in similar works, like Ko et al., 2002 (a), Zhu et al., 2007 e Dongchu et al., 2007.
The NRTL model variant used in this paper is given by:
ln( )i j j ji ji j ij m m mj mj
k k ki j k k kj k k kj
x G x G x G
y
x G x G x G
⎛ ⎞
∑ τ ∑ τ
= ∑ + ∑ ⎜⎜ ∑ ⎟⎟
⎝ ⎠
∑
(1)with the other quantities given by:
exp( )
ij ij ij
G = −α τ (2)
ln
ij
ij ij ij ij
b
a e T f T
T
τ = + + + (3)
( 273.15 )
ij cij d Tij K
α = + − (4)
For components with vapor-liquid equilibirum (VLE) and/or liquid-liquid equilibrium (LLE) data available in the literature (compounds showed in Table 1), the NRTL parameter regression was ac-complished using this equilibrium information, per-formed by the built-in data regression functionality of Aspen Plus®. For those same components Aspen Plus® was used in order to obtain estimated NRTL parameters using IDAC data from the literature. Thus, two different groups of NRTL binary interac-tion parameters for each component with NFM were estimated, one based on phase equilibrium data (re-ferred as VLE and/or LLE regression) and the other based on IDAC (referred as IDAC regression). Fur-ther, the NRTL parametrizations from KO et al., 2002 (a) and ZHU et al., 2008 were also compared with the collected experimental data.
Ko et al. (2002 a) was the only reference found
that used existing vapor-liquid equilibrium data to build the thermodynamic model with the NRTL equation and simulate the system with Aspen Plus®. The author used the NRTL equation and set binary parameters for NFM for the following pairs: pentane, hexane, heptane, octane, cyclopentane, cyclohexane, methylcyclopentane, methylcyclohexane, dimethyl-cyclohexane, benzene, toluene and ethylbenzene. In the study it was concluded that the NRTL equation was efficient to simulate the extractive distillation with NFM.
In their work, Ghaee et al. (2008) used the model proposed by Ko et al. (2002 a) to build a dynamic simulation of an extractive distillation column for benzene. On the other hand, Zhu et al. (2008) pre-dicted vapor-liquid equilibrium data of NFM with hydrocarbons with an improved UNIFAC group contribution method modified by Dortmund. They also found their model to be in agreement with real industrial operation data.
Table 2 shows the availability of binary mixture parameters for each component with NFM for the different models.
Table 2: Binary mixture parameter availability for the different models.
Component/ NFM
VLE and/ or LLE regression
IDAC regression
Ko et al.,
2002 (a)
Zhu et al.,
2008
CP X X X X
n-HX X X X X MCP X X X
BZ X X X X
CH X X X X
n-HP X X X X MCH X X X
the NFM-rich liquid phase, the selected model was the one estimated from experimental vapor-liquid equilibrium data.
As expected, in all cases, the model that best fit the experimental IDAC values was the one estimated with the same IDAC data. Figures 3, 4 and 5 show the model verification with IDAC data for the inter-action of n-heptane, methylcyclohexane and benzene with NFM, respectively. They were built by com-paring the experimental IDAC values for different temperatures with the ones calculated by the NRTL equation using the available binary parameters of each model. Thus, the closer the points are to the line, the better that model represents the experimental data.
Although, naturally, the model estimated from IDAC experimental values is superior when com-pared with the same IDAC data, for benzene the parameters obtained from vapor-liquid equilibrium data were selected for the simulation. As mentioned before, this is mainly because benzene is far from infinite dilution in the process studied. In this situa-tion, the model built from the vapor-liquid equilib-rium experimental data was assumed to be more appropriate for the final application. The VLE results for this mixture can be seen in Figure 6.
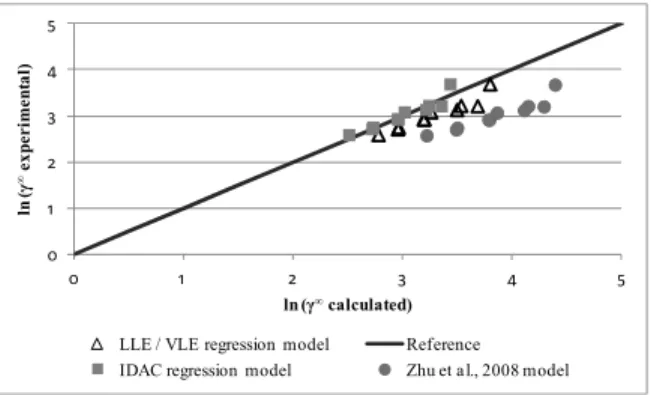
The overall performance of the model developed in this work, compared with experimental IDAC data, is shown in Figure 7, while the resulting binary parameter values are given in Table 3.
Table 3 presents the results of chosen the model for the pairs of components with experimental data. For benzene the following parameters were also considered: dij = -0.11, eij = -2.42 e eji = 1.666.
The UNIFAC model was used to estimate NRTL binary parameters for the components without equi-librium data available with the solvent NFM. These compounds are: 2,3-dimethylbutane (2,3DBM), 2-methylpentane (2MP), 3-2-methylpentane (3MP), 2,4-dimethylpentane (2,4DMP), 2-methylhexane (2MH), 2,3-dimethylpentane (2,3DMP), 1,1-dimethylcyclopen-tane (1,1DMCP), 3-methylhexane (3MH), cis-1,3-dimethylcyclopentane (c1,3DCMP), trans-1,3-dimethyl-cyclopentane (t1,3DMCP) and trans-1,2-dimethylcy-clopentane (t1,2DMCP). According to the laboratory analyses, they represent about 6wt% of a typical feed for the process under study. In order to increase the reliability of the estimated parameters, the new UNIFAC model interaction parameters for -CH2 and ACH groups with NFM, proposed by Zhao et al.
(2001) were used. The results obtained from UNIFAC are shown in Table 4.
0 1 2 3 4 5
0 1 2 3 4 5
ln ( γ ∞e x p e r ime n ta l)
ln (γ∞calculated)
Ko et a l., 2002 model Reference
IDAC regression model LLE regression model
Zhu et al., 2008 model
0 1 2 3 4 5
0 1 2 3 4 5
ln ( γ ∞e x p e r im e n ta l)
ln (γ∞calculated)
LLE / VLE regression model Reference
IDAC regression model Zhu et a l., 2008 model
Figure 3: Model verification with IDAC
experi-mental data for the interaction of n-heptane with NFM.
Figure 4: Model verification with IDAC
experi-mental data for the interaction of methylcy-clohexane with NFM.
0 0.2 0.4 0.6 0.8 1 1.2 1.4
-1.0 -0.8 -0.6 -0.4 -0.2 0.0 0.2 0.4 0.6 0.8 1.0 1.2 1.4
ln ( γ ∞e x p e r im e n ta l)
ln (γ∞calculated)
Ko et al., 2002 model Reference
IDAC regression model (this work) VLE regression model (this work) Zhu et al., 2008 model
340 360 380 400 420 440 460 480 500 520 540
0.0 0.2 0.4 0.6 0.8 1.0
Te m p e r a tu r e ( K )
Benzene molar concentration in NFM
X1 - Experimenta l Y1 - Experimenta l
x1 - VLE regression y1 - VLE regression
x1 - IDAC regression y1 - IDAC regression
Figure 5: Model verification with IDAC
experi-mental data for the interaction of benzene with NFM.
Figure 6: Comparison of the model generated
0 1 2 3 4 5
0 1 2 3 4 5
ln
(
γ
∞e
x
p
e
r
im
e
n
ta
l)
ln (γ∞calculated)
MCP n-HX CH n-HP BZ CP MCH Reference
Figure 7: Comparison between gamma infinity data
calculated by the model with experimental data.
Table 3: NRTL binary interaction parameters adjusted in this work.
Comp. i CP n-HX MCP BZ CH n-HP MCH
Comp. j NFM NFM NFM NFM NFM NFM NFM
aij 0.791 0.16 0.543 17.09 0.827 0.069 0.501
aji -1.51 -2.13 -1.35 -12.3 -2.29 -2.39 -2.32
bij 891.5 1006 937.0 -1000 847.9 1036 922.8
bji 863.3 1380 932.1 952.7 1235 1563 1350
cij 0.300 0.300 0.300 0.300 0.300 0.300 0.300
Table 4: NRTL binary parameters estimated by UNIFAC.
Comp. i 2,3DMB 2MP 3MP 2,4DMP 2MH 2,3DMP 1,1DMCP 3MH c1,3DMCP t1,3DMCP t1,2DMCP
Comp. j NFM NFM NFM NFM NFM NFM NFM NFM NFM NFM NFM
bij 1101 1101 1101 1070 1070 1070 1101 1070 1109 1109 1109
bji 520 521 521 639 640 639 522 640 507 507 507
cij 0.3 0.3 0.3 0.3 0.3 0.3 0.3 0.3 0.3 0.3 0.3
PROCESS MODELING AND SIMULATION
With the thermodynamic model parameters set, a simulation in the commercial simulator Aspen Plus® was assembled for the extractive distillation column, as schematically shown in Figure 8.
The extractive distillation column simulation was carried out using the Radfrac model. This is a rigor-ous model for simulating all types of multistage va-por-liquid fractionation operations. These operations include: ordinary distillation, absorption, reboiled absorption, stripping, reboiled stripping and extrac-tive and azeotropic distillation. The model assumes thermodynamic equilibrium and rigorous mass and energy balances in all stages. It was considered that the extractive distillation column consisted of 71 stages. Of these, 33 refer to the trays section, 12 are the equivalent stages of the random packing section above the solvent feed, 24 are the equivalent stage of the structured packing section between the solvent and hydrocarbon feeds, one is the condenser and the other is the reboiler. The equivalent stages were cal-culated from the HETP (Height Equivalent to a
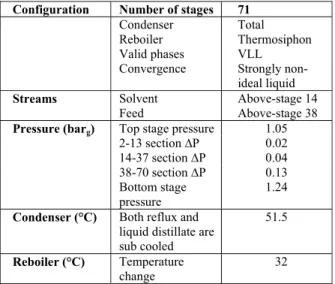
Theoretical Plate) given by the packing vendor. Table 5 shows the Radfrac simulation specifications.
V03
Solvent
Feed
C6 non-aromatics
Solvent + Benzene
1 2
32 33
Figure 8: Schematic drawing to the extractive
Table 5: Main specifications for the extractive dis-tillation column simulated with the Radfrac model.
Configuration Number of stages 71
Condenser Total
Reboiler Thermosiphon Valid phases VLL
Convergence Strongly non-ideal liquid
Streams Solvent Above-stage 14
Feed Above-stage 38
Top stage pressure 1.05
2-13 section ∆P 0.02 14-37 section ∆P 0.04 38-70 section ∆P 0.13
Pressure (barg)
Bottom stage pressure
1.24
Condenser (°C) Both reflux and liquid distillate are sub cooled
51.5
Reboiler (°C) Temperature change
32
Another typical assumption in this work is adia-batic column operation, i.e., the metal thermal ca-pacitance is negligible and heat exchange occurs only in the condenser and reboiler.
RESULTS
The proposed plant model was adjusted to match actual process conditions by varying the Murphree efficiencies. The efficiency was considered to be constant at each packing bed and tray section. Three different operating conditions were considered to determine the average efficiencies in the different zones. This step was accomplished manually by comparing the plant temperature profile and the simulated values. The result was satisfactory; how-ever, some discrepancy was observed in the bottom temperature.
This difference is probably due to a small lack of fit of the benzene and NFM mixture vapor pressure. Since the pressure is specified in the model, discrep-ancies in the temperature prediction will directly impact the model response. Another possible reason for the temperature difference found in the bottom of the column is the feed composition used. Laboratory analyses are not reliable for the heaviest components in low concentration. Thus, the model included only components with up to seven carbons. However, this discrepancy affects only the bottom temperature profile and should not be considered relevant for the benzene/non-aromatics separation, which is the focus of this work.
In the absorption section (between stages 14 and 25), a small efficiency was found (aprox. 35%), indi-cating a poor liquid and/or vapor internal
distribu-tion. The simulation results were almost insensitive with respect to the efficiency in the other packing sections and trays. Further, this small sensitivity could not be verified with the currently measured data, due to the small number of temperature sensors available (see Figure 9). Thus, the following effi-ciency values were assumed: randow packing from stages 2 to 13, 100%; structured packing from stages 26 to 37, 35%; and tray section, 80%.
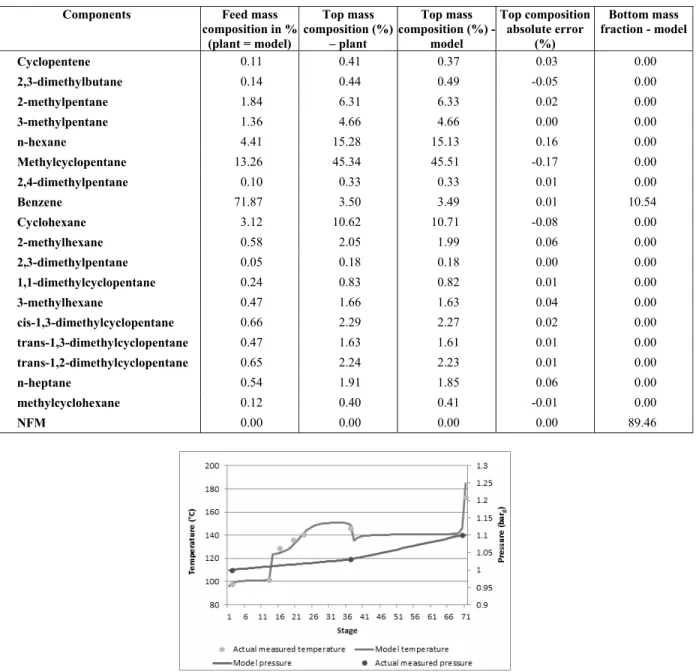
Table 6 shows one of the unit feedstock compo-sitions studied (feed composition used in the simula-tion was the same as that analyzed in the laboratory), the top composition sampled during operation, the composition obtained with the simulation and the absolute error (value measured – calculated value).
As can be seen in Table 6, the simulation results agree very well with plant data. The bigger compo-sition errors were in the n-hexane and methylcy-clopentane values. These components represent 15 and 45% of the stream, respectively, and an error of approximately 0.2 percent cannot be considered sig-nificant. Nevertheless, the actual plant mass balance also contains errors, probably due to measurement inacurracies and inadequate sampling or laboratory analysis. No additional treatment, like data recon-ciliation, was applied to the measured plant data.
In Figure 9 it is possible to see the temperature and pressure profiles obtained and compare with the measured operating temperatures, the first stage be-ing the condenser and the 71st stage the reboiler. The solvent NFM is added in the 14th stage and the feed is above the 38th stage.
Table 6: Feed composition, top composition and error found between simulation and sampled plant data (laboratory analyses).
Components Feed mass
composition in % (plant = model)
Top mass composition (%)
– plant
Top mass composition (%)
-model
Top composition absolute error
(%)
Bottom mass fraction - model
Cyclopentene 0.11 0.41 0.37 0.03 0.00
2,3-dimethylbutane 0.14 0.44 0.49 -0.05 0.00
2-methylpentane 1.84 6.31 6.33 0.02 0.00
3-methylpentane 1.36 4.66 4.66 0.00 0.00
n-hexane 4.41 15.28 15.13 0.16 0.00
Methylcyclopentane 13.26 45.34 45.51 -0.17 0.00
2,4-dimethylpentane 0.10 0.33 0.33 0.01 0.00
Benzene 71.87 3.50 3.49 0.01 10.54
Cyclohexane 3.12 10.62 10.71 -0.08 0.00
2-methylhexane 0.58 2.05 1.99 0.06 0.00
2,3-dimethylpentane 0.05 0.18 0.18 0.00 0.00
1,1-dimethylcyclopentane 0.24 0.83 0.82 0.01 0.00
3-methylhexane 0.47 1.66 1.63 0.04 0.00
cis-1,3-dimethylcyclopentane 0.66 2.29 2.27 0.02 0.00
trans-1,3-dimethylcyclopentane 0.47 1.63 1.61 0.01 0.00
trans-1,2-dimethylcyclopentane 0.65 2.24 2.23 0.01 0.00
n-heptane 0.54 1.91 1.85 0.06 0.00
methylcyclohexane 0.12 0.40 0.41 -0.01 0.00
NFM 0.00 0.00 0.00 0.00 89.46
Figure 9: Extractive distillation column temperature
and pressure profiles.
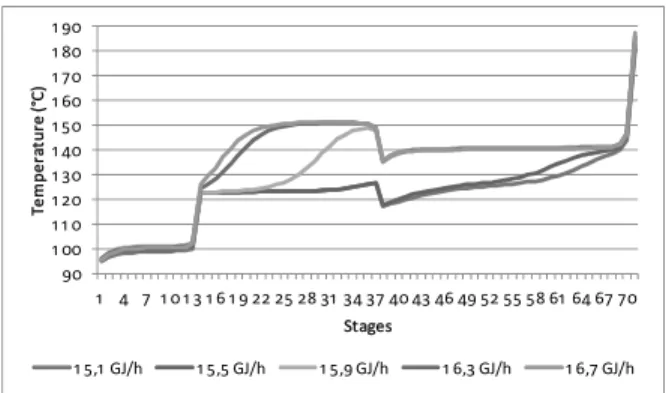
With the plant model adjusted, it was possible to study the column behavior by performing sensitivity analysis. The temperature profile of this column is very sensitive to the heat supplied. Along with other ma-nipulated variables it determines the region where benzene absorption will occur. Figure 10 shows the static temperature profile change when the reboiler heat is varied. In these simulations the feed rates and reflux ratio were kept constant. It should be noted that the simulation results of Figure 10 differ by only
mixture boiling point. On the other hand, the bottom temperature is related to the boiling temperature of the solvent/benzene mixture. Hence, with reboiling heating variation, we are actually dislocating the stage where the benzene will change phase and, con-sequently, modifying the temperature profile mainly in the rectifying section.
In Figures 11 and 12 simulation results for benzene recovery (defined as benzene at the bottom / benzene at the feed) with respect to the solvent-to-feed ratio and solvent temperature are shown, respectively.
90 1 00 1 1 0 1 20 1 30 1 40 1 50 1 60 1 70 1 80 1 90
1 4 7 1 0 1 3 1 6 1 9 22 25 28 31 34 37 40 43 46 49 52 55 58 61 64 67 70
T e m p e ra tu re (° C ) Stages
1 5,1 GJ/h 1 5,5 GJ/h 1 5,9 GJ/h 1 6,3 GJ/h 1 6,7 GJ/h
Figure 10: Effect of reboiler heat on the temperature
profile. 50% 55% 60% 65% 70% 75% 80% 85% 90% 95% 1 00% 4 .3 4 .4 4 .5 4 .7 4 .8 4 .9 5. 0 5. 2 5. 3 5. 4 5. 6 5. 7 5. 8 5. 9 6 .1 6 .2 6 .3 6 .5 6 .6 6 .7 6 .8 Be n ze n e Re co v e ry
Solvent / feed ratio
Figure 11: Effect of the solvent-to-feed ratio on the
column benzene recovery.
50% 55% 60% 65% 70% 75% 80% 85% 90% 95% 1 00%
90 95 1 00 1 05 1 1 0 1 1 5 1 20 1 25 1 30 1 35 1 40 1 45
Be n ze n e re co v e ry
Solvent temperature (°C)
Figure 12: Effect of the solvent temperature on the
benzene recovery.
From this analysis it can be seen that there is an optimal solvent-to-feed ratio for proper column op-eration. Above this value the benzene recovery does not improve substantially, only operational costs are increased. The same applies to solvent temperature. Temperatures below 115 °C, under the same reflux ratio and reboiler heat, are recommended to obtain a better benzene recovery.
CONCLUSIONS
In the present work an industrial system to sepa-rate benzene from a non-aromatic stream through extractive distillation with NFM as the solvent was studied. First, literature data were collected and dif-ferent sets of parameters for the NRTL model were compared. For many pairs of substances a need to re-estimate the NRTL model parameters was identified. For the substance pairs with no experimental data available in the literature, the UNIFAC group contri-bution model was used to estimate the missing pa-rameters. As a result of this step a new set of NRTL parameters was obtained for processes involving NFM, benzene and other non-aromatics.
Using the proposed NRTL parameter set, a plant model was assembled within ASPENPlus®. Murphree efficiencies were then adjusted for better agreement with plant data using three different operating points. The model proposed represented satisfactorily the operation of the extractive distillation column and can be used to study the behavior of most compo-nents present in the column feed. From the model analysis it is possible to demonstrate that a great difficulty of the extractive distillation column studied is its extreme static sensitivity to variations of the supplied heat. The operational challenge is to control the contact point of benzene with NFM within a region that allows the simultaneous specification of the overhead product (non-aromatic C6) and bottom product (benzene). This behavior should be further investigated so that a new control strategy can be proposed, it perhaps being necessary to add addi-tional thermocouples along the column.
NOMENCLATURE
, ,
and
ij ij ij
ij
a b c
f
non-symmetrical constants [-]
i
x component i mole fraction in the mixture
[-]
T absolute temperature [K]
P
Δ pressure drop [kgf/cm2g]
i
y activity coefficient of a component
[-]
REFERENCES
Cincotti, A., Murru, M., Cao, G., Marongiu, B., Masia, F. and Sannia, M., Liquid-liquid equilibria of hydrocarbons with N-formylmorpholine, J. Chem. Eng. Data, 44, p. 480-483 (1999).
Dortmund Data Bank, DDBST GmbH, Available at http://www.ddbst.com/ (Acessed on September, 2011).
Dongchu, C., Hongqi, Y. and Hao, W., Liquid-liquid equilibria of methylcyclohexane-benzene-N-for-mylmorpholyne at several temperatures. Fluid Phase Equilibria, 255, p. 115-120 (2007).
Emmrich, G., Gehrke, H. and Ranke, U., Working with an extractive distillation process. Digital-refining, p. 1-9 (2001).
Gahee, A., Sotude-Gharebagh, R. and Mostoufi, R., Dynamic optimization of the benzene extractive distillation unit. Brazilian Journal of Chemical Engineering, 25(4), p. 765-776 (2008).
Knoop, C., Tiegs, D. and Gmehling, J., Activity coefficients at infinite dilution (NFM - Methyl-cyclopentane). J. Chem. Eng. Data, 34(2), p. 240-247 (1989).
Ko, M., Na, S., Cho, J. and Kim, H., Simulation of the recovery process by extractive distillation. Ko-rean J. Chem. Eng., 19(6), p. 996-1000 (2002)a. Ko, M., Lee, S., Cho, J. and Kim, H., Liquid-liquid
equilibria for binary systems containing N-for-mylmorpholine. J. Chem. Eng. Data, 47, p.
923-926 (2002)b.
Ko, M., Na, S., Lee, S. and Kim, H., Liquid-liquid equilibria for the binary systems of N-formylmor-pholine with cycloalkanes. J. Chem. Eng. Data, 48, p. 249-252 (2003).
Ko, M., Na, S., Kwon, S., Lee, S. and Kim, H., Liquid-liquid equilibria for the binary systems of N-formylmorpholine with branched cycloalkanes. J. Chem. Eng. Data, 48, p. 699-702 (2003). Krummen, M. and Gmehling, J., Measurement of
activity coefficients at infinite dilution in N-methyl-2-pyrrolidone and N-formylmorpholine and their mixtures with water using the dilutor technique. Fluid Phase Equilibria, 215, p. 283-294 (2004).
Qattan, M., Al-Sahhaf, T. and Fahim, M., Liquid-liquid equilibria in some binary and ternary mix-tures with N-formylmorpholine. J. Chem. Eng. Data, 40, p. 88-90 (1995).
Weidlich, U., Roehm, H. and Gmehling, J., Activity coefficients at infinite dilution (NFM - Methylcy-clopentane). J. Chem. Eng. Data, 32(4), p. 450-453 (1987).
Yin, W., Ding, S., Xia, S., Ma, P., Huang, X. and Zhu, Z., Cosolvent selection for benzene–cyclo-hexane separation in extractive distillation. J. Chem Eng. Data, 55, p. 3274-3277 (2010). Zhao, Q., Zheng, Y. and Zhao, W., New UNIFAC
group-interaction parameters of N-formylmor-pholine. Supplied by The British Library (2001). Zhingag, L., Biaohuca, C. and Zhongwei, D., Special
Distillation Processes. Elsevier, Amsterdam (2005). Zhu, H., Shi, X. and Zhou, W., Process simulation
and parameter optimization of separating aromat-ics and non-aromataromat-ics by extractive distillation with N-formylmorpholine. Supplied by The British Library (2007).