Article
J. Braz. Chem. Soc., Vol. 25, No. 5, 961-968, 2014. Printed in Brazil - ©2014 Sociedade Brasileira de Química 0103 - 5053 $6.00+0.00
A
*e-mail: [email protected]
Cathodic Voltammetric Detection of Diltiazem at a Bismuth Film Electrode:
Application to Human Urine and Pharmaceuticals
Rita I. L. Catarino,*,a M. Fernanda C. Leal,a Adriana M. Pimenta,a
M. Renata S. Soutob and Joana R. T. Lopesa
aREQUIMTE, CEBIMED, Faculty of Health Sciences, University Fernando Pessoa,
Rua Carlos da Maia, 296, 4200-150 Porto, Portugal
bCBQF, CEBIMED, Faculty of Health Sciences, University Fernando Pessoa,
Rua Carlos da Maia, 296, 4200-150 Porto, Portugal
Neste trabalho foi desenvolvida uma nova metodologia de voltametria catódica de onda quadrada com elétrodo de filme de bismuto (BiFE) para a determinação de um anti-hipertensivo e vasodilatador coronário – o diltiazem. O filme de bismuto foi depositado ex situ na superfície de um elétrodo de carbono vítreo durante 90 s a um potencial de −1,4 V vs. Ag/AgCl, usando uma solução de tampão acetato (pH 4,5; 0,10 mol L-1) contendo 5 ou 30 mg L-1 de Bi. O sinal analítico
do diltiazem foi obtido numa solução de tampão fostato (pH 7,4; 0,25 mol L-1) onde se verificou
que a redução ocorria a −1,5 V vs. Ag/AgCl. A metodologia proposta foi aplicada à quantificação de diltiazem em formulações farmacêuticas (faixa linear de resposta compreendida entre 90 e 900 µg L-1) e em amostras de urina (faixa linear de resposta compreendida entre 45 e 270 µg L-1,
e limite de deteção de 12 µg L-1).
In this work it was developed a novel application of bismuth film electrodes (BiFEs) for the determination of the antihypertensive and coronary vasodilator diltiazem by square wave cathodic voltammetry. The bismuth film was deposited ex situ on a glassy carbon electrode for 90 s at −1.4 V vs. Ag/AgCl, from an acetate buffer (pH 4.5; 0.10 mol L-1) containing 5 or 30 mg L-1 Bi. Diltiazem
analytical signal was obtained in phosphate buffer (pH 7.4; 0.25 mol L-1) where reduction takes
place at −1.5 V vs. Ag/AgCl. The proposed methodology was applied to the quantification of diltiazem in pharmaceutical samples (dynamic linear range comprised between 90 and 900 µg L-1)
and in human urine (dynamic linear range comprised between 45 and 270 µg L-1, and detection
limit of 12 µg L-1).
Keywords: bismuth film electrode, diltiazem, voltammetry, pharmaceuticals
Introduction
The electrochemical techniques, namely voltammetry, are attractive in the determination of pharmaceuticals and toxic substances in biological samples, due to their unique characteristics. They present a low cost of implementation in the economic level, and rapidity in the multicomponent analysis and good selectivity, without the need of a sample pre-treatment, in the analytical level.1-3
During the last two decades the mercury film electrodes (MFEs) were extensively used for the determination of substances in trace levels, due to their high sensitivity and reproducibility.4-6 However, the mercury toxicity caused
some restriction in its use as an electrode material, being even forbidden in some countries.4,6-8
In 2000, Wang and its co-workers introduced
the bismuth film electrodes (BiFEs).8 These new
electrodes are an attractive alternative to the MFEs in voltammetric determinations because the Bi is “friend of the environment”, presenting low toxicity and easy preparation.4,6-9 Also, some studies show that the BiFEs
present a high sensitivity, a well defined and highly reproducible signal, a great range of cathodic potential, a good resolution of neighbor peaks, and are less sensitive than MFEs to the dissolved oxygen.4,6-9
analysis (due to the formation of funded leagues).4,6,9,10
On the other hand, only 15% of the total research activity into bismuth-based electrodes (BiEs) has been focused in the analysis of organic compounds.10 BiEs
methodologies applied to pharmaceuticals analysis are still too scarce. There are scientific reports of BiEs applied for measurement of diclofenac,11 tetracycline,12
daunomycin,13 aminosalicylate drugs,14 sulfadiazine,15
sildenafil,16 cilostazol,17 progesterone18 and methotrexate.19
It is evident that application of BiEs in the area of drug analysis is yet unexplored. As for the analysed samples the large majority were water samples, the study of more complex matrices, such as biological samples, is still rather challenging.10
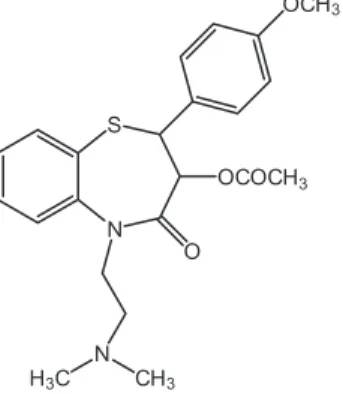
Diltiazem ((2S-cis
)-3-(acetyloxy)-5-[2-(dimethyl- amino)ethyl]-2,3-dihydro-2-(4-methoxyphenyl)-1,5-benzolthiazepin-4(5H)-one) (Figure 1) is a benzotiazepine calcium-channel blocker that presents peripheral and coronary vasodilator properties used for the treatment of the angina pectoris, hypertension and supraventricular arrhythmia.20-22
The widespread use of this compound, and the need for clinical and toxicological studies, required fast and sensitive analytical techniques for the assay of this drug in pharmaceutical formulations and biological matrices.23-27
A survey of the literature revealed that quantitative determination of this drug in pharmaceuticals and biological fluids have been done mainly by high performance liquid chromatography (HPLC) with ultraviolet detection.28-31
Also described are some other analytical methods, e.g., spectrophotometry,32 liquid chromatography coupled
to tandem mass spectrometry (LC-MS/MS)33,34 and
voltammetry.22
In this work, we presented the successful application of cathodic voltammetry with a BiFE for the determination of diltiazem, in both pharmaceuticals and human urine.
Experimental
Reagents and solutions
In the preparation of all the solutions and dilution of all the samples, reagents of p.a. quality and purified water
by a Milli Q system (resistivity ≥ 18 MΩ cm) were used. The acetate buffer (pH 4.5; 0.10 mol L-1) was prepared
by the addition of 9.0 mL of 99.8% acetic acid (Sigma Aldrich) and 8.20 g of sodium acetate (Fluka) to purified water, to a final volume of 1 L. The phosphate buffer (pH 7.4; 0.25 mol L-1) was prepared by the addition of
400 mL of a 0.25 mol L-1 Na
2HPO4.7H2O (Sigma Aldrich)
solution to 200 mL of a 0.25 mol L-1 NaH
2PO4.H2O (Fluka)
solution, both prepared from the pure reagent. The pH of both buffers was checked using a glass electrode (WTW model SenTix 41).
A standard stock solution of bismuth (1000 mg L-1
atomic absorption standard solution (Fluka)) was diluted as required.
The 450 mg L-1 stock solutions of diltiazem (Sigma),
O-desacetyl diltiazem (Santa Cruz Biotechnology) and
N-desmethyl diltiazem (Santa Cruz Biotechnology)
were prepared daily by the dissolution in ultrapure water of the appropriate amount of pure substance, and were protected from the light. The dissolution of O-desacetyl
diltiazem was carried out during 15 to 20 minutes in an ultrasonic bath (Sonorex RK 156, Bandelin). The standard solutions of diltiazem, O-desacetyl diltiazem and N-desmethyl diltiazem were obtained by an appropriate
dilution of the stock solutions in phosphate buffer (pH 7.4; 0.25 mol L-1).
The 6 mol L-1 HNO
3 solution, prepared by an appropriate
dilution of the 65% HNO3 solution (Panreac), and the 99.5% methanol solution (Sigma) were used in the washing of the working electrode surface. The aluminium oxide (Buehler 40-6603-030-016) was used for the mechanical cleaning of the working electrode surface.
Commercial dosage capsules of Herbesser SR® (180 mg diltiazem hydrochloride) and Diltiazem Mylan® (120 mg
and 180 mg diltiazem hydrochloride) were supplied from a local pharmacy.
Drug-free human urine samples used in this study were collected from 10 healthy volunteers.
Instrumentation
The voltammetric determinations were carried out in an Ecochimie/Autolab potentiostat µAutolab Type III model, coupled to a Metrohm 663 VA electrode stand. The potenciostat was controlled by a computer with a
GPES 4.9 software. The working electrode, where the bismuth film was deposited, was of glassy carbon with a 2 mm disc diameter. The reference electrode was Ag/AgCl (KCl, 3.0 mol L-1), and the auxiliary electrode
was glassy carbon. During the deposition step the solutions were stirred by a polytetrafluoroethylene (PTFE) rod rotating at 2500 rpm.
Preparation and renewal of the BiFE/GCE
At the beginning of each day the glassy carbon working electrode (GCE) was manually polished by friction of its surface with aluminium oxide, the residual material being removed with abundant purified water. After, it was carried out a washing of the working electrode surface with 99.5% methanol solution, being the solution purged during 120 s (tp) with O2-free nitrogen. The mechanical cleaning
of the working electrode surface and the washing with the 99.5% methanol solution were then repeated. At the end, an electrochemical cleaning with 0.10 mol L-1 acetate buffer
(pH 4.5) was carried out by the application of a conditioning potential (Ec) of 1.8 V during 600 s (tc) (all the adsorbed and/or deposited residues in the electrode surface were then removed throughout their oxidation).
At the ending of each day the working electrode was washed in a 6 mol L-1 HNO
3 solution for 120 s.35
The ex situ electroplating of the bismuth film on
the glassy carbon working electrode was performed in an acetate buffer (pH 4.5; 0.10 mol L-1) using a
5 mg L-1 or a 30 mg L-1 Bi solution for determinations in
pharmaceuticals and in urine, respectively. 40 mL of the bismuth solution was placed in the electrochemical cell and was purged during 120 s with O2-free nitrogen. The
deposition step was carried out at a determined potential with stirring. The stirring was turned off during a 10 s of equilibration time (te). The scan parameters used were: square wave, 10 Hz frequency, 50 mV amplitude and 25 mV step.
Procedure for the analysis of diltiazem in pharmaceuticals
For each of the pharmaceutical formulations analysed, the average weight was determined according to USP norms.36 After that, ten capsules of each pharmaceutical
were open and the content was finely powdered. A part of the powder (equivalent to 45 mg of diltiazem) was accurately weighed, dissolved in purified water, transferred into a 100 mL volumetric flask and protected from light. Each of these original solutions was further diluted to obtain working solutions of 450 µg L-1 diltiazem in phosphate buffer (pH 7.4; 0.25 mol L-1).
Procedure for the analysis of diltiazem in urine
Human urine samples were first spiked with different amounts of diltiazem standard solution to meet three different diltiazem concentrations (45, 90 and 135 mg L-1).
Spiked samples were further diluted with the phosphate buffer solution (pH 7.4; 0.25 mol L-1) to adjust the ionic
strength and the pH (1:1000).
Results and Discussion
The electroanalytical properties of diltiazem
Voltammetric determination of diltiazem was carried out by cathodic voltammetry in phosphate buffer (pH 7.4; 0.25 mol L-1). The electrochemical behavior of a 450 µg L-1
diltiazem solution (phosphate buffer pH 7.4; 0.25 mol L-1)
was studied both in BiFE (5 mg L-1 Bi solution) and in
GCE. The cathodic scan was performed between −1.2 (Ei)
and −1.6 V (Ef) after a te of 10 s. A single well-defined cathodic peak was observed on BiFE at c.a. −1.5 V (versus
Ag/AgCl reference electrode) as shown in Figure 2b. This voltammetric reduction peak is related to the cathodic reduction of the carbonyl electroactive group of diltiazem. The cathodic reduction process of compounds containing electro-donating groups such as the carbonyl group (which is the case for diltiazem) is accompanied by cleavage of the C=O bond and the formation of the corresponding alcohol.22,37 In the case of bare GCE, no current peak
of diltiazem was obtained, under the same conditions, probably because GCE is less sensitive to diltiazem than BiFE (Figure 2a).
Optimization of the BiFE
The formation of the Bi film on the GCE was optimized using a 5 mg L-1 Bi solution in acetate buffer (pH 4.5;
0.10 mol L-1). The scan parameters used were: square wave
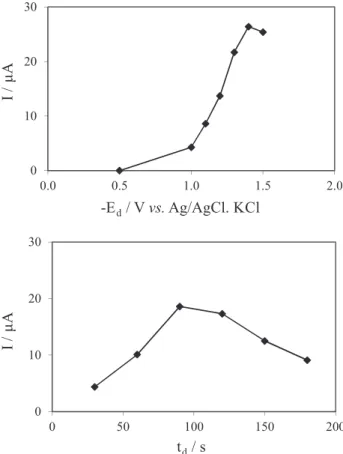
anodic stripping voltammetry, 10 Hz frequency, 50 mV amplitude and 25 mV step. The Ed was varied between −0.5 and −1.5 V, in combination with a deposition time of 90 s. The current intensity (I) increased with the Ed decreasing, having a maximum at −1.4 V (Figure 3a). The td was
varied between 30 and 180 s, while a potential of −1.4 V was applied. The maximum I was obtained for a 90 s td
(Figure 3b). It was then concluded that a Ed of −1.4 V and a td of 90 s are the optimum conditions for the deposition
of a better film in the glassy carbon.
The electrodeposition of the Bi was tested using a Bi solution in phosphate buffer (pH 7.4; 0.25 mol L-1),
constant. The objective was to investigate the possibility of shortening the analysis time, performing an in situ
deposition of Bi regarding the application of the methodology to the determination of diltiazem in biological matrices (namely urine). It was observed that the current intensity for the Bi decreased in phosphate buffer (Figure 4b) when compared with that obtained in acetate buffer (Figure 4a). It was also observed that the Bi peak in phosphate buffer appears in a more negative potential (from ca. −0.15 V in acetate buffer to ca. −0.25 V in phosphate buffer). These experimental results revealed that the ex situ deposition of the Bi film in acetate buffer
is always advantageous.
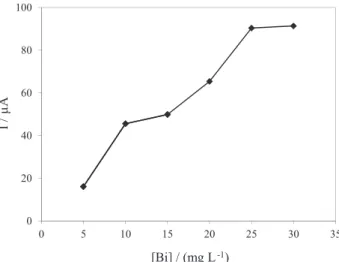
The bismuth concentration to be used on the BiFE was also varied between 5 and 30 mg L-1 using the previous
optimized conditions for the BiFE formation. For each of the concentration tested it was availed the peak intensity of a 450 µg L-1 diltiazem solution in phosphate buffer (pH 7.4; 0.25 mol L-1), after the ex situ deposition of
the Bi film in acetate buffer (pH 4.5; 0.10 mol L-1). The
current intensity for the diltiazem peak increased with the increasing in the Bi concentration used for the ex situ
formation of the BiFE, practically stabilizing at 30 mg L-1
Bi (Figure 5).
For the quantification of diltiazem in pharmaceutical samples the BiFE was prepared from a solution of Bi 5 mg L-1 similar to what had been done in previous
studies,11,38,39 as for the determination of diltiazem in
biological samples, wherein the expected levels of the drug can be quite low, it was decided by the formation of BiFE from a solution of 30 mg L-1 of Bi.
Figure 2. Voltammograms for 450 µg L-1 diltiazem in phosphate buffer (pH 7.4; 0.25 mol L-1) in (a) GCE and (b) BiFE. The scan parameters were: square wave cathodic voltammetry, 10 Hz frequency, 50 mV amplitude and 25 mV step.
Figure 3. Influence of (a) Ed and (b) td in the current intensity (I) of a 5 mg L-1 Bi solution in acetate buffer (pH 4.5; 0.10 mol L-1).
Application of the BiFE to determination of diltiazem in pharmaceuticals and in urine samples
Calibration curves for pharmaceutical samples
Using the optimized experimental conditions, calibration curves for diltiazem were carried out between 90 and 900 µg L-1 in phosphate buffer (pH 7.4; 0.25 mol L-1),
using a 5 mg L-1ex situ Bi film (Figure 7a). The analytical
characteristics for the calibration graph and the related validation parameters are given in Table 1a. The limits of detection and quantification were calculated from the calibration curves as 3 and 10 s/m, respectively, where s is the standard deviation of the intercept and m denotes the slope of the calibration curve.40
The diltiazem signal stability was evaluated in a 450 µg L-1 diltiazem solution in phosphate buffer (pH 7.4; 0.25 mol L-1). The diltiazem signal was stable for at least
20 scans, with 1.6% relative standard deviation. All the pharmaceutical samples were analysed between this
Figure 5. Influence of the Bi concentration in the current intensity (I) in acetate buffer (pH 4.5; 0.10 mol L-1).
Optimization of the voltammetric determination of diltiazem
Scan parameters and Ed
The optimization of the scan parameters (frequency, amplitude, step) and of the Ed was carried out in a
450 µg L-1 diltiazem solution in phosphate buffer (pH 7.4; 0.25 mol L-1), after the ex situ deposition of the Bi film in
acetate buffer (pH 4.5; 0.10 mol L-1), using the previous
optimized conditions for the BiFE formation.
The cathodic scan was performed between −1.2 (Ei) and −1.6 V (Ef) after a te of 10 s, being the highest current
intensity for the diltiazem peak obtained with square wave, 10 Hz frequency, 50 mV amplitude and 25 mV step. It was also observed that the highest current intensity was obtained without deposition of diltiazem in the BiFE. The cathodic peak was observed at ca. −1.5 V (Figure 6). Cathodic scans with only the phosphate buffer (pH 7.4; 0.25 mol L-1)
were also performed to ensure that the electrode was not contaminated. To the removing of the Bi film, an anodic scan was executed between −1.1 (Ei) and 1.8 V (Ef).
Figure 6. Voltammograms for (a) 180 µg L-1 and (b) 450 µg L-1 diltiazem in phosphate buffer (pH 7.4; 0.25 mol L-1) in the BiFE. The scan parameters were: square wave cathodic voltammetry, 10 Hz frequency, 50 mV amplitude and 25 mV step.
Figure 7. Calibration curve in phosphate buffer (pH 7.4; 0.25 mol L-1) for (a) diltiazem between 90 µg L-1 and 900 µg L-1, using a 5 mg L-1
dynamic linear range, given that the amount of diltiazem is very high in the commercial dosage capsules, and to work with lower drug concentrations increased the introduction of dilution errors.
Interference studies
The effect of the main pharmaceutical excipients was studied. Solutions containing 450 µg L-1 diltiazem and the foreign compound at higher concentrations (maximum 100:1) were analysed. The interfering concentration of each compound was considered that which caused a variation in the response greater than or equal to ± 5% compared to the response obtained in its absence. The results showed that, at the concentrations in which they were present in the samples tested, none of the excipients interfered in the determination of diltiazem.
Analysis of pharmaceutical samples
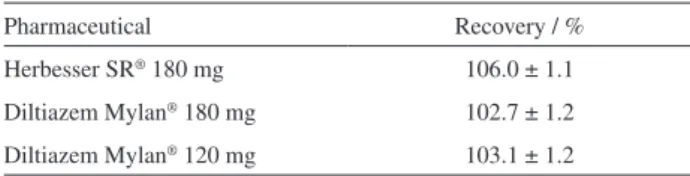
The methodology was applied to determination of diltiazem in pharmaceutical formulations. The determination of diltiazem recovery (Table 2) was carried out in 450 µg L-1 pharmaceutical solutions.
Calibration curves for urine samples
In the case of the urine samples, it was an option of the authors to optimize the methodology in order to determine the lowest possible concentration of the drug.
Calibration curves were carried out, using a 30 mg L-1
ex situ Bi film, between 45 and 270 µg L-1 in phosphate buffer
(pH 7.4; 0.25 mol L-1), under the optimized experimental
conditions (Figure 7b).The analytical characteristics for the calibration graph and the related validation parameters are given in Table 1b. The diltiazem signal stability was evaluated in a 90 µg L-1 diltiazem solution in phosphate
buffer (pH 7.4; 0.25 mol L-1). A 1.8% relative standard
deviation was obtained (20 scans).
Urine dilution
For the optimization of the urine dilution, the urine samples were diluted 1:200, 1:500 or 1:1000 in phosphate buffer (pH 7.4; 0.25 mol L-1) and spiked with 180 µg L-1
diltiazem, using a 30 mg L-1 ex situ Bi film and the
conditions previously optimized. It was observed that with a 1:1000 dilution the diltiazem peak in the urine sample appeared at the same potential (ca. −1.5 V) and with a very similar current intensity (23.7 µA) to that obtained for a 180 µg L-1 diltiazem solution in phosphate buffer (pH 7.4;
0.25 mol L-1).
Voltammetric response of two major metabolites of diltiazem Knowing that after its administration, diltizem is extensively metabolized by the liver to N-desmethyl
diltiazem and O-desacetyl diltiazem (Figure 8), and that O-desacetyl diltiazem is considered the major metabolite in
plasma, and N-desmethyl diltiazem the major unconjugated
metabolite in urine,33,39,40 the voltammetric response of those
metabolites was carried out.
The comparison of the voltammetric response was made in 180 µg L-1 solutions of diltiazem, O-desacetyl diltiazem
and N-desmethyl diltiazem in phosphate buffer (pH 7.4;
0.25 mol L-1), using the optimized parameters for the
voltammetric determination of diltiazem. It was observed that for the same concentration, O-desacetyl diltiazem
and N-desmethyl diltiazem have the same voltammetric
response of diltiazem, appearing at the same potential (ca. −1.5 V) and presenting the same current intensity. This result is in accordance with the fact that the cathodic peak is to be due to a reduction of the oxo group.22
Despite it was achieved the same voltammetric response for diltiazem and its major metabolites, the above method remains valid for the identification and/or quantification of total drug excreted in the urine, which is extremely important, in cases of critical care management of diltiazem overdose,27 and also in the analysis of
postmortem specimens following fatal cases of diltiazem overdose.41
Analysis of urine samples
The methodology was also applied to the determination of diltiazem in urine. The analytical data recovery in spiked urine samples are showed in Table 3.
Table 1. Analytical parameters for the calibration curves of diltiazem determination by square-wave voltammetry at the BiFE: (a) 5 mg L-1
ex situ Bi film; (b) 30 mg L-1ex situ Bi film
Parameter a b
Linear range / (µg L-1) 90 to 900 45 to 270
Slope / (µA µg-1 L) 0.0562 0.191
Intercept / µA 1.27 0.313
Correlation coefficient 0.994 0.998 Limit of detection / (µg L-1) 23 12
Limit of quantification / (µg L-1) 77 38
Table 2. Recoveries (%) (mean ± SD of n = 3 determinations) of diltiazem in a 450 µg L-1 pharmaceutical solution in phosphate buffer (pH 7.4;
0.25 mol L-1), using a 5 mg L-1ex situ Bi film
Pharmaceutical Recovery / %
Herbesser SR® 180 mg 106.0 ± 1.1
Table 3. Recoveries (%) (mean ± SD of n = 3 determinations) of diltiazem in spiked diluted (1:1000) urine samples, using a 30 mg L-1ex situ Bi film
Diltiazem spiked / (µg L-1) Recovery / %
45 97.8 ± 6.1
90 104.3 ± 6.3
135 106.1 ± 7.0
Figure 8. Chemical structures of diltiazem and two major metabolites.
Conclusions
This work describes a novel application of BiFE for the determination of the diltiazem calcium-channel blocker by square wave cathodic voltammetry. The comparison of BiFE with the GCE showed a superior performance of the BiFE. A single well-defined cathodic peak was observed on BiFE at ca. −1.5 V (versus Ag/AgCl reference electrode).
It was obtained a good linear response in the examined concentration range of 90-900 µg L-1 in pharmaceutical
samples and of 45-270 µg L-1 in human urine. An excellent
repeatability of 1.8% was achieved, even for the lowest concentration range. Furthermore, the developed work has contributed to extend the applicability of the BiFE to the analysis of organic compounds in biological matrices.
Acknowledgements
This work was funded by FCT through grant No. PEst-C/EQB/LA0006/2011.
References
1. Filipe, O. M. S.; Brett, C. M. A.; Talanta2003, 61, 643.
2. Ivanovskaya, E. A.; Bobleva, Y. V.; Karpov, R. S.; J. Anal. Chem.
2000, 55, 1077.
3. Uslu, B.; Ozkan, S. A.; Anal. Lett.2011, 44, 2644. 4. Wang, J.; Electroanal.2005, 17, 1341.
5. Economou, A.; Anal. Chim. Acta 2010, 683, 38. 6. Economou, A.; TrAC, Trends Anal. Chem.2005, 24, 334.
7. Prior, C.; Lenehan, C. E.; Walker, G. S.; Anal. Chim. Acta2007,
598, 65.
8. Wang, J.; Lu, J. M.; Hocevar, S. B.; Farias, P. A. M.; Ogorevc, B.;
Anal. Chem. 2000, 72, 3218.
9. Kokkinos, C.; Economou, A.; Current Anal. Chem. 2008, 4, 183. 10. Svancara, I.; Prior, C.; Hocevar, S. B.; Wang, J.; Electroanal.
2010,22, 1405.
11. Rodríguez, J. A.; Barrado, E.; Castrillejo, Y.; Santos, J. R.; Lima, J. L. F. C.; J. Pharm.Biomed. Anal.2007, 45, 47.
12. Sattayasamitsathit, S.; Thayarungkul, P.; Kanatharana, P.;
Electroanal.2007, 19, 502.
13. Bučková, M.; Gründler, P.; Flechsig, G. U.; Electroanal.2005,
17, 440.
14. Nigović, B.; Šimunić, B.; Hocevar, S.; Electrochim. Acta 2009,
54, 5678.
15. Campestrini, I.; de Braga, O. C.; Vieira, B. I. C.; Spinelli, A.;
Electrochim. Acta 2010, 55, 4970.
17. Jain, R.; Sharma, R.; J. Appl. Electrochem. 2012, 42, 341. 18. Alves de Lima, C.; Spinelli, A.; Electrochim. Acta2013, 107,
542.
19. Asbahr, D.; Figueiredo-Filho, L. C. S.; Vicentini, F. C.; Oliveira, G. G.; Fatibello-Filho, O.; Banks, C. E.; Sensor Actuat B-Chem
2013, 188, 334.
20. Catarino, R. I. L.; Conceição, A. C. L.; Garcia, M. B. Q.; Gonçalves, M. L. S.; Lima, J. L. F. C.; Correia dos Santos, M. M.; J. Pharm. Biomed. Anal.2003, 33, 571.
21. Wang, J.; Farias, P. A. M.; Mahmoud, J. S.; Analyst 1986, 111,
837.
22. Ghandour, M. A.; Kasim, E. A.; Ali, A. M. M.; El-Haty, M. T.; Ahmed, M. M.; J. Pharm.Biomed. Anal. 2001, 25, 443. 23. Roper, T. A.; Sykes, R.; Gray, C.; Postgrad Med. J.1993, 69,
474.
24. Bertera, F. M.; Mayer, M. A.; Opezzo, J. A. W.; Taira, C. A.; Bramuglia, G. F.; Höcht, C.; J. Pharmacol. Toxicol. Method. 2007, 56, 290.
25. Zhao, P.; Lee, C. A.; Kunze, K. L.; Drug Metab. Dispos. 2007,
35, 704.
26. Pozet, N.; Brazier, J. L.; Aissa, A. H.; Khenfer, D.; Fauncon, G.; Apoil, E.; Traeger, J.; Eur. J. Clin. Pharmacol. 1983, 24, 635.
27. Levine, M.; Curry, S. C.; Padilla-Jones, A.; Ruha, A. M.; Ann. Emerg. Med.2013, 62, 252.
28. Zendelovska, D.; Stafilov, T. E.; Stefova, M.; Anal. Bioanal. Chem. 2003, 376, 848.
29. Carignan, G.; Carrier, K.; Laganière, S.; Lessard, M.;
J. Chromatogr. B1995, 672, 261.
30. Mangani, F.; Luck, G.; Fraudeau, C.; Verette, E.; J. Chromatogr. A
1997, 762, 235.
31. Ascalone, V.; Locatelli, M.; Malavasi, B.; J. Chromatogr. B
1994, 657, 133.
32. Rahman, N.; Azmi, S. N. H.; Microchem. J.2006, 65, 39. 33. Georgita, C.; Albu, F.; David, V.; Medvedovici, A.; Biomed.
Chromatogr. 2008, 22, 289.
34. Dasandi, B.; Shah, S.; Shivprakash; J. Chromatogr. B2009,
877, 791.
35. Zejli, H.; Sharrock, P.; Hidalgo-Hidalgo de Cisneros, J. L.; Naranjo-Rodriguez, I.; Temsamani, K. R.; Talanta2005, 68, 79.
36. United States Pharmacopoeia, 24th Review; Mack Publishing
Co: Easton, PA, 2000.
37. Al-Ghamdi, A. F.; Kooli, F.; J. Mater. Environ. Sci.2013, 4, 762.
38. Leal, F.; Catarino, R.; Pimenta, A.; Souto, R.; Revista da Faculdade de Ciências da Saúde2009, 6, 220.
39. Leal, M. F. C.; Catarino, R. I. L.; Pimenta, A. M.; Souto, M. R. S.; Pinheiro, T. S. N.; Quim. Nova2012, 35, 1985.
40. Miller, J. C.; Miller, J. N. In Statistics for Analytical Chemistry,
4th edition, EllisHorwood, New York, 2002.
41. Romano, G.; Barbera, N.; Rossitto, C.; Spadaro, G.; J. Anal. Toxicol.2002, 26, 374.