www.geosci-instrum-method-data-syst.net/5/95/2016/ doi:10.5194/gi-5-95-2016
© Author(s) 2016. CC Attribution 3.0 License.
The Sodankylä in situ soil moisture observation network: an
example application of ESA CCI soil moisture product evaluation
Jaakko Ikonen1, Juho Vehviläinen1, Kimmo Rautiainen1, Tuomo Smolander1, Juha Lemmetyinen1, Simone Bircher2, and Jouni Pulliainen1
1Finnish Meteorological Institute, Arctic Research, Helsinki, Finland 2Centre d’Etudes Spatiales de la Biosphére (CESBIO), Toulouse, France
Correspondence to:Jaakko Ikonen ([email protected])
Received: 27 November 2015 – Published in Geosci. Instrum. Method. Data Syst. Discuss.: 21 December 2015 Revised: 30 March 2016 – Accepted: 11 April 2016 – Published: 29 April 2016
Abstract.During the last decade there has been considerable development in remote sensing techniques relating to soil moisture retrievals over large areas. Within the framework of the European Space Agency’s (ESA) Climate Change Ini-tiative (CCI) a new soil moisture product has been generated, merging different satellite-based surface soil moisture based products. Such remotely sensed data need to be validated by means of in situ observations in different climatic re-gions. In that context, a comprehensive, distributed network of in situ measurement stations gathering information on soil moisture, as well as soil temperature, has been set up in re-cent years at the Finnish Meteorological Institute’s (FMI) So-dankylä Arctic research station. The network forms a cali-bration and validation (CAL–VAL) reference site and is used as a tool to evaluate the validity of satellite retrievals of soil properties.
In this paper we present the Sodankylä CAL–VAL refer-ence site soil moisture observation network, its instrumen-tation as well as its areal representativeness over the study area and the region in general as a whole. As an example of data utilization, comparisons of spatially weighted average top-layer soil moisture observations between the years 2012 and 2014 against ESA CCI soil moisture data product esti-mates are presented and discussed. The comparisons were made against a single ESA CCI data product pixel encapsu-lating most of the Sodankylä CAL–VAL network sites. Com-parisons are made with daily averaged and running weekly averaged soil moisture data as well as through application of an exponential soil moisture filter. The overall achieved cor-relation between the ESA CCI data product and in situ obser-vations varies considerably (from 0.479 to 0.637) depending
on the applied comparison perspective. Similarly, depending on the comparison perspective used, inter-annual correlation comparison results exhibit even more pronounced variation, ranging from 0.166 to 0.840.
1 Introduction
During the last decade there has been considerable devel-opment in remote sensing techniques of soil moisture en-abling large-scale soil moisture observations (Dorigo et al., 2015). In 2009, the European Space Agency (ESA) launched the Soil Moisture and Ocean Salinity (SMOS) satellite (Kerr et al., 2010), the first space mission dedicated to soil mois-ture observations. In 2015 NASA’s Soil Moismois-ture Active and Passive (SMAP) mission was launched with the same ob-jective (Entekhabi et al., 2010, 2014). These advancements have placed soil moisture into one of the 50 essential climate variables collected by the global climate observing system to help the work of the United Nations Framework Convention on Climate Change (UNFCCC) and the Intergovernmental Panel on Climate Change (IPCC) (Dorigo et al., 2015). In that context, the ESA Climate Change Initiative (CCI) soil moisture product has recently been developed, merging dif-ferent satellite-based and a land surface model surface soil moisture products (Liu et al., 2011, 2012; Wagner et al., 2012). Remotely sensed data, such as the ESA CCI soil mois-ture data product, need to be validated by means of in situ ob-servations in different climatic regions. The multidisciplinary research centre of Sodankylä, in northern Finland, is con-sidered as one of the most complete terrestrial environment monitoring stations in the Arctic region, collecting data from the sub-surface to the upper-atmosphere with continuous ob-servations dating back to 1908. It also hosts a network of automatic soil state observation stations, thus forming a cal-ibration and validation (CAL–VAL) reference site for Earth observation (EO) soil moisture data products.
The objective of this paper is to (1) present the Sodankylä soil moisture observation network established as part of the CAL–VAL reference site, its instrumentation, and areal rep-resentativeness, as well as (2) to utilize the data collected by the in situ observation network to evaluate the accuracy of the ESA’s CCI soil moisture product over the study site, as an example case study. The procedures for choosing the representative sites for individual soil moisture network sta-tions are discussed, as well as the development of a spa-tially weighted average estimate of top-layer (approximately 0–10 or 0–15 cm, depending on the soil type) soil moisture over the study area. Comparisons of in situ soil moisture ob-servations against ESA CCI soil moisture (Liu et al., 2011, 2012; Wagner et al., 2012) data are presented and discussed through various perspectives.
Ongoing SMOS CAL–VAL activities by means of the So-dankylä in situ soil moisture data set (e.g. algorithm adap-tations for organic substrate, soil moisture retrieval under forest, and wetlands) will be the subject of another article planned for the near future.
2 Sodankylä region soils and landscape
The Sodankylä region represents a typical northern boreal forest/taiga environment; 71 % of the surrounding landscape,
within an 80 km radius is forested. While open and forested bogs cover 18 % of the area. The landscape is relatively flat with moderate hills reaching 505 m a.m.s.l. (metres above mean sea level), while the lowest point within the area is at a height of 91 m a.m.s.l.
Soils within the Sodankylä region have only been formed fairly recently, after the last, Weichselian glaciation, pe-riod (Sippola and Yli-Halla, 2005; Yli-Halla and Mokma, 2002). Owing to rather weak development due to weathering-resistant felsic parent material and a cool climate, the soils of the Sodankylä region have been classified according to na-tional standards and mapped, primarily by GTK (Geologi-cal Survey of Finland) according to grain size and content of organic matter. Little attention has been paid to pedogenic classification. Grain size and organic-matter-based classifi-cation serves practical soil-related activities in Finland well; however, this makes it difficult to present soil data from Fin-land in an international context. During the last few years, soil classes based on the Finnish classification system have been related to the Food and Agriculture Organization of the United Nations’ (FAO) World Reference Base (WRB) pe-dogenic classification systems by MTT (Agrifood Research Finland). We have combined national GTK Quaternary de-posits map data with northern Finland MTT pedogenic soil map units, Corine 2006 land cover information, and in situ field campaigns to produce a new detailed pedogenic soil map of the Sodankylä region.
Glacial till (moraine) is the most widespread deposit in the region and is primarily covered by sparse and relatively dense pine forests. Peatlands, formed in depressions in glacial till and moist semi-organic soils with mixed forests (mostly Pine, Spruce, and Birch) are also widespread. podzolization is the primary pedogenic process within the region, although the podzolization process is clearly fairly week in parts of the region. As is the case in other parts of Finland, soils devel-oped on sandy and loamy glacial till are often weakly pod-zolized and marginally meet the requirements of Podzols of the WRB system (Yli-Halla and Mokma, 2002).
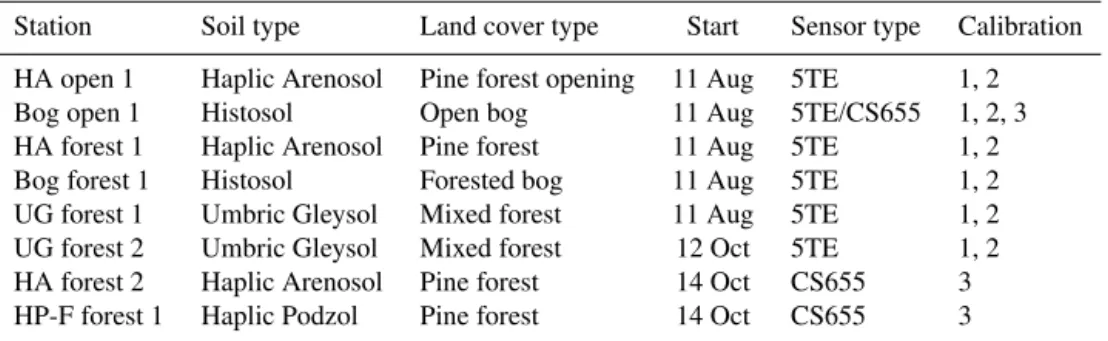
Table 1.Stations names, representative soil, and land cover types and start of observations as month/year. The sensor types are given as Decagon Devices Inc. 5TE (5TE) and Campbell Scientific Ltd. CS655 (CS655). The last column provides calibration curve information; 1 is factory calibration for mineral soil for 5TE, 2 is custom calibration for organic soil for 5TE (Bircher et al., 2016), and 3 is factory calibration for mineral soil for CS655.
Station Soil type Land cover type Start Sensor type Calibration
HA open 1 Haplic Arenosol Pine forest opening 11 Aug 5TE 1, 2 Bog open 1 Histosol Open bog 11 Aug 5TE/CS655 1, 2, 3 HA forest 1 Haplic Arenosol Pine forest 11 Aug 5TE 1, 2 Bog forest 1 Histosol Forested bog 11 Aug 5TE 1, 2 UG forest 1 Umbric Gleysol Mixed forest 11 Aug 5TE 1, 2 UG forest 2 Umbric Gleysol Mixed forest 12 Oct 5TE 1, 2 HA forest 2 Haplic Arenosol Pine forest 14 Oct CS655 3 HP-F forest 1 Haplic Podzol Pine forest 14 Oct CS655 3
from Fig. 5 this soil type only covers a small portion of the area (2 %). The remainders of soil types within the Sodankylä region consist predominantly of exposed bedrock (6 %) and Leptosols formed through both glacial erosion and weather-ing. They are found mainly on hill tops and on slopes, and are generally devoid of trees and are incapable of holding water.
3 In situ measurements, sites, and representativeness 3.1 Network set-up
The soil moisture stations within the Sodankylä CAL– VAL site are based on Campbell Scientific Ltd. CR850 and CR1000 data loggers. The electromagnetic (EM) sensors utilized are Decagon 5TE and more recently Campbell Sci-entific Ltd. CS655 digital soil moisture sensors measuring di-electric constant, di-electric conductivity, and soil temperature. The measurement principle in Decagon 5TE is based on a ca-pacitance technique in which the sensor supplies a 70 MHz oscillating wave to the sensor prongs that change according to the dielectric constant of the material (Vaz et al., 2013; Decagon Devices Inc., 2014). The CS655 measurement is based on the so-called transmission line oscillation (TLO) technique in which the sensor sends electromagnetic pulses along its two stainless steel rods at a frequency of 175 MHz. The sensor then measures the time period the signal takes to propagate to the end of the rods and back. As the wa-ter content in soil increases the propagation velocity of the signal decreases because of increasing dielectric permittiv-ity (Vaz et al., 2013; Campbell Scientific Ltd., 2015). Both sensors have calibration equations that convert the raw EM data to bulk dielectric conductivity (Decagon Devices Inc., 2014; Campbell Scientific Ltd., 2015). The accuracy of the Decagon 5TE soil moisture sensors in mineral soil is reported to be±0.030 cm3cm−3by the manufacturer, while the accu-racy of the CS655 sensors in mineral soil is reported to be ±0.025 cm3cm−3by the manufacturer. In Vaz et al. (2013) the corresponding accuracies in mineral soil have, however, been found to be±0.040 and±0.129 cm3cm−3. The
accu-racy of the Decagon 5TE soil moisture sensors in organic soil (>30 % organic) has been assessed in (Bircher et al., 2016). In their study an accuracy of±0.070 cm3cm−3is reported.
The relationship between dielectric permittivity and volu-metric water content in mineral soils by Topp et al. (1980) is used to convert sensor output to soil moisture. Based on comparisons with volumetric soil moisture estimates from gravimetric sampling, the Topp equation yields satisfactory results for mineral soils with low organic matter content. Considerable effort has been placed on calibration of the Decagon 5TE soil moisture sensors measuring the volumet-ric water content in organic layers within the Sodankylä area. As a result of these efforts, a new calibration function has been derived and recently applied to soil moisture measure-ments in organic layers (Bircher et al., 2016). Equal efforts for the more recently installed Campbell Scientific CS655 sensors are underway and planned for the summer of 2016.
Each station has one vertical measuring profile and two additional horizontal measuring points. The vertical profiles have five sensors placed close to the station at the follow-ing depths:−80,−40, −20,−10,−5 cm in mineral soils, and−40,−30,−20,−10,−5 cm in organic bog type soils. The two additional horizontal measuring points have been in-stalled approximately 10 m from the station in opposing di-rections, in order to catch small-scale variations in soil mois-ture of the uppermost layer. Both of these measuring points have two sensors at depths of−10 and−5 cm.
Currently eight soil moisture stations have been installed around the Sodankylä CAL–VAL site. See Table 1 for a list of the stations and their soil/land cover types, sensor types, and different measurement calibrations types used. Figures 1 and 2 depict the locations of the CAL–VAL sites.
Figure 1.Locations of the Sodankylä study area, FMI’s soil mois-ture CAL–VAL sites, the field campaign measurement sites and the ESA CCI soil moisture data product pixel.
Figure 2. Distribution of FMI’s soil moisture CAL–VAL sites within the ESA CCI soil moisture data product pixel. The in situ ob-servation sites indicated in yellow (HA forest 2 and HP-F forest 1) where not included in deriving in situ soil moisture comparison re-sults against the ESA CCI data soil moisture product.
in situ station (UG forest 2) was installed in close proximity to the UG forest 1 station for UG forest 1 station data verifi-cation purposes. As such, this in situ site is not very signifi-cant when considering its location and does not contribute to increasing the areal representativeness of the in situ observa-tion network. Following wider area field campaigns in 2014 it was acknowledged that the in situ network should be ex-panded to cover a more diverse range of soil and land cover types. Therefore, two new (HA forest 2 and HP-F forest 1) in situ sites were established. Further new in situ observation sites will be installed during 2016 providing improved areal representativeness of the soil moisture observation network as a whole. This will include the relocation of the UG for-est 2 station as mentioned above.
3.2 Creation of an area-representative in situ soil moisture average
Based on land cover and soil type information, an area-representative average of the in situ observations within the Sodankylä area have been derived for comparison with EO data-based soil moisture estimates, in this case the
Table 2.The respective areal averaging weights used in ESA CCI data comparison/year for each in situ observation site.
Station Weight Weight Weight Weight 2012 2013 2014 2015
(not used)
HA open 1 0.193 0.193 0.193 0.064 Bog open 1 0.109 0.109 0.109 0.109 HA forest 1 0.467 0.467 0.467 0.064 Bog forest 1 0.109 0.109 0.109 0.109 UG forest 1 0.122 0.061 0.061 0.061 UG forest 2 – 0.061 0.061 0.061
HA forest 2 – – – 0.064
HP-F forest 1 – – – 0.468
ESA CCI soil moisture product. One ESA CCI soil mois-ture pixel, covering an area of 26 km (north–south) by 10 km (west–east), over the Sodankylä CAL–VAL site, was se-lected. In situ soil moisture weights were defined based on percentages of composite classes of prevailing soil type and land cover information within the area. Soil moisture from the individual network stations was then multiplied with these weights in order to create a spatially weighted average value, representative of the ESA CCI pixel. Table 2 gives an overview over the applied weights. The applied weights were redistributed when new stations were added to the network. In practice, in reference to our comparison study, only one new station was added; UG forest 2. In order to verify both the representativeness of the in situ observation sites and the accuracy of our soil type classification, field measurement campaigns were conducted between 24 and 25 June 2014 and on 12 October 2015. Field soil moisture measurements were made at 228 points on all major soil types within and below the organic litter layer (O and A horizons) represent-ing depths of approximately 5 and 10 cm on average. The measurements were conducted with hand held ML2X theta probes. Pictures of the top soil profile and surrounding area were also taken. As expected, the field measurements of soil moisture in each soil type exhibit a large degree of local vari-ability. Despite this variability a clear trend in average soil moisture for each soil type can be observed, with heavier (Eutric Regosol and Umbric Gleysol) soils generally holding more water compared to lighter (Haplic Podzol and Haplic Arenosol) soils. The field campaign results show that the So-dankylä CAL–VAL soil moisture network automatic in situ observations correspond fairly well with the average of field campaign soil moisture measurements in each representative soil type (see Fig. 6). Moreover, the field campaigns were also able to distinguish differences in Haplic Podzol water holding capacity, with coarse Haplic Podzol being able to hold on average slightly less water than fine Haplic Podzol (see Fig. 6).
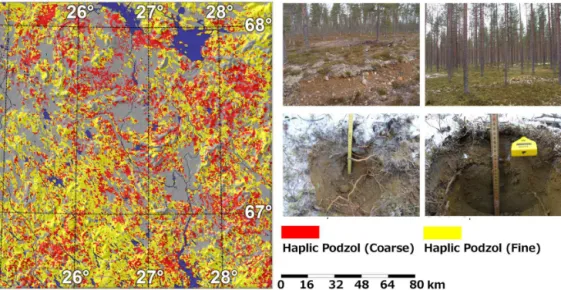
Figure 3.Distribution of Haplic Podzols within the Sodankylä region (left panel) and typical top soil profiles and vegetation (right panels).
Figure 4.Distribution of organic (Histosols) and semi-organic (Umbric Gleysols) soils within the Sodankylä region (left panel) and typical top soil profiles and vegetation (right panels).
Sodankylä in situ observation network to improve the repre-sentative coverage of the Sodankylä CAL–VAL area was rec-ognized. At the time of the first field campaigns (June 2014) the in situ observation network was found to cover an es-timated 42 % of the selected ESA CCI soil moisture pixel in terms of soil types and land cover. This conclusion was drawn in hindsight after comparing field campaign measure-ments against the results of the new soil type classification and mapping effort. Following new station (HA forest 2 and HP-F forest 1) installations in October 2014, this cov-erage was increased to between 64 and 89 %, depending on the strictness of Haplic Podzol definitions between fine and coarse types. Further new stations are due to be installed in 2016, with the aim of achieving close to 100 % represen-tative areal coverage.
Figure 5.Distribution of other less dominant soils; exposed bedrock, Leptosols, Eutric Regosols and Haplic Arenosols within the Sodankylä region (left panel) and a typical Arenosol top soil profile and vegetation (right panels).
Figure 6.Comparisons of soil moisture data from the June 2014 field campaign measured with hand held Delta-T Theta Probes and from Sodankylä automatic soil moisture network stations, catego-rized by soil types. The error bars represent the range of field cam-paign soil moisture measurements, with the blue error bar indicat-ing measurements conducted on 24 June while the red error bar indicates measurements taken on 25 June. As can be observed, the automatic in situ observations on the corresponding days fall well within the average of field campaign measurements for each soil type measured. The only exception to this is UG forest 2 site data, which appears to over estimate soil moisture. Consequentially plans exist to move this site to another location.
we chose the HA forest 1 site on Haplic Arenosol as the sur-rogate. This site tends to hold more water than the HA open 1 site and although generally not as moist as the HP-F forest 1 site, it, out of all the options, most closely resembles that of the HP-F forest 1 site. Figure 7 illustrates the impact of the new station (HP-F forest 1) installation on spatially weighted average top soil (0–10 cm depth) moisture in comparison to spatially weighted average soil moisture without the new
sta-Figure 7.Illustration of the impact of the new station (HP-F for-est 1) installation on spatially weighted average top-layer soil mois-ture in comparison to average soil moismois-ture without the new station between 1 June 2015 and 30 September 2015.
tion between 1 June and 30 September 2015. As expected us-ing the HA forest 1 as the surrogate for Haplic Podzol soils (fine and coarse) results in generally lower soil moisture lev-els. Figure 7 also illustrates the difference in soil moisture observations between the surrogate; HA forest 1 site, and the actual HP-F forest 1 site independently. Although the dif-ference in the two is quite pronounced, the overall weighted effect is less notable.
4 The ESA CCI soil moisture product
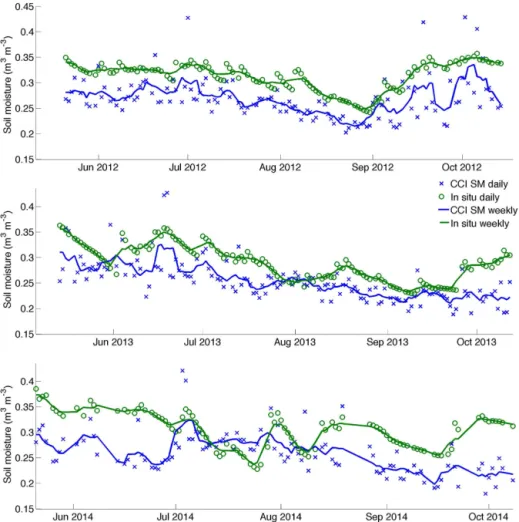
Mi-Figure 8.Time series of daily and weekly averaged top soil layer ESA CCI soil moisture data product estimates in comparison against daily and weekly averaged spatially weighted areal average in situ observations for the years 2012, 2013, and 2014.
crowave Instrument Wind Scatterometer (AMI-WS) (prior to 2007) and Advanced Scatterometer (ASCAT) instruments. The passive product is based on merging derived soil mois-ture data from Scanning Multichannel Microwave Radiome-ter (SMMR), the Special Sensor Microwave Imager (SSM/I), the Tropical Rainfall Measuring Mission’s (TRMM) Mi-crowave Imager (TMI), Advanced MiMi-crowave Scanning Ra-diometer – Earth Observing System (AMSR-E), and the Ad-vanced Microwave Scanning Radiometer 2 (AMSR2) instru-ments (Chung et al., 2014b).
The generation of the ESA CCI soil moisture data set involves three steps: (1) merging the original passive mi-crowave soil moisture products into one product, (2) merg-ing the original active microwave soil moisture products into one product, and (3) blending the two merged prod-ucts into one final data set together with the GLDAS (Global Land Data Assimilation System) model estimates. The in-put data sets for generating the merged soil moisture prod-uct consist of (1) scatterometer-based soil moisture prodprod-ucts, (2) radiometer-based soil moisture products, (3) modelled 0– 10 cm soil moisture from the Noah land surface model of
the GLDAS version 1. In step 3 the active and passive data sets are blended together by re-scaling both to GLDAS-Noah soil moisture data values with a cumulative distribution func-tion (CDF) matching approach. This imposes GLDAS-Noah model-based absolute value ranges on the original EO obser-vations, but does not have an effect on the original EO data dynamics (Chung et al., 2014b). As part of the steps used to create the merged ESA CCI data product, it is stated that the use of GLDAS-Noah model data to impose absolute soil moisture values to the ESA CCI data product renders statisti-cal comparison metrics, such as root mean square difference (RMSD) and bias, somewhat scientifically meaningless. The ESA CCI soil moisture product should in fact be used, and considered as a reference product for computing correlation statistics, not as an absolute soil moisture content estimate (Wagner et al., 2012).
Table 3.Top soil layer ESA CCI soil moisture data product estimate comparison metrics/year against weighted areal average in situ obser-vations.
Year/interval No. Correlation Unbiased Bias
observations RMSE
2014 (daily) 102 0.186 0.049 −0.046
2014 (weekly) 102 0.166 0.040 −0.046
2014 (exp.T=1.0) 102 0.219 0.044 −0.046 2014 (exp.T=3.5) 102 0.204 0.041 −0.045
2013 (daily) 134 0.621 0.033 −0.035
2013 (weekly) 134 0.813 0.020 −0.035
2013 (exp.T=1.0) 134 0.707 0.027 −0.035 2013 (exp.T=3.5) 134 0.782 0.022 −0.034
2012 (daily) 128 0.551 0.034 −0.044
2012 (weekly) 128 0.840 0.015 −0.044
2012 (exp.T=1.0) 128 0.672 0.025 −0.044 2012 (exp.T=3.5) 128 0.833 0.015 −0.044 2012-2014 (daily) 364 0.479 0.039 −0.041 2012–2014 (weekly) 364 0.637 0.026 −0.041 2012–2014 (exp.T=1.0) 364 0.559 0.032 −0.041 2012–2014 (exp.T=3.5) 364 0.629 0.028 −0.041
Table 4.Top soil layer temporal correlation statistics between spa-tially weighted daily in situ data and ESA CCI soil moisture anoma-lies.
Year 7-day 15-day 31-day deviation deviation deviation
2014 0.22 0.36 0.29 2013 0.19 0.24 0.17 2012 0.15 0.21 0.18
Meesters et al., 2005). The VOD value is used to iden-tify sparsely vegetated areas from densely vegetated areas (e.g. boreal forests). The active soil moisture product is used in areas with high VOD values (i.e. higher than a predefined threshold), whereas the passive product is used in areas with low VOD values, i.e. in semi-arid and arid regions (Chung et al., 2014b; Wagner et al., 2012). Dorigo et al. (2015) ex-plained in depth the effect of vegetation on soil moisture re-trievals using both active and passive instruments. For the Sodankylä region only active microwave data are used, since from the perspective of the ESA CCI product merging algo-rithm, the Sodankylä region falls within a region with high vegetation density, exceeding the predefined threshold value. The daily summer period overpass times of ASCAT, over the Sodankylä study area, between the years 2012 and 2014 are 07:00 UTC (44 times), 08:00 UTC (2 times), 10:00 UTC (5 times), 16:00 UTC (94 times), 17:00 UTC (50 times), 18:00 UTC (26 times), and 19:00 UTC (170 times).
5 Comparisons and results
Comparisons of top-layer soil moisture around the So-dankylä CAL–VAL site between the years 2012 and 2014 us-ing ESA CCI soil moisture data against in situ network obser-vations were conducted. The comparisons were made against a single ESA CCI data product pixel encapsulating most of the Sodankylä observation sites. Soil type classification-based map unit areas within the ESA CCI data pixel were used to derive in situ observation spatially representative weights. The respective weights for each in situ observation site are provided in Table 2. Since ESA CCI data are, at the time of writing, only available prior to 2015 our comparisons are made against in situ weights using the HA forest 1 site as a surrogate for the HP-F forest 1 site as described in Sect. 3. Comparisons have been made against both daily average ESA CCI soil moisture estimates data (if more than one over-pass occurred on that day) and against weekly running av-erage (in situ and ESA CCI data) values (see Figs. 10–13). Further, we have experimented with applying an exponential filter proposed by Wagner et al. (1999) to relate ESA CCI soil moisture measurements to the used in situ measurement depths. In our application we have used a simple recursive formulation of this method, which is given as
SMn=SMn−1+Kn⌊CCI(tn)−SMn−1⌋,
where SMn is the filtered ESA CCI soil moisture estimate and CCI is the unfiltered ESA CCI data product to which the exponential soil moisture filter is applied to, while the gainKnin timetnis given as (in a recursive form)
Kn=
Kn−1
Kn−1+e− tn−tn−1
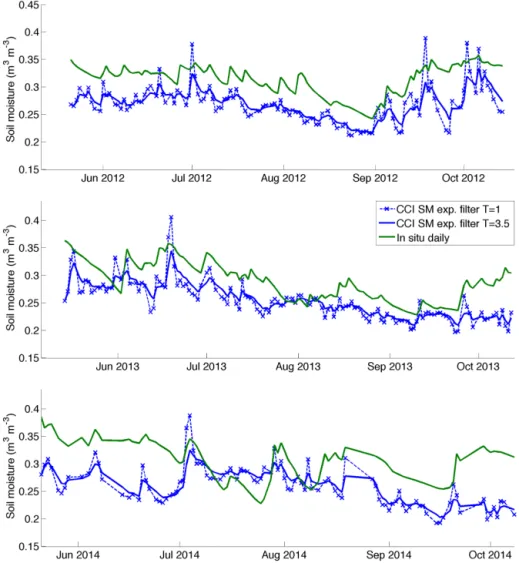
Figure 9.Time series of daily averaged top soil layer ESA CCI soil moisture data product estimates using exponential filters withTparameter values of 1 and 3.5 in comparison against spatially weighted areal average daily in situ observations for the years 2012, 2013, and 2014.
whereT is the temporal variation of soil moisture within the root-zone profile (in days), whileKnranges from 0 to 1 (see Fig. 9). Further information on the theoretical basis and ap-plication of the exponential filter used in our study can be found in Brocca et al. (2011).
Top soil moisture for each in situ site are approximated from 5 cm depths apart from sites on Umbric Gleysol soil (UG forest 1 and UG forest 2 sites), where the organic layer is typically much thicker than in, e.g., Podzol soils. With these in situ sites, top soil moisture is approximated from depths of 10 cm. Soil moisture comparisons are only conducted dur-ing snow-free and thawed periods, as the presence of snow and soil frost interfere with EO data-based soil moisture re-trievals (Chung et al., 2014a), such as is the case with the ESA CCI data product. Snow-free and thawed conditions are determined by a data quality filter provided as a part of the ESA CCI product itself (Scipal et al., 2005) combined with direct Sodankylä CAL–VAL site snow observations.
Figures 7 and 8 show daily and weekly ESA CCI and in situ soil moisture time series as well as corresponding scatter plots for the years 2012, 2013, and 2014, separately. Cor-responding statistical metrics can be found in Table 3. The overall correlation between the daily ESA CCI data prod-uct and daily spatially weighted average in situ observa-tions is rather low at 0.479. The best values are achieved in 2012 and 2013 at 0.551 and 0.621, respectively. In 2014 the correlation is very low at only 0.186. The overall un-biased root mean square error (RMSE) is generally rela-tively low at 0.039, with the highest RMSE value (0.049) observed for 2014. All years exhibit a negative bias ranging from 0.0346 to 0.046.
(tem-Figure 10.Scatter plot of daily averaged top soil layer ESA CCI soil moisture data product estimates using an exponential filterT param-eter value of 1 against spatially weighted areal average daily in situ observations for the years 2012, 2013, and 2014.
Figure 11.Scatter plot of daily averaged top soil layer ESA CCI soil moisture data product estimates using an exponential filterT pa-rameter value of 3.5 against spatially weighted areal average daily in situ observations for the years 2012, 2013, and 2014.
poral variation of soil moisture within the root-zone profile, in days). In deriving our comparison results we have as-sumed aT parameter value of 3.5 as suggested by Brocca et al. (2011). We have also included comparison results using aT parameter value of 1 in order to demonstrate the sensi-tivity of this parameter to the filter. The average overall daily correlation between the ESA CCI data product and spatially weighted average in situ observations improves from 0.479 to 0.629 when assigning a T parameter value of 3.5 and to 0.559 when aT parameter value of 1 is assigned. The im-provement in correlation between in situ data and ESA CCI estimates in 2012 ranges from 0.551 to 0.833 depending on which T parameter value is used. Similarly, the improve-ment in correlation between in situ data and ESA CCI es-timates in 2013 ranges from 0.562 to 0.782, again depending on whichT parameter value is used. In general correlations
Figure 12.Scatter plot of daily averaged top soil layer ESA CCI soil moisture data product estimate comparison against daily spatially weighted areal average in situ observations for the years 2012, 2013, and 2014.
Figure 13.Scatter plot of weekly running average top soil layer ESA CCI soil moisture data product estimate comparison against weekly running average spatially weighted areal average in situ ob-servations for the years 2012, 2013, and 2014.
are better with aT parameter value of 3.5. Interestingly the application of the exponential filter has very little effect on correlation results for the year 2014, and, in fact, the corre-lation is lower when aT parameter value of 3.5 is assigned compared to when a value of 1 is assigned, albeit the effect is rather insignificant.
The temporal correlation statistics between spatially weighted daily in situ data and ESA CCI soil moisture anomalies are very low. Anomaly correlations have been esti-mated by calculating the difference to a moving average and scaling it to the standard deviation, as in Brocca et al. (2011). Three different anomalies were considered: (1) deviation from 7-day average, (2) deviation from 15-day average, and (3) deviation from 31-day average. The corresponding sta-tistical metrics can be found in Table 4. The low anomaly correlations indicate that the ESA CCI soil moisture prod-uct is unable to capture rapid changes in top-layer soil mois-ture. Interestingly the anomaly correlations are in all cases higher for 2014, although the performance of the ESA CCI soil moisture product is clearly lower according to our com-parisons against spatially weighted in situ data in 2014. The higher anomaly correlations for 2014 are, however, not sig-nificantly higher, and therefore as such do not provide an explanation to the poor comparison statistics for 2014. In fact, the higher anomaly correlations for 2014 are unex-pected since the comparison statistics for 2014 against spa-tially weighted in situ data are significantly poorer compared to 2012 and 2013.
The general in situ observation soil moisture trend during the summer of 2012 is descending, while switching to an as-cending trend towards the autumn period. In 2013 the overall in situ soil moisture observation trend is primarily descend-ing, with the exception of early summer and late autumn. These same general trends are also apparent in the ESA CCI data product, and therefore the correlations for these years are higher, as compared to 2014. It appears that in 2014 in situ observations exhibit larger wet–dry variation compared to the years 2012 and 2013, with no clear overall trend. In situ observation variation and lack of a general trend is, however, not observable in the ESA CCI data product and the general trend, as in all other years is descending, resulting in consid-erably poorer correlation with both the daily and weekly spa-tially weighted average in situ observations. In conclusion, it is clear that there is better correlation between ESA CCI soil moisture estimates and daily spatially weighted average in situ observations during years exhibiting a long-term trend in the data and less short-term variation.
6 Discussion and conclusions
A comprehensive, distributed network of in situ measure-ment stations gathering information on soil moisture, as well as soil temperature, has been set up in recent years at the FMI Sodankylä Arctic research station. The network forms a tool to evaluate the validity of satellite retrievals of soil properties. The applicability of point-scale measurements to represent an area covered, especially, by coarse-scale passive microwave sensors is always a subject for debate; however, the employed land-cover sensitive scheme in this study ad-dresses the issue by applying spatial weight factors for
mea-surement stations according to their relative representative-ness following a new soil type classification. The classifica-tion will also be used to assist in the planning for installaclassifica-tion of new stations in the near future, with the aim of achieving improved representativeness of the region as a whole.
In our study, soil moisture measurements network data was compared in a land cover sensitive scheme to the blended soil moisture product of the ESA soil moisture CCI initiative over several summer periods. While the overall achieved correla-tion for the daily ESA CCI was low (0.479), this was largely the result of a single year of observations (2014) with poor correlation metrics.
The ESA CCI data product is derived from AMSR2 and/or ASCAT observations. In the case of the Sodankylä test site and surroundings, only ASCAT observations have been ap-plied. We assume that what is referred to as top-layer soil moisture, can in fact be considered to refer to soil moisture at a depth of only 1 cm or less. However, this has not been explicitly defined in the description of the ESA CCI data product, or definitively proved to be the case in other studies. Nicolai-Shaw et al. (2015) and Dorigo et al. (2015), how-ever, supported our initial assumption that the ESA CCI data product represents soil moisture data at a depth of 0–5 cm. Furthermore, in both of these examples ESA CCI soil mois-ture is compared to in situ soil moismois-ture observations made at depths of 5 or 10 cm.
Despite our initial assumption on ESA CCI data represen-tativeness in terms of depth, applying an exponential filter to relate ESA CCI data to depths that correspond with the used in situ observation depths can in our view supply valuable additional information. In general, applying an exponential filter to theoretically improve the relation of ESA CCI soil moisture estimates to in situ observation depths significantly improves correlation metrics. There exists, however, a pos-sible drawback in its application related to the need of an additional parameter,T (temporal variation of soil moisture within the root-zone profile, in days). Ideally this parameter needs to be regionalized and should possibly be dynamic, in that the value of theT parameter should ideally change ac-cording to soil moisture conditions below the target filtering depth. The uncertainty of theT parameter value comes with potentially undesirable characteristics in that it can be used incorrectly as a way to fit EO-based soil moisture data to in situ observations. In order to reduce uncertainty and the po-tential for fitting, a physiographic meaning should ideally be attached to the assignment of this value. The issue of apply-ing an exponential filter to adjust EO based soil moisture data and properT parameter value assignment could perhaps be a topic for an entirely separate study.
to artificially improve statistical metrics. However, in vari-ous operational activities such as terrain trafficability analy-sis, inflow forecasting for hydropower production and flood forecasting, identifying a longer-term trend in soil moisture data can be useful. Therefore, evaluating the accuracy of EO-based soil moisture data with this perspective is warranted, and in some cases even desirable.
It is apparent from the comparison results that the ESA CCI data product has issues with noise between obser-vation steps. Reduction of ESA CCI data noise by smooth-ing results to a runnsmooth-ing weekly average improves correlation against spatially weighted average in situ observations con-siderably. This could possibly point to issues stemming from ESA CCI data acquisition times. In Sodankylä, and in boreal and sub-arctic zones in general, moisture often condenses over night into morning dew on vegetation. This could inter-fere with active microwave soil moisture retrievals acquired during the early morning hours. In order to investigate this, we created a subset of comparisons where ESA CCI data collected during morning hours were removed. Comparisons were also conducted against hourly in situ observations cor-responding to ESA CCI data overpass times. However, nei-ther one of these comparisons resulted in significant changes in correlation, RMSE or bias. Therefore, it is not clear to us if these shortcomings are related to issues with the retrieval al-gorithm, scaling issues induced by the GLDAS-Noah model or possible issues associated with the LPRM model. The lat-ter, however, seems less likely according to our findings as diurnal effects of vegetation moisture do not appear to be the cause. The effect of conducting comparisons of spatially weighted daily average in situ moisture against ESA CCI soil moisture data, which is intervallic by nature, was also inves-tigated. However, as with the removal of observations con-ducted during morning hours, this also had little effect on any statistical metrics.
The apparent soil-moisture-scale difference (dry bias) be-tween spatially weighted average in situ observations and the ESA CCI data product is significant but not very meaningful. This is true even when it is likely that our weighted in situ average soil moisture level itself somewhat underestimates overall soil moisture content due to the use of surrogate in situ sites, as detailed in previous sections.
Further studies in to the apparent anomalies in the ESA CCI data product and assumption made in producing the data product should be conducted. For example, the va-lidity of using a single, inter-annually constant, correction variable to counter the effect of vegetation moisture interfer-ence in soil moisture retrieval should be assessed. Although our findings do not directly point to an issue related to this, it could still explain at least part of the noise and variabil-ity of soil moisture estimates between the daily time steps. Further comparisons and analysis of ESA CCI soil moisture data over larger (boreal) areas and longer time spans against
both in situ observations and distributed soil moisture model estimates will be performed in future studies.
Data availability
Data from the measuring stations are freely available from the web server of the Finnish Meteorological Institute http: //litdb.fmi.fi. Although the ESA CCI soil moisture data used in this study are not yet freely available to the public a pre-vious version can already by accessed through http://www. esa-soilmoisture-cci.org/node/145. The ESA CCI data ver-sion (v02.2) used in this study is scheduled for public re-lease in January 2016. At the time of writing version v02.2 data have gone through basic internal verification by the project consortium. Corine land cover data are freely avail-able through The European Environment Agency (EEA) at http://www.eea.europa.eu/data-and-maps/. Finnish Qua-ternary deposits map data are available through the Ge-ological Survey of Finland (GTK) data distribution ser-vice; http://www.gtk.fi/tietopalvelut/rajapintapalvelut/. Agri-food Research Finland (MTT) soil database data (1 : 250 000) are available through a Web Feature Service (WFS) provided by the Natural Resources Institute Finland; http://maps.luke. fi/geoserver/.
Author contributions. Jaakko Ikonen is the corresponding author having the overall responsibility of the manuscript and the anal-yses. Juho Vehviläinen wrote part of the introduction and station network set-up sections and has been developing the network of the soil moisture stations. Kimmo Rautiainen and Tuomo Smolan-der were responsible for the ESA CCI soil moisture analysis, Com-parisons and results, and Discussion sections. Juha Lemmetyinen, Simone Bircher and Jouni Pulliainen did extensive reviews and cor-rections to the manuscript.
Institute’s Sodankylä Arctic Research Center for conducting extensive field campaigns.
Edited by: C. Ménard
References
Bircher, S., Andreasen, M., Vuollet, J., Vehviläinen, J., Rautiainen, K., Jonard, F., Weihermüller, L., Zakharova, E., Wigneron, J.-P., and Kerr, Y. H.: Soil moisture sensor calibration for organic soil surface layers, Geosci. Instrum. Method. Data Syst., 5, 109–125, doi:10.5194/gi-5-109-2016, 2016.
Brocca, L., Hasenauer, S., Lacava, T., Melone, F., Moramarco, T., Wagner, W., Dorigo, W., Matgen, P., Martínez-Fernández, J., Llorens, P., Latron, J., Martin, C., and Bittelli, M.: Soil mois-ture estimation through ASCAT and AMSR-E sensors: An in-tercomparison and validation study across Europe, Remote Sens. Environ., 115, 3390–3408, 2011.
Campbell Scientific Ltd.: CS650 & CS655 Soil Water Content Re-flectometers, User manual, Campbell Scientific Ltd., Shepshed, Loughborough, UK, 1–56, 2015.
Chung, D., Dorigo, W., Hahn, S., Melzer, T., Paulik, C., Reimer, C., Vreugdenhil, M., Wagner, W., and Kidd, R.: Soil Moisture Retrieval from Active Microwave Sensors: Algorithm Theoret-ical Baseline Document, Version 2, available at: http://www. esa-soilmoisture-cci.org (last access: 15 October 2015), 2014a. Chung, D., Dorigo, W., Hahn, S., Melzer, T., Paulik, C., Reimer,
C., Vreugdenhil, M., Wagner, W., and Kidd, R.: ECV Pro-duction, Fusion of Soil Moisture Products: Algorithm Theoret-ical Baseline Document, Version 2, available at: http://www. esa-soilmoisture-cci.org (last access: 15 October 2015), 2014b. Decagon Devices Inc.: 5TE Water Content, EC and Temperature
Sensor, User manual, Decagon Devices Inc., Pullman, USA, 1– 26, 2014.
Dorigo, W. A., Wagner, W., Hohensinn, R., Hahn, S., Paulik, C., Xaver, A., Gruber, A., Drusch, M., Mecklenburg, S., van Oeve-len, P., Robock, A., and Jackson, T.: The International Soil Mois-ture Network: a data hosting facility for global in situ soil mois-ture measurements, Hydrol. Earth Syst. Sci., 15, 1675–1698, doi:10.5194/hess-15-1675-2011, 2011.
Dorigo, W. A., Gruber, A., De Jeu, R. A. M., Wagner, W., Stacke, T., Loew, A., Albergel, C.,Brocca, L., Chung, D., Parinussa, R. M., and Kidd, R.: Evaluation of the ESA CCI soil moisture product using ground-based observations, Remote Sens. Environ., 162, 380–395, 2015.
Entekhabi, D., Njoku, E. G., O’Neill, P. E., Kellogg, K. H., Crow, W. T., Edelstein, W. N., Entin, J. K., Goodman, S. D., Jackson, T. J., Johnson, J., Kimball, J., Piepmeier, J. R., Koster, R. D., Mar-tin, N., McDonald, K. C., Moghaddam, M., Moran, S., Reichle, R., Shi, J. C., Spencer, M. W., Thurman, S. W., Tsang, L., and Van Zyl, J.: The Soil Moisture Active Passive (SMAP) mission, Proc. IEEE, 98, 704–716, 2010.
Entekhabi, D., Yueh, S., O’Neill, P., Kent, K. H., Allen, A., Bindlish, R., Brown, M., Chan, S., Colliander, A., Crow, W. T., Das, N., De Lannoy, G., Dunbar, R. S., Edelstein, W. N., Entin, J. K., Escobar, V., Goodman, S. D., Jackson, T. J., Jai, B., and Johnson, J.: SMAP handbook, in: JPL Publication JPL
400-1567, editetd by: Laboratory, J. P., NASA CalTech, Pasadena, CA, USA, 1–192, 2014.
Kerr, Y. H., Waldteufel, P., Wigneron, J.-P., Delwart, S., Cabot, F., Boutin, J., Escorihuela, M.-J., Font, J., Reul, N., Gruhier, C., Ju-glea, S. E., Drinkwater, M. R., Hahne, A., Martin-Neira, M., and Mecklenburg, S.: The SMOS mission: new tool for monitoring key elements of the global water cycle, Proc. IEEE, 98, 666–687, 2010.
Legates, D. R., Mahmood, R., Levia, D. F., DeLiberty, T. L., Quir-ing, S. M., and Houser, C.: Soil moisture: a central and unify-ing theme in physical geography, Prog. Phys. Geogr., 35, 65–86, 2011.
Liu, Y. Y., Parinussa, R. M., Dorigo, W. A., De Jeu, R. A. M., Wag-ner, W., van Dijk, A. I. J. M., McCabe, M. F., and Evans, J. P.: De-veloping an improved soil moisture dataset by blending passive and active microwave satellite-based retrievals, Hydrol. Earth Syst. Sci., 15, 425–436, doi:10.5194/hess-15-425-2011, 2011. Liu, Y. Y., Dorigo, W. A., Parinussa, R. M., de Jeu, R. A. M.,
Wag-ner, W., McCabe, M. F., Evans, J. P., and van Dijk, A. I. J. M.: Trend-preserving blending of passive and active microwave soil moisture retrievals, Remote Sens. Environ., 123, 280–297, 2012. Meesters, A., de Jeu, R. A. M., and Owe, M.: Analytical derivation of the vegetation optical depth from the microwave polarization difference index, IEEE Geosci. Remote Sens., 2, 121–123, 2005. Nicolai-Shaw, N., Hirschi, M., Mittelbach, H., and Seneviratne, S.: Spatial representativeness of soil moisture using in situ, remote sensing, and land reanalysis data, J. Geophys. Res.-Atmos., 120, 9955–9964, 2015.
Owe, M., de Jeu, R., and Holmes, T.: Multisensor historical clima-tology of satellitederived global land surface moisture, J. Geo-phys. Res.-Ea. Surf., 113, F01002, doi:10.1029/2007JF000769, 2008.
Reick, C. H., Raddatz, T., Brovkin, V., and Gayler, V.: The rep-resentation of natural and anthropogenic land cover change in MPI-ESM. J. Adv. Model. Earth Syst., 5, 459–482, doi:10.1002/jame.20022, 2013.
Roeckner, E., Bäuml, G., Bonaventura, L., Brokopf, R., Esch, M., Giorgetta, M., Hagemann, S., Kirchner, I., Kornblueh, L., Manzini, E., Rhodin, A., Schlese, U., Schulzweida, U., and Tompkins, A.: The Atmospheric General Circulation Model ECHAM 5. PART I: Model Description, Report No. 349, Max Plack Insitute for Meteorology, Hamburg, 1–140, 2003. Scipal, K., Naeimi, V., and Hasenauer, S.: Definition of Quality
Flags, ASCAT Soil Moisture Report Series, Vienna University of Technology, Vienna, 1–25, 2005.
Sippola, J. and Yli-Halla, M.: Status of soil mapping in Finland, European Soil Bureau Research Report 9, in: Soil Resources of Europe, 2nd Edn., edited by: Jones, R. J. A., Houšková, B., Bul-lock, P., and Montanarella, L., European SoilBureau Research Report No. 9, EUR 20559 EN, Office for OfficialPublications of the European Communities, Luxembourg, 133–138, 2005. Stocker, T. F., Qin, D., Plattner, G.-K., Alexander, L. V., Allen, S.
Cli-mate Change 2013: The Physical Science Basis, Contribution of Working Group I to the Fifth Assessment Report of the Intergov-ernmental Panel on Climate Change, edited by: Stocker, T. F., Qin, D., Plattner, G- K., Tignor, M., Allen, S. K., Boschung, J., Nauels, A., Xia, Y., Bex, V., and Midgley, P. M., Cambridge Uni-versity Press, Cambridge, UK and New York, NY, USA, 33–118, 2013.
Topp, G. C., Davis, J. L., and Annan, A. P.: Electromagnetic deter-mination of soil water content: measurement in coaxial transmis-sion lines, Water Resour. Res., 16, 574–582, 1980.
Vaz, C. M. P., Jones, S., Meding, M., and Tuller, M.: Eval-uation of standard calibration functions for eight electro-magnetic soil moisture sensors, Vadose Zone J., 12, 1–16, doi:10.2136/vzj2012.0160, 2013.
Wagner, W., Lemoine, G., and Rott, H.: A method for estimat-ing soil moisture from ERS scatterometer and soil data, Remote Sens. Environ., 70, 191–207, 1999.
Wagner, W., Dorigo, W., de Jeu, R., Fernandez, D., Benveniste, J., Haas, E., and Ertl, M.: Fusion of active and passive microwave observations to create an essential climate variable data record on soil moisture, ISPRS Annals of the Photogrammetry, Remote Sensing and Spatial Information Sciences (ISPRS Annals), Vol-ume I-7, XXII ISPRS Congress, 25 August–1 September 2012, Melbourne, Australia, 315–321, 2012.