ACPD
12, 21923–21945, 2012Impact of VSL halogens on ozone
and UV radiation
S. Tilmes et al.
Title Page
Abstract Introduction
Conclusions References
Tables Figures
◭ ◮
◭ ◮
Back Close
Full Screen / Esc
Printer-friendly Version
Interactive Discussion
Discussion
P
a
per
|
Dis
cussion
P
a
per
|
Discussion
P
a
per
|
Discussio
n
P
a
per
|
Atmos. Chem. Phys. Discuss., 12, 21923–21945, 2012 www.atmos-chem-phys-discuss.net/12/21923/2012/ doi:10.5194/acpd-12-21923-2012
© Author(s) 2012. CC Attribution 3.0 License.
Atmospheric Chemistry and Physics Discussions
This discussion paper is/has been under review for the journal Atmospheric Chemistry and Physics (ACP). Please refer to the corresponding final paper in ACP if available.
Impact of very short-lived halogens on
stratospheric ozone abundance and UV
radiation in a geo-engineered atmosphere
S. Tilmes1, D. E. Kinnison1, R. R. Garcia1, R. Salawitch2, T. Canty2,
J. Lee-Taylor1, S. Madronich1, and K. Chance3
1
National Center for Atmospheric Research, Boulder, CO, USA
2
University of Maryland College Park, MD, USA
3
Harvard-Smithsonian Center for Astrophysics, Cambridge, MA, USA
Received: 28 July 2012 – Accepted: 16 August 2012 – Published: 27 August 2012
Correspondence to: S. Tilmes (tilmes@ucar.edu)
ACPD
12, 21923–21945, 2012Impact of VSL halogens on ozone
and UV radiation
S. Tilmes et al.
Title Page
Abstract Introduction
Conclusions References
Tables Figures
◭ ◮
◭ ◮
Back Close
Full Screen / Esc
Printer-friendly Version
Interactive Discussion
Discussion
P
a
per
|
Dis
cussion
P
a
per
|
Discussion
P
a
per
|
Discussio
n
P
a
per
|
Abstract
The impact of very short-lived (VSL) halogenated source species on the ozone layer and surface erythemal ultraviolet radiation (UVERY) is investigated in the context of geo-engineering of climate by stratospheric sulfur injection. For a projected 2040 model atmosphere, consideration of VSL halogens at their upper limit results in lower ozone
5
columns and higher UVERYdue to geo-engineering for nearly all seasons and latitudes, with UVERYrising by 12 % and 6 % in southern and northern high latitudes, respectively. When VSL halogen sources are neglected, future UVERY increases due to declines in ozone column are nearly balanced by reductions of UVERY due to scattering by the higher stratospheric aerosol burden in mid-latitudes. Consideration of VSL sources at
10
their upper limit tips the balance, resulting in annual average increases in UVERY of up to 5 % in mid and high latitudes. Therefore, VSL halogens should be considered in models that assess the impact of stratospheric sulfur injections on the ozone layer.
1 Introduction
A widely discussed geo-engineering approach considers the continuous injection of
15
sulfuric acid particles into the tropical stratosphere, which results in an enhancement of the global sulfate aerosol layer in the stratosphere (e.g. Crutzen, 2006; Wigley, 2006; Rasch et al., 2008a,b; Tilmes et al., 2009). The resulting reduction of short-wave ra-diation due to geo-engineering is expected to lower global temperatures, as observed after major volcanic eruptions (Solomon et al., 2007).
20
Observations obtained following the eruption of Mt. Pinatubo in June 1991 provide a basis for evaluating the environmental effects of stratospheric sul-fur injection. Global cooling of about 0.5 K occurred after this eruption (Soden et al., 2002; Solomon et al., 2007), along with changes in precipitation patterns (Trenberth and Dai, 2007). In addition, a significant decrease of total column
25
ACPD
12, 21923–21945, 2012Impact of VSL halogens on ozone
and UV radiation
S. Tilmes et al.
Title Page
Abstract Introduction
Conclusions References
Tables Figures
◭ ◮
◭ ◮
Back Close
Full Screen / Esc
Printer-friendly Version
Interactive Discussion
Discussion
P
a
per
|
Dis
cussion
P
a
per
|
Discussion
P
a
per
|
Discussio
n
P
a
per
|
(Fahey et al., 1993; Solomon et al., 1996; Portmann et al., 1996; Tabazadeh et al., 2002). Increased ozone depletion is caused by faster rates of heterogeneous (surface me-diated) chemical reactions on stratospheric liquid sulfate aerosols, supplied by the volcanic eruption. These reactions suppress the concentration of nitrogen oxides (NOx) and enhance the abundance of chlorine monoxide (ClO) and hydroperoxyl
5
(HO2) (Fahey et al., 1993; Wennberg et al., 1994; Solomon et al., 1996).
The stabilization of surface temperatures by geo-engineering would require a contin-uous injection of sulfur into the stratosphere to maintain a volcanic-like aerosol layer. Such a permanent stratospheric aerosol layer could bring about numerous other po-tential effects, such as a shift in the Asian and African monsoons (e.g. Robock et al.,
10
2008). Our focus is on the quantification of the perturbation to the ozone layer and the amount of ultraviolet (UV) radiation reaching the surface in response to stratospheric sulfur injections.
Prior studies have shown that a persistent stratospheric aerosol layer can have a positive or negative impact on the abundance of ozone, depending on altitude,
lati-15
tude, time of the year, and the amount of halogens in the stratosphere. In the polar re-gion during spring (austral spring for the Southern Hemisphere, SH), ozone loss rates are projected to increase significantly due to geo-engineering, as a result of increased efficiency of ozone loss by halogen cycles. A delay in the recovery of the Antarctic ozone hole of 40 to 70 yr due to geo-engineering was estimated, as well as a
signifi-20
cant increase in the amount of ozone depletion at high northern latitudes through the end the 21st century, compared to background stratospheric aerosol conditions (Tilmes et al., 2008). For mid-latitudes, a decrease in the efficiency of ozone loss by the NOx cycle at around 25 km altitude results in an increase of ozone, whereas increased ClOx and HOxin the lower stratosphere reduce ozone (Tilmes et al., 2009; Heckendorn et al.,
25
2009). The net effect of geo-engineering on column ozone was estimated to range be-tween−5 % (Heckendorn et al., 2009) and+3 % (Tilmes et al., 2009) for low latitudes.
ACPD
12, 21923–21945, 2012Impact of VSL halogens on ozone
and UV radiation
S. Tilmes et al.
Title Page
Abstract Introduction
Conclusions References
Tables Figures
◭ ◮
◭ ◮
Back Close
Full Screen / Esc
Printer-friendly Version
Interactive Discussion
Discussion
P
a
per
|
Dis
cussion
P
a
per
|
Discussion
P
a
per
|
Discussio
n
P
a
per
|
high latitudes. Dynamical changes also influence the response of stratospheric ozone to geo-engineering (e.g. Stenchikov et al., 2002; Tilmes et al., 2009).
With the decline of stratospheric halogens (chlorine and bromine) driven by contin-ued adherence to the Montreal Protocol, the ozone layer is expected to recover by the end of the century. Column ozone values are expected to exceed pre-1980 values,
5
due to the increase in the strength of the Brewer-Dobson circulation driven by rising levels of greenhouse gases (Oman et al., 2010; Eyring et al., 2010). The impact of geo-engineering on ozone by mid-century is thought to be moderate, because halogen levels will be lower and column ozone may rise due to this circulation change. However, prior model studies that investigated the sensitivity of ozone to sulfate geo-engineering
10
only considered the supply of stratospheric halogens from the decomposition of long-lived organic source gases (Tilmes et al., 2009; Heckendorn et al., 2009). The addi-tional supply from very short-lived (VSL) bromocarbons – with largest contributions from dibromomethane (CH2Br2) and bromoform (CHBr3) (Chapter 2 of WMO, 2003) – has been suggested to have a significant impact in a volcanic-like stratospheric aerosol
15
layer (Salawitch et al., 2005).
Most models underestimate the amount of ozone depletion observed following the eruption of Mt. Pinatubo. Salawitch et al. (2005) showed this discrepancy could be re-solved if stratospheric halogens from the decomposition of VSL bromocarbons were considered. Levels of bromine monoxide (BrO) are enhanced in the lower stratosphere
20
at all times compared to a model that neglects VSL bromocarbons. During periods of enhanced volcanic aerosol loading, ClO in the lower stratosphere is highly enhanced; this ClO then reacts with BrO from VSL sources, providing an efficient means for re-moval of stratospheric ozone (Salawitch et al., 2005). The consideration of VSL halo-gens is therefore expected to be important for geo-engineering studies given the large
25
enhancement to the sulfate aerosol layer that would occur.
ACPD
12, 21923–21945, 2012Impact of VSL halogens on ozone
and UV radiation
S. Tilmes et al.
Title Page
Abstract Introduction
Conclusions References
Tables Figures
◭ ◮
◭ ◮
Back Close
Full Screen / Esc
Printer-friendly Version
Interactive Discussion
Discussion
P
a
per
|
Dis
cussion
P
a
per
|
Discussion
P
a
per
|
Discussio
n
P
a
per
|
geo-engineering could potentially be applied. Furthermore, the role of VSL halogen species is expected to gain importance in the coming years, as stratospheric Bry and Clyfrom long-lived sources decline due to the Montreal Protocol. Year 2040 represents a period when anthropogenic Bry and Cly are in decline, but have not yet reached background levels (Fig. 5–3, Eyring et al., 2010). Finally, changes in column ozone and
5
aerosol are related to surface UV radiation, which has implications for human health and the well-being of the entire ecosystem. In Sect. 2, we describe the experimental design of the simulations used. Section 3 discusses changes in ozone abundances due to geo-engineering. In Sect. 4, we investigate changes in UV radiation resulting from geo-engineering under fixed dynamical conditions, using a radiative transfer model.
10
2 Experiemental design
The Whole Atmosphere Community Climate Model (WACCM) Version 3548 (Garcia et al., 2007) is used to investigate the impact of geo-engineering on ozone. The per-formance of WACCM has been evaluated within the CCMVal-2 framework, showing reasonably good agreement with observations important for model representation of
15
transport, photochemistry, UTLS processes, and polar ozone loss (Eyring et al., 2010). To investigate the chemical response of varying halogen levels in the stratosphere, the same meteorological fields are prescribed in several one-year simulations. Therefore, the impact of dynamical differences between geo-engineering and baseline simulations (as discussed in Tilmes et al., 2009), or the effect of dynamical feedbacks induced by
20
VSL halogens, is not quantified.
We select meteorological conditions and surface area densities (SAD) of sulfuric acid aerosols of one year (year 2040) from a geo-engineering simulation performed for the period 2020–2050 by Tilmes et al. (2009). In that study, a fixed amount of injected SO2 was considered. The sulfate distribution was taken from Rasch et al. (2008b),
25
who considered an injection of 2 Tg S yr−1 of volcanic-sized aerosols into the tropics.
ACPD
12, 21923–21945, 2012Impact of VSL halogens on ozone
and UV radiation
S. Tilmes et al.
Title Page
Abstract Introduction
Conclusions References
Tables Figures
◭ ◮
◭ ◮
Back Close
Full Screen / Esc
Printer-friendly Version
Interactive Discussion
Discussion
P
a
per
|
Dis
cussion
P
a
per
|
Discussion
P
a
per
|
Discussio
n
P
a
per
|
conditions of a recently observed moderately cold Arctic polar vortex between Jan-uary and March, considering the averaged potential for activated chlorine (PACl), as introduced by Tilmes et al. (2007). However, the Arctic polar vortex persists too long into April compared to recently observed conditions. A larger PACl in comparison to observations might result in an overestimation of chemical ozone loss in the Arctic
po-5
lar vortex in April in northern high latitudes (see Supplement and Fig. S1 for further details).
The prescribed temperatures over Antarctica are slightly lower than recently ob-served and stay cooler into December compared to observations. Therefore, we also expect an overestimation of ozone loss in November and December compared to
ob-10
served Antarctic conditions in recent years. These conditions might be reasonable for the geo-engineering simulations, assuming a potentially stronger and colder polar vor-tex (Tilmes et al., 2009). A potential overestimation of chemical ozone loss in northern and southern high latitudes in late spring is expected to have little impact on chemi-cal changes in low and mid- latitudes due to geo-engineering and VSL species in this
15
study.
We show results for chemical conditions of the stratosphere representative of years 2000 and 2040 following the CCMVal-2 definition (Eyring et al., 2006), including various assumptions regarding the amount of stratospheric Bry and Cly from VSL source gas species (BrVSLy and Cl
VSL
y ). The year 2000 simulation is used to represent the
contem-20
porary atmosphere, for comparison to satellite observations of BrO. The 2040 simula-tion is used to assess the impact of geo-engineering on ozone and surface UV. Simula-tions are performed for three scenarios that differ in the amount of BrVSLy and Cl
VSL y . In the first case, denoted VSL=0, bromine and chlorine enter the stratosphere only from long-lived halocarbons. This is the common condition for most model simulations within
25
ACPD
12, 21923–21945, 2012Impact of VSL halogens on ozone
and UV radiation
S. Tilmes et al.
Title Page
Abstract Introduction
Conclusions References
Tables Figures
◭ ◮
◭ ◮
Back Close
Full Screen / Esc
Printer-friendly Version
Interactive Discussion
Discussion
P
a
per
|
Dis
cussion
P
a
per
|
Discussion
P
a
per
|
Discussio
n
P
a
per
|
as VSL=10+100. The last case is meant to describe the upper limit of stratospheric halogen abundance from VSL sources. For all these cases, both baseline simulations (background SAD) and geo-engineering simulations (enhanced SAD) were performed. A detailed justification for the three different cases is based on previous literature and is discussed in the Supplement.
5
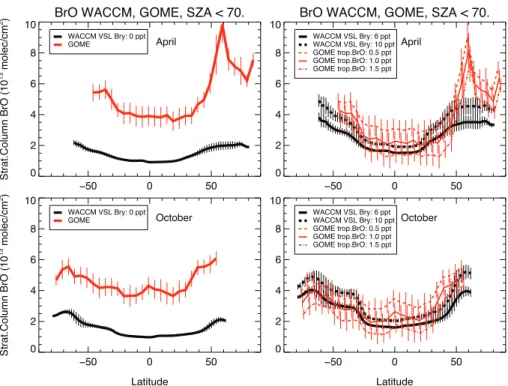
We further justify the use of values of 6 and 10 ppt for BrVSLy by comparing WACCM BrO for chemical conditions in year 2000 to GOME total column BrO measured in April and October 1997 (Chance, 1998), as shown in Fig. 1. The left hand side of this figure compares total column BrO from GOME to stratospheric column BrO from WACCM. The difference between GOME and WACCM BrO shown in these panels is much larger
10
than the change in Bry from 1997 to 2000 due to halogen sources (e.g. Eyring et al., 2010, Figs. 1–21).
The right hand panels of Fig. 1 illustrate the sensitivity of the comparison to tropo-spheric BrO and stratotropo-spheric BrVSLy , neither of which is particularly well known. GOME BrO has been adjusted to represent only the amount of BrO present in the stratosphere,
15
as a function of the assumed tropospheric BrO burden (red lines). This adjustment, de-scribed by Salawitch et al. (2005), is also outlined in the Supplement. The black lines show WACCM stratospheric column BrO assuming different values for BrVSLy .
The best agreement between WACCM BrO and adjusted GOME BrO is found as-suming a tropospheric BrO abundance of 1 ppt and BrVSLy between 6 to 10 ppt (Fig. 1,
20
right panels). The very high levels of BrO observed by GOME at high latitudes during April 1997 are due to the spring-time Arctic bromine explosion, as described by Chance (1998). We make no attempt to model high tropospheric BrO associated with this event because the surface release of BrO has no bearing on our geo-engineering study. All latitudes for April are shown in Fig. 1 for completeness. However, the justification of 6
25
ACPD
12, 21923–21945, 2012Impact of VSL halogens on ozone
and UV radiation
S. Tilmes et al.
Title Page
Abstract Introduction
Conclusions References
Tables Figures
◭ ◮
◭ ◮
Back Close
Full Screen / Esc
Printer-friendly Version
Interactive Discussion
Discussion
P
a
per
|
Dis
cussion
P
a
per
|
Discussion
P
a
per
|
Discussio
n
P
a
per
|
3 Changes in ozone abundance
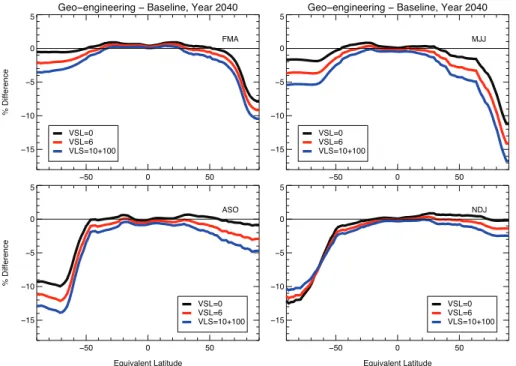
The effect of geo-engineering on ozone, derived using the WACCM runs described above, is shown in Fig. 2, and Table 1. Figure 2 shows the relative difference between model ozone in year 2040 for two runs of WACCM, one with enhanced stratospheric sulfur and another with background levels of stratospheric sulfur. Numerical values of
5
absolute and relative differences are given in Table S1. Negative values indicate reduc-tions of column ozone due to geo-engineering. Results are shown in Fig. 2 as a func-tion of equivalent latitude (defined to follow isopleths of constant potential vorticity, PV), which allows various dynamical regimes to be readily apparent.
For the VSL=0 simulation, geo-engineering causes column ozone in the polar
vor-10
tex (60 to 90◦ equivalent latitudes) for year 2040 to decrease by 8 % for the Northern Hemisphere (NH) on average for the three months February, March, and April (FMA) and 10.5 % for the SH averaging August, September, and October (ASO). These de-pletions rise to 10 % and 13.5 % for the BrVSLy = 10 ppt, Cl
VSL
y = 100 ppt case. The influence of geo-engineering on NH polar ozone reported here is larger in all cases
15
than that discussed by Tilmes et al. (2009). In contrast to earlier studies, where vortex temperatures between 2020–2050 are on average biased high in the NH, we simulate conditions for a longer-lasting moderately cold Arctic polar vortex. In high latitudes in Southern Hemisphere (SH) summer (November, December, and January: NDJ), the relative difference in ozone between geo-engineering and baseline simulation for the
20
VSL=10+100 case is smaller than the difference for the VSL=0 case. The additional halogen loading for the VSL=10 +100 geo-engineering case causes ozone loss to reach very small values in the lower stratosphere in the long-lasting Antarctic vortex in November and December and additional ozone depletion due to increased aerosols is limited, which is not the case for the VSL=0 and VSL=6 simulations.
25
ACPD
12, 21923–21945, 2012Impact of VSL halogens on ozone
and UV radiation
S. Tilmes et al.
Title Page
Abstract Introduction
Conclusions References
Tables Figures
◭ ◮
◭ ◮
Back Close
Full Screen / Esc
Printer-friendly Version
Interactive Discussion
Discussion
P
a
per
|
Dis
cussion
P
a
per
|
Discussion
P
a
per
|
Discussio
n
P
a
per
|
are considered, geo-engineering is found to decrease column ozone at almost all lat-itudes and for nearly all seasons. For instance, a 0.65 % increase in column ozone is computed for 30 to 60◦N during ASO in year 2040 if VSL
= 0; the BrVSLy = 10 ppt and ClVSLy = 100 ppt case leads to a 1.5 % decrease in column ozone for this time and location. Further, in northern mid-latitudes in summer (May, June, and July: MJJ),
5
the decrease of column ozone due to geo-engineering is doubled (from approximately 1.5 % to 4 %) for BrVSLy =10 ppt and ClVSLy =100 ppt in comparison to VSL=0.
With increasing levels of stratospheric BrVSLy , BrOx and ClOx ozone loss rates gain more importance in mid- and high latitudes (see Supplement and Fig. S2 for further de-tails). The increase of ozone loss rates is especially apparent in the lower stratosphere
10
in high polar latitudes in spring, where the BrOx+ClOx ozone loss cycle dominates. BrOx+ClOx loss rates double if geo-engineering aerosols are considered. Additional stratospheric BrVSLy of 10 ppt and ClVSLy of 100 ppt result in about 3 times larger ozone loss rates compared to a baseline simulation between 10 and 15 km. An appreciable impact of enhanced Bry is also found in mid-latitudes in summer, a time when the
15
ozone column is smallest. Enhanced heterogeneous reactions amplify the HOx, BrOx and ClOx cycles in the lower stratosphere whereas NOx ozone rates stay constant for different VSL cases. The most important cycle in summer mid- and high latitudes is the HOxcycle. The influence of geo-engineering on HOxozone loss rates increases by about 75 % if BrVSLy is assumed to be 6 ppt or larger compared to VSL=0 at around
20
12 km in northern high latitudes.
4 Changes in UV radiation
Decreasing column ozone as a result of enhanced stratospheric sulfate aerosols in-creases the amount of UV radiation reaching Earth’s surface (e.g. Micheletti et al., 2003), which can harm human health by leading to skin cancer and eye damage.
In-25
ACPD
12, 21923–21945, 2012Impact of VSL halogens on ozone
and UV radiation
S. Tilmes et al.
Title Page
Abstract Introduction
Conclusions References
Tables Figures
◭ ◮
◭ ◮
Back Close
Full Screen / Esc
Printer-friendly Version
Interactive Discussion
Discussion
P
a
per
|
Dis
cussion
P
a
per
|
Discussion
P
a
per
|
Discussio
n
P
a
per
|
other hand, increased scattering by stratospheric sulfate aerosols can alter the radia-tion path lengths, increasing the diffuse-to-direct ratio of surface UV (Zeng et al., 1994). A large burden of sulfate aerosols due to geo-engineering, everything else being equal, can reduce the amount of incoming UV radiation due to enhanced scattering. A de-crease in the production of tropospheric O(1D) by O3photolysis, due to attenuation of
5
actinic flux in the 290–330 nm wavelength region by stratospheric aerosol, led to a drop in modeled OH and an observed increase of CH4and CO within 6 months after the Mt. Pinatubo volcanic eruption (Dlugokencky et al., 1996). A rise of the diffuse-to-direct ratio of surface UV following Pinatubo may have increased canopy photosynthesis and the land carbon sink (Mercado et al., 2009).
10
The radiative transfer model TUV (Tropospheric Ultraviolet and Visible) (Madronich and Flocke, 1997) is used to calculate surface UV radiation for all the simulations de-scribed above. The model calculates spectral irradiances from the simulated column ozone values over full diurnal cycles for each day of the year to capture the influence of changing solar zenith angle. Model irradiance is converted to monthly means,
follow-15
ing the method of Lee-Taylor et al. (2010). Irradiance is then multiplied by the human erythema (skin-reddening) spectrum (McKinlay and Diffey, 1987) (also used for the cal-culation of the UV index). The weighted spectrum, termed UVERY, has units of kJ m−
2
day−1.
In Fig. 3, we illustrate the difference of annual averaged UVERY resulting only from
20
changes of column ozone due to geo-engineering for different levels of BrVSLy and Cl VSL y . Seasonal and local changes in UVERYare much larger, for instance in spring at the lo-cation of the polar vortex. Any effects of changing cloudiness are not considered, as the response of cloudiness to geo-engineering cannot be forecast reliably. The impact on UVERY, due to scattering by stratospheric sulfate aerosols is discussed further below.
25
ACPD
12, 21923–21945, 2012Impact of VSL halogens on ozone
and UV radiation
S. Tilmes et al.
Title Page
Abstract Introduction
Conclusions References
Tables Figures
◭ ◮
◭ ◮
Back Close
Full Screen / Esc
Printer-friendly Version
Interactive Discussion
Discussion
P
a
per
|
Dis
cussion
P
a
per
|
Discussion
P
a
per
|
Discussio
n
P
a
per
|
hand, UVERY increases towards the poles by up to 7 % in northern high latitudes and by more than 10 % for southern high latitudes. For the BrVSLy =6 ppt simulation (Fig. 3, middle), UVERY increases by up to 4 % between 45 and 60◦N for 2040 compared to the baseline simulation. Further, reduced column ozone in the tropics assuming BrVSLy
=10 ppt, ClVSLy =100 ppt changes the sign of UVERYfrom a slight decrease of≈0–2 %
5
for VSL=0 to an increase of≈0–2 % (Fig. 3, bottom). For the VSL=10+100 case,
we further find a significant increase of UVERY in mid- and high latitudes reaching up to 6 % and over 12 %, respectively, compared to the baseline simulation.
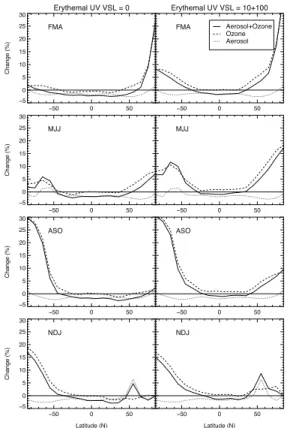
We now quantify the impact of increased scattering by stratospheric sulfate aerosols on UVERY(see Fig. 4). An increase in optical depth increases the radiation path lengths
10
and therefore the diffuse-to-direct ratio of surface UV. The aerosol optical depth for baseline and geo-engineering simulations is calculated directly from the SAD of the different model simulations, using the TUV model. We use an extinction efficiency of
∼1.9 calculated from Mie scattering over 300 to 320 nm assuming an effective radius of 0.43 microns (consistent with what was assumed in Rasch et al. (2008b)). Depending
15
on season and latitude, UV changes due to geo-engineering are reduced by a max-imum of 2–3 % (Fig. 4, dotted lines). At high latitudes for seasons when solar zenith angle is large, increased scattering results in a slight increase in UVERY.
The combined effect on UVERY due to changes in column ozone and aerosol scat-tering induced by geo-engineering is shown by the solid lines in Fig. 4. The left panel
20
shows results for the BrVSLy =0 case and the right panel for the Br VSL
y =10 ppt, Cl VSL y
= 100 ppt simulation. For low latitudes changes in UVERY are negative for all cases considered. The most obvious difference between VSL = 0 and VSL = 10 + 100 is found for spring and fall in mid- and high latitudes. For example, for ASO in north-ern mid-latitudes and for FMA in southnorth-ern mid-latitudes, the impact of geo-engineering
25
ACPD
12, 21923–21945, 2012Impact of VSL halogens on ozone
and UV radiation
S. Tilmes et al.
Title Page
Abstract Introduction
Conclusions References
Tables Figures
◭ ◮
◭ ◮
Back Close
Full Screen / Esc
Printer-friendly Version
Interactive Discussion
Discussion
P
a
per
|
Dis
cussion
P
a
per
|
Discussion
P
a
per
|
Discussio
n
P
a
per
|
For comparison, the decline in TOMS ozone column data between the decades 1979–1989 and 1990–2000 resulted in an increase of 2 to 7 % for UVERY between 30 and 60◦N and an increase of more than 10 % in southern high latitudes for clear sky conditions (Lee-Taylor and Madronich, 2007; McPeters et al., 1996; Herman, 2010). These changes were caused by the increase of CFCs in the stratosphere. When VSL
5
halogens are consider in the model, geo-engineering might lead to a similar impact on column ozone and thus UVERYin 2040.
5 Conclusions
Prior studies have shown that enhanced sulfate aerosols in the stratosphere from geo-engineering will result in a significant decrease of column ozone for present day
(Heck-10
endorn et al., 2009) and future conditions (Tilmes et al., 2008, 2009). Previous model studies only considered long-lived halogen sources. We show that the consideration of VSL halogen source species, in a geo-engineering calculation focused on the year 2040, leads to larger decreases in column ozone for nearly all seasons, at nearly all latitudes. The largest relative impact of VSL halogen sources is found for northern
mid-15
and high latitudes in summer, where the additional Bryand Clyfrom VSL sources leads to column ozone decreases of up to 4 % compared to a geo-engineering simulation that neglects VSL halogens.
Changes in column ozone and stratospheric aerosol content due to geo-engineering will impact erythemal UV radiation reaching the surface (UVERY). A calculation
con-20
sidering the upper limit of additional Bry and Cly from VSL source species, and only the effect of ozone on UVERY, results in a 12 % annual increase in UVERY in the SH high latitudes and up to 6 % in NH high latitudes due to geo-engineering. Considering the impact of scattering from geo-engineering aerosols we find a reduction of UVERY by about 2 to 3 % for most latitudes and seasons. Considering the combinded effects
25
ACPD
12, 21923–21945, 2012Impact of VSL halogens on ozone
and UV radiation
S. Tilmes et al.
Title Page
Abstract Introduction
Conclusions References
Tables Figures
◭ ◮
◭ ◮
Back Close
Full Screen / Esc
Printer-friendly Version
Interactive Discussion
Discussion
P
a
per
|
Dis
cussion
P
a
per
|
Discussion
P
a
per
|
Discussio
n
P
a
per
|
on UVERY switches from neutral (a balance between the increase due to ozone de-pletion and a decrease due to aerosol scattering) to a rise of≈5 %. In this case, the
UVERY increase due to ozone depletion driven by VSL halogens exceeds UVERY de-crease due to aerosol scattering. Upon consideration of VSL halogens, we find that geo-engineering due to sulfate injection could result, for year 2040, in an increase of
5
UVERYcomparable to levels observed during the 1979 to 2000 time period, due to peak levels of CFCs and other ozone depleting substances.
We have investigated one specific meteorological situation for all simulations, which aids the interpretation of the model output, but also means interannual temperature variations are not considered. Such variations can lead to large differences of chemical
10
ozone loss in winter and spring at northern high latitudes. The impact of VSL halo-gens would be smaller for a warmer Arctic winter than considered here and larger for colder winters. Further, the long-lasting SH polar vortex in our simulation likely results in an overestimation of the annual column ozone reduction in southern high latitudes. For the other latitudes, however, precise temperature is likely to be less important. We
15
have also not considered changes in stratospheric dynamics induced by the VSL halo-gen driven loss of ozone, which could be important and should be quantified in future studies.
Simplified assumptions were also made regarding the location and size distribution of the geo-engineered stratospheric aerosol layer. Large uncertainties exist on these
20
matters, which strongly depend on the emission strategy and composition of the in-jected particles (Heckendorn et al., 2009; Pierce et al., 2010; Niemeier et al., 2011). Smaller particles enhance the rate of heterogeneous reactions and therefore amplify ozone-destroying cycles. Larger particles experience faster gravitational settling and may result in a heating of the tropical tropopause, driving strong reduction of column
25
ACPD
12, 21923–21945, 2012Impact of VSL halogens on ozone
and UV radiation
S. Tilmes et al.
Title Page
Abstract Introduction
Conclusions References
Tables Figures
◭ ◮
◭ ◮
Back Close
Full Screen / Esc
Printer-friendly Version
Interactive Discussion
Discussion
P
a
per
|
Dis
cussion
P
a
per
|
Discussion
P
a
per
|
Discussio
n
P
a
per
|
In summary, this study reveals the importance of considering BrVSLy when quantifying the impact of geo-engineering on ozone and surface UV, which is one example that stresses the need for a deeper understanding of atmospheric processes, should geo-engineeing be considered to counteract climate change.
Supplementary material related to this article is available online at:
5
http://www.atmos-chem-phys-discuss.net/12/21923/2012/ acpd-12-21923-2012-supplement.pdf.
Acknowledgements. We thank the GOME satellite team for providing high quality data of BrO. MERRA data used in this study have been provided by the Global Modeling and Assimilation
Office (GMAO) at NASA Goddard Space Flight Center through the NASA GES DISC online
10
archive. The National Center for Atmospheric Research is funded by the National Science Foundation. Work at UMd was supported by the NASA ACMAP and Aura programs.
References
Chance, K.: Analysis of BrO measurements from the Global Ozone Monitoring Experiment, Geophys. Res. Lett., 25, 3335–3338, doi:10.1029/98GL52359, 1998. 21929, 21942
15
Crutzen, P. J.: Albedo enhancements by stratospheric sulfur injections: a contribution to resolve a policy dilemma? An Editorial Essay, Clim. Change, 77, 211–219, 2006. 21924
Dlugokencky, E. J., Duttoni, E. G., Novelli, P. C., Tans, P. P., Masarie, K. A., Lantz, K. O., and
Madronich, S.: Changes in CH4and CO growth rates after the eruption of Mt. Pinatubo and
their link with changes in tropical tropospheric UV flux, Geophys. Res. Lett., 23, 2761–2764,
20
doi:10.1029/96GL02638, 1996. 21932
Eyring, V., Butchart, N., Waugh, D. W., Akiyoshi, H., Austin, J., Bekki, S., Bodeker, G. E., Boville, B. A., Br ¨uhl, C., Chipperfield, M. P., Cordero, E., Dameris, M., Deushi, M., Fi-oletov, V. E., Frith, S. M., Garcia, R. R., Gettelman, A., Giorgetta, M. A., Grewe, V., Jourdain, L., Kinnison, D. E., Mancini, E., Manzini, E., Marchand, M., Marsh, D. R.,
Na-25
ACPD
12, 21923–21945, 2012Impact of VSL halogens on ozone
and UV radiation
S. Tilmes et al.
Title Page
Abstract Introduction
Conclusions References
Tables Figures
◭ ◮
◭ ◮
Back Close
Full Screen / Esc
Printer-friendly Version
Interactive Discussion
Discussion
P
a
per
|
Dis
cussion
P
a
per
|
Discussion
P
a
per
|
Discussio
n
P
a
per
|
Schraner, M., Shepherd, T. G., Shibata, K., Stolarski, R. S., Struthers, H., Tian, W., and Yoshiki, M.: Assessment of temperature, trace species and ozone in chemistry-climate sim-ulations of the recent past, J. Geophys. Res., 111, D22308, doi:10.1029/2006JD007327, 2006. 21928
Eyring, V., Shepherd, T. . G., and Waugh, D. W. (eds.): SPARC Report on the Evaluation of
5
Chemistry-Climate Models, SPARC Report No. 5, WCRP-132, WMO/TD-No.1526, 2010. 21926, 21927, 21928, 21929
Fahey, D. W., Kawa, S. R., Woodbridge, E. L., Tin, P., Wilson, J. C., Jonsson, H. H., Dye, J. E., Baumgardner, D., Borrmann, S., and Toohey, D. W.: In situ measurements constraining the role of sulphate aerosols in mid-latitude ozone depletion, Nature, 363, 509–514, 1993. 21925
10
Garcia, R. R., Marsh, D. R., Kinnison, D. E., Boville, B. A., and Sassi, F.: Simulation of secular trends in the middle atmosphere, 1950–2003, J. Geophys. Res., 112, D09301, doi:10.1029/2006JD007485, 2007. 21927
Heckendorn, P., Weisenstein, D., Fueglistaler, S., Luo, B., Rozanov, E., Schraner, M., Thoma-son, L., and Peter, T.: The impact of geoengineering aerosols on stratospheric temperature
15
and ozone, Environ. Res. Lett., 4, 045108, doi:10.1088/1748-9326/4/4/045108, 2009. 21925, 21926, 21934, 21935
Herman, J. R.: Global increase in UV irradiance during the past 30 years (1979–2008) es-timated from satellite data, J. Geophys. Res., 115, D04203, doi:10.1029/2009JD012219, 2010. 21934
20
Lee-Taylor, J. and Madronich, S.: Climatology of UV-A, UV-B, and Erythemal Radiation at the Earth’s Surface, 1979–2000, NCAR Technical Note TN-474-STR, 2007. 21934
Lee-Taylor, J., Madronich, S., Mayer, B., and Fischer, C.: A Climatology of UV Radiation, 1979– 2000, 65S–65N, in: UV Radiation in Global Climate Change: Measurements, Modeling and
Effects on Ecosystems, edited by: Gao, W., Schmoldt, D., and Slusser, J., Springer-Verlag,
25
Heidelberg, and Tsinghua University Press, Beijing, 1–20, 2010. 21932
Madronich, S. and Flocke, S.: Theoretical estimation of biologically effective UV radiation at the
Earth’s surface, in: Solar Ultraviolet Radiation – Modeling, Measurements and Effects, edited
by: Zerefos, vol. 152, NATO ASI Series, Springer-Verlag, Berlin, 1997. 21932
McKinlay, A. F. and Diffey, B. L.: A reference action spectrum for ultraviolet induced erythema
30
ACPD
12, 21923–21945, 2012Impact of VSL halogens on ozone
and UV radiation
S. Tilmes et al.
Title Page
Abstract Introduction
Conclusions References
Tables Figures
◭ ◮
◭ ◮
Back Close
Full Screen / Esc
Printer-friendly Version
Interactive Discussion
Discussion
P
a
per
|
Dis
cussion
P
a
per
|
Discussion
P
a
per
|
Discussio
n
P
a
per
|
McPeters, R. D., Hollandsworth, S. M., Flynn, L. E., Herman, J. R., and Seftor, C. J.: Long-term ozone trends derived from 16-year combined Nimbus 7/Meteor 3 TOMS Version 7 record, Geophys. Res. Lett., 23, 3699–3702, doi:10.1029/96GL03540, 1996. 21934
Mercado, L. M., Bellouin, N., Sitch, S., Boucher, O., Huntingford, C., Wild, M., and Cox, P. M.:
Impact of changes in diffuse radiation on the global land carbon sink, Nature, 458,
5
doi:10.1038/nature07949, 2009. 21932
Micheletti, M. I., Piacentini, R. D., and Madronich, S.: Sensitivity of biologically active UV
radia-tion to stratospheric ozone changes: effects of action spectrum shape and wavelength range,
Photochem. Photobiol., 78, 456–461, 2003. 21931
Niemeier, U., Schmidt, H., and Timmreck, C.: The dependency of geoengineered sulfate
10
aerosol on the emission strategy, Atmos. Sci. Lett., 12, 189–194, doi:10.1002/asl.304, 2011. 21935
Oman, L., Plummer, D. A., Waugh, D. W., Austin, J., Scinocca, J. F., Douglass, A. R., Salaw-itch, R. J., Canty, T., Akiyoshi, H., Bekki, S., Braesicke, P., Butchart, N., Chipperfield, M. P., Cugnet, D., Dhomse, S., Eyring, V., Frith, S., Hardiman, S. C., Kinnison, D. E., Lamarque,
15
J.-F., Mancini, E., Marchand, M., Michou, M., Morgenstern, O., Nakamura, T., Nielsen, J. E., Olivi ´e, D.,. Pitari, G, Pyle, J., Rozanov, E., Shepherd, T. G., Shibata, K., Stolarski, R. S., Teyssedre, H., Tian, W., Yamashita, Y., and Ziemke, J. R.: Multimodel assessment of the factors driving stratospheric ozone evolution over the 21st century, J. Geophys. Res., 115, D24306, doi:10.1029/2010JD014362, 2010. 21926
20
Pierce, J., Weisenstein, D., and Keith, D.: Efficient formation of stratospheric aerosol for
geo-engineering through emission of lowvolatility vapours in an aircraft plume, Geophys. Res. Abstr., 12, 2010. 21935
Portmann, R. W., Solomon, S., Garcia, R. R., Thomason, L. W., Poole, L. R., and Mc-Cormick, M. P.: Role of aerosol variations in anthropogenic ozone depletion in the polar
25
regions, J. Geophys. Res., 101, 22991–23006, 1996. 21925
Rasch, P. J., Tilmes, S., Turco, R. P., Robock, A., Oman, L., and Chen, C.-C.: An overview of geoengineering of climate using stratospheric sulphate aerosols, Proc. R. Soc. London A, 366, doi:10.1098/rsta.2008.0131, 2008a. 21924
Rasch, R. J., Crutzen P. J., Coleman, D. B., and Coleman, D. B.: Exploring the geoengineering
30
ACPD
12, 21923–21945, 2012Impact of VSL halogens on ozone
and UV radiation
S. Tilmes et al.
Title Page
Abstract Introduction
Conclusions References
Tables Figures
◭ ◮
◭ ◮
Back Close
Full Screen / Esc
Printer-friendly Version
Interactive Discussion
Discussion
P
a
per
|
Dis
cussion
P
a
per
|
Discussion
P
a
per
|
Discussio
n
P
a
per
|
Robock, A., Oman, L., and Stenchikov, G.: Regional climate response to geoengineering with
tropical and Arctic SO2injection, J. Geophys. Res., 113, doi:10.1029/2008JD010050, 2008.
21925
Saiz-Lopez, A., Lamarque, J.-F., Kinnison, D. E., Tilmes, S., Ord ´o ˜nez, C., Orlando, J. J., Con-ley, A. J., Plane, J. M. C., Mahajan, A. S., Sousa Santos, G., Atlas, E. L., Blake, D. R.,
5
Sander, S. P., Schauffler, S., Thompson, A. M., and Brasseur, G.: Estimating the climate
significance of halogen-driven ozone loss in the tropical marine troposphere, Atmos. Chem. Phys., 12, 3939–3949, doi:10.5194/acp-12-3939-2012, 2012. 21935
Salawitch, R. J., Weisenstein, D. K., Kovalenko, L. J., Sioris, C. E., Wennberg, P. O., Chance, K., Ko, M. K. W., and McLinden, C. A.: Sensitivity of ozone to bromine in the lower stratosphere,
10
Geophys. Res. Lett., 32, L05811, doi:10.1029/2004GL021504, 2005. 21926, 21929
Soden, B., Wetherald, R., Stenchikov, G., and Robock, A.: Global cooling after the erup-tion of Mount Pinatubo: a test of climate feedback by water vapor, Science, 296, 5568, doi:10.1126/science.296.5568.727, 2002. 21924
Solomon, S., Portmann, R., Garcia, R. R., Thomason, L., Poole, L. R., and McCormick, M. P.:
15
The role of aerosol variations in anthropogenic ozone depletion at northern midlatitudes, J. Geophys. Res., 101, 6713–6727, 1996. 21925
Solomon, S., Qin, D., Manning, M., Marquis, M., Averyt, K., Tignor, M. M. B., Miller, H. L., and Chen, Z. (eds.): Climate Change 2007: The Physical Science Basis. Contribution of Working Group I to the Fourth Assessment Report of the Intergovernmental Panel on Climate
20
Change, Cambridge University Press, Cambridge, UK and New York, NY, USA, 2007. 21924 Stenchikov, G. L., Robock, A., Ramaswamy, V., Schwarzkopf, M. D., Hamilton, K., and
Ra-machandran, S.: Oscillation response to the 1991 Mount Pinatubo eruption: Effects of
vol-canic aerosols and ozone depetion, J. Geophys. Res., 107, doi:10.1029/2002JD002090, 2002. 21926
25
Tabazadeh, A., Drdla, K., Schoeberl, M. R., Hamill, P., and Toon, O. B.: Arctic “ozone hole” in a cold volcanic stratosphere, Proc. Natl. Acad. Sci., 99, 2609–2612, 2002. 21925
Tilmes, S., Kinnison, D., M ¨uller, R., Sassi, F., Marsh, D., Boville, B., and Garcia, R.: Evaluation of heterogeneous processes in the polar lower stratosphere in the Whole Atmosphere Com-munity Climate Model, J. Geophys. Res., 112, D24301, doi:10.1029/2006JD008334, 2007.
30
ACPD
12, 21923–21945, 2012Impact of VSL halogens on ozone
and UV radiation
S. Tilmes et al.
Title Page
Abstract Introduction
Conclusions References
Tables Figures
◭ ◮
◭ ◮
Back Close
Full Screen / Esc
Printer-friendly Version
Interactive Discussion
Discussion
P
a
per
|
Dis
cussion
P
a
per
|
Discussion
P
a
per
|
Discussio
n
P
a
per
|
Tilmes, S., M ¨uller, R., and Salawitch, R. J.: The sensitivity of polar ozone depletion to proposed geoengineering schemes, Science, 320, 1201–1204, doi:10.1126/science.1153966, 2008. 21925, 21934
Tilmes, S., Garcia, R. R., Kinnison, D. E., Gettelman, A., and Rasch, P. J.: Impact of geo-engineered aerosols on the troposphere and stratosphere, J. Geophys. Res., 114, D12305,
5
doi:10.1029/2008JD011420, 2009. 21924, 21925, 21926, 21927, 21928, 21930, 21934
Trenberth, K. E. and Dai, A.: Effects of Mount Pinatubo volcanic eruption on the
hy-drological cycle as an analog of geoengineering, Geophys. Res. Lett., 34, L15702, doi:10.1029/2007GL030524, 2007. 21924
UNEP: United Nations Environment Programme and Environmental Effects Assessment Panel.
10
Environmental effects of ozone depletion and its interactions with climate change: progress
report, 2004, Photochem. Photobiol. Sci., 4, 177–184, doi:10.1039/b418650h, 2005. 21931 Wennberg, P. O., Cohen, R. C., Stimpfle, R. M., Fahey, D. W., Webster, C. R., Salawitch, R. J.,
Proffitt, M. H., Chan, K. R., Anderson, J. G., and Wofsy, S. C.: The removal of lower
strato-spheric ozone by free radical catalysis: In situ measurements of OH, HO2, NO, NO2, ClO,
15
and BrO, Science, 266, 398–404, 1994. 21925
Wigley, T. M.: A combined mitigation/geoengineering approach to climate stabilization, Science, 314, 452–454, 2006. 21924
WMO: Scientific assessment of ozone depletion: 2002, Global Ozone Research and Monitoring Project-Report No. 47, Geneva, Switzerland, 2003. 21926
20
ACPD
12, 21923–21945, 2012Impact of VSL halogens on ozone
and UV radiation
S. Tilmes et al.
Title Page
Abstract Introduction
Conclusions References
Tables Figures
◭ ◮
◭ ◮
Back Close
Full Screen / Esc
Printer-friendly Version
Interactive Discussion
Discussion
P
a
per
|
Dis
cussion
P
a
per
|
Discussion
P
a
per
|
Discussio
n
P
a
per
|
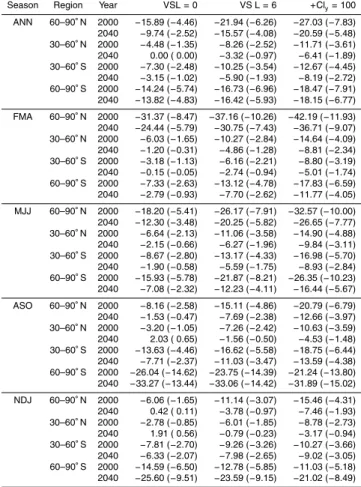
Table 1. Absolute and relative (in brackets) changes of column ozone in DU (%), between geo-engineering and baseline model simulations for varying stratospheric bromine from VSL
species for the year 2000 and 2040, averaged for different latitude bands and for different
seasons.
Season Region Year VSL=0 VS L=6 +Cly=100 ANN 60–90◦N 2000
−15.89 (−4.46) −21.94 (−6.26) −27.03 (−7.83) 2040 −9.74 (−2.52) −15.57 (−4.08) −20.59 (−5.48) 30–60◦N 2000
−4.48 (−1.35) −8.26 (−2.52) −11.71 (−3.61) 2040 0.00 ( 0.00) −3.32 (−0.97) −6.41 (−1.89) 30–60◦S 2000
−7.30 (−2.48) −10.25 (−3.54) −12.67 (−4.45) 2040 −3.15 (−1.02) −5.90 (−1.93) −8.19 (−2.72) 60–90◦S 2000
−14.24 (−5.74) −16.73 (−6.96) −18.47 (−7.91) 2040 −13.82 (−4.83) −16.42 (−5.93) −18.15 (−6.77) FMA 60–90◦N 2000
−31.37 (−8.47) −37.16 (−10.26) −42.19 (−11.93) 2040 −24.44 (−5.79) −30.75 (−7.43) −36.71 (−9.07) 30–60◦N 2000
−6.03 (−1.65) −10.27 (−2.84) −14.64 (−4.09) 2040 −1.20 (−0.31) −4.86 (−1.28) −8.81 (−2.34) 30–60◦S 2000
−3.18 (−1.13) −6.16 (−2.21) −8.80 (−3.19) 2040 −0.15 (−0.05) −2.74 (−0.94) −5.01 (−1.74) 60–90◦S 2000
−7.33 (−2.63) −13.12 (−4.78) −17.83 (−6.59) 2040 −2.79 (−0.93) −7.70 (−2.62) −11.77 (−4.05) MJJ 60–90◦N 2000
−18.20 (−5.41) −26.17 (−7.91) −32.57 (−10.00) 2040 −12.30 (−3.48) −20.25 (−5.82) −26.65 (−7.77) 30–60◦N 2000
−6.64 (−2.13) −11.06 (−3.58) −14.90 (−4.88) 2040 −2.15 (−0.66) −6.27 (−1.96) −9.84 (−3.11) 30–60◦S 2000
−8.67 (−2.80) −13.17 (−4.33) −16.98 (−5.70) 2040 −1.90 (−0.58) −5.59 (−1.75) −8.93 (−2.84) 60–90◦S 2000
−15.93 (−5.78) −21.87 (−8.21) −26.35 (−10.23) 2040 −7.08 (−2.32) −12.23 (−4.11) −16.44 (−5.67) ASO 60–90◦N 2000
−8.16 (−2.58) −15.11 (−4.86) −20.79 (−6.79) 2040 −1.53 (−0.47) −7.69 (−2.38) −12.66 (−3.97) 30–60◦N 2000
−3.20 (−1.05) −7.26 (−2.42) −10.63 (−3.59) 2040 2.03 ( 0.65) −1.56 (−0.50) −4.53 (−1.48) 30–60◦S 2000
−13.63 (−4.46) −16.62 (−5.58) −18.75 (−6.44) 2040 −7.71 (−2.37) −11.03 (−3.47) −13.59 (−4.38) 60–90◦S 2000
−26.04 (−14.62) −23.75 (−14.39) −21.24 (−13.80) 2040 −33.27 (−13.44) −33.06 (−14.42) −31.89 (−15.02) NDJ 60–90◦N 2000
−6.06 (−1.65) −11.14 (−3.07) −15.46 (−4.31) 2040 0.42 ( 0.11) −3.78 (−0.97) −7.46 (−1.93) 30–60◦N 2000
−2.78 (−0.85) −6.01 (−1.85) −8.78 (−2.73) 2040 1.91 ( 0.56) −0.79 (−0.23) −3.17 (−0.94) 30–60◦S 2000
−7.81 (−2.70) −9.26 (−3.26) −10.27 (−3.66) 2040 −6.33 (−2.07) −7.98 (−2.65) −9.02 (−3.05) 60–90◦S 2000
ACPD
12, 21923–21945, 2012Impact of VSL halogens on ozone
and UV radiation
S. Tilmes et al.
Title Page
Abstract Introduction
Conclusions References
Tables Figures
◭ ◮
◭ ◮
Back Close
Full Screen / Esc
Printer-friendly Version
Interactive Discussion
Discussion
P
a
per
|
Dis
cussion
P
a
per
|
Discussion
P
a
per
|
Discussio
n
P
a
per
|
BrO WACCM, GOME, SZA < 70.
−50 0 50
0 2 4 6 8 10
Strat.Column BrO (10
13 molec/cm
2)
April
WACCM VSL Bry: 0 ppt GOME
BrO WACCM, GOME, SZA < 70.
−50 0 50
0 2 4 6 8 10
April
WACCM VSL Bry: 6 ppt WACCM VSL Bry: 10 ppt GOME trop.BrO: 0.5 ppt GOME trop.BrO: 1.0 ppt GOME trop.BrO: 1.5 ppt
, ,
−50 0 50
Latitude 0
2 4 6 8 10
Strat.Column BrO (10
13 molec/cm
2)
October
WACCM VSL Bry: 0 ppt GOME
, ,
−50 0 50
Latitude 0
2 4 6 8 10
October
WACCM VSL Bry: 6 ppt WACCM VSL Bry: 10 ppt GOME trop.BrO: 0.5 ppt GOME trop.BrO: 1.0 ppt GOME trop.BrO: 1.5 ppt
Fig. 1. Left panels: Comparison of zonal average of total column BrO from GOME satellite observations in 1997 (Chance, 1998) (red lines) to WACCM stratospheric column BrO (black lines) for the year 2000. Right panels: Inferred stratospheric column BrO from GOME total column adjusted for the presence of various amounts of tropospheric BrO (see text) (red lines,
see legend) and zonal average of WACCM stratospheric BrO column, assuming different levels
of BrVSLy (black lines; see legend). Top panels are for April and bottom panels for October. Error
ACPD
12, 21923–21945, 2012Impact of VSL halogens on ozone
and UV radiation
S. Tilmes et al.
Title Page
Abstract Introduction
Conclusions References
Tables Figures
◭ ◮
◭ ◮
Back Close
Full Screen / Esc
Printer-friendly Version
Interactive Discussion
Discussion
P
a
per
|
Dis
cussion
P
a
per
|
Discussion
P
a
per
|
Discussio
n
P
a
per
|
Geo−engineering − Baseline, Year 2040
−50 0 50
−15 −10 −5 0 5
% Difference
FMA
VSL=0 VSL=6 VLS=10+100
Geo−engineering − Baseline, Year 2040
−50 0 50
−15 −10 −5 0 5
MJJ
VSL=0 VSL=6 VLS=10+100
−50 0 50
Equivalent Latitude −15
−10 −5 0 5
% Difference
ASO
VSL=0 VSL=6 VLS=10+100
−50 0 50
Equivalent Latitude −15
−10 −5 0 5
NDJ
VSL=0 VSL=6 VLS=10+100
Fig. 2.Relative difference of column ozone between geo-engineering and baseline model
re-sults for four seasons (different panels). All calculations are for year 2040. Different values of
VSL halogens are considered: BrVSLy and ClVSLy both = 0 (black), BrVSLy =6 ppt and ClVSLy =
0 (red), and BrVSLy = 10 ppt and ClVSLy = 100 ppt (blue). Results are shown as a function of
ACPD
12, 21923–21945, 2012Impact of VSL halogens on ozone
and UV radiation
S. Tilmes et al.
Title Page Abstract Introduction Conclusions References Tables Figures ◭ ◮ ◭ ◮ Back Close
Full Screen / Esc
Printer-friendly Version Interactive Discussion Discussion P a per | Dis cussion P a per | Discussion P a per | Discussio n P a per |
% Change Geo−eng. − Baseline VSL=0 2040
−135 −90 −45 0 45 90 135 180
−90 −60 −30 0 30 60 90
−135 −90 −45 0 45 90 135 180
−90 −60 −30 0 30 60 90 −8 −6 −4 −2 0 2 4 6 8 12 20 %UVERY 0 0 0 0 ANN
% Change Geo−eng. − Baseline VSL=6 2040
−135 −90 −45 0 45 90 135 180
−90 −60 −30 0 30 60 90
−135 −90 −45 0 45 90 135 180
−90 −60 −30 0 30 60 90 −8 −6 −4 −2 0 2 4 6 8 12 20 0 0 0 0 0 0 0 0 0 0 ANN
% Change Geo−eng. − Baseline VSL=10,100 2040
−135 −90 −45 0 45 90 135 180
−90 −60 −30 0 30 60 90
−135 −90 −45 0 45 90 135 180
−90 −60 −30 0 30 60 90 −8 −6 −4 −2 0 2 4 6 8 12 20 0 0 ANN
Fig. 3. Relative changes of UV radiation weighted for human erythema (skin-reddening) as a result of changes in column ozone due to geo-engineering compared to the baseline simula-tion for projected chemical condisimula-tions for the year 2040. The addisimula-tional amount of stratospheric
bromine from VSL halogens is assumed to be zero (top) and BrVSLy =6 ppt (middle) and BrVSLy
ACPD
12, 21923–21945, 2012Impact of VSL halogens on ozone
and UV radiation
S. Tilmes et al.
Title Page
Abstract Introduction
Conclusions References
Tables Figures
◭ ◮
◭ ◮
Back Close
Full Screen / Esc
Printer-friendly Version
Interactive Discussion
Discussion
P
a
per
|
Dis
cussion
P
a
per
|
Discussion
P
a
per
|
Discussio
n
P
a
per
|
Erythemal UV VSL = 0
−50 0 50
−5 0 5 10 15 20 25 30
Change (%)
FMA
Erythemal UV VSL = 10+100
−50 0 50
FMA Aerosol+Ozone Ozone Aerosol
−50 0 50
−5 0 5 10 15 20 25 30
Change (%)
MJJ
−50 0 50
MJJ
−50 0 50
−5 0 5 10 15 20 25 30
Change (%)
ASO
−50 0 50
ASO
−50 0 50
Latitude (N) −5
0 5 10 15 20 25 30
Change (%)
NDJ
−50 0 50
Latitude (N) NDJ
Fig. 4.Changes in UVERY as a result of geo-engineering, assuming volcanic-sized aerosols for the year 2040, based on changes of column ozone only (dashed lines), changes due to the enhanced volcanic-sized aerosol scattering only (dotted lines), and, consideration of both column ozone changes and enhanced aerosol scattering (solid). Results are shown for four seasons, noontime conditions averaged over 10 degrees latitude bands. We consider
simu-lations with two different amounts of VSL halogen species in the stratosphere (VSL =0: left