www.jped.com.br
ORIGINAL
ARTICLE
Deuterium
oxide
dilution
and
body
composition
in
overweight
and
obese
schoolchildren
aged
6---9
years
夽
Wendell
Costa
Bila
a,∗,
André
Everton
de
Freitas
b,
Alexsandro
Sobreira
Galdino
c,
Eduardo
Ferriolli
d,
Karina
Pfrimer
d,
Joel
Alves
Lamounier
aaPost-GraduatePrograminHealthSciences,UniversidadeFederaldeSãoJoãodelRei(UFSJ),Divinópolis,MG,Brazil
bPost-GraduatePrograminChildandAdolescentHealth,FaculdadedeMedicina,UniversidadeFederaldeMinasGerais(UFMG),
BeloHorizonte,MG,Brazil
cPost-GraduatePrograminBiotechnology,UniversidadeFederaldeSãoJoãoDelRei(UFSJ),Divinópolis,MG,Brazil dFaculdadedeMedicinadeRibeirãoPreto,UniversidadedeSãoPaulo(USP),RibeirãoPreto,SP,Brazil
Received26January2015;accepted24March2015 Availableonline3August2015
KEYWORDS
Deuterium; Bodycomposition; Obesity;
Overweight; Child
Abstract
Objective: Tocorrelatedifferentmethods ofbody compositionassessmentinoverweightor
obeseschoolchildren,usingdeuteriumoxide(D2O)dilutionasareference.
Methods: Percentageoftotal bodywater(%TBW),fat freemass(%FFM),andbodyfat(%BF)
wereassessedby D2Oandtetrapolarelectricalbioimpedanceanalysis(BIA)in54obeseand
overweightstudentsaged6---9years.Skinfoldthickness(ST),bodymassindex(BMI),conicity
index(CI), waistcircumference(WC), waist-to-heightratio(WHtR),andwaist-to-hip(WHR)
ratiowerealsoused.
Results: Mean values for body composition were 38.4%±8.4% BF, 44.9%±6.1% TBW and
61.6%±8.4%FFM.Therewasnosignificantdifferenceinbodyweight,bodyfatmass(FM),TBW,
andFFMbetweengenders.RegardingD2O,STunderestimated%BF,andoverestimated%FFMin
bothgenders(p<0.05).BIAoverestimated%TBWinthegroupasawholeandinmales(p<0.05).
TheonlypositiveandstrongcorrelationsoccurredinfemalesregardingtheWC(=0.679),CI
(r=0.634),andWHtR(r=0.666).
Conclusions: Inthissampleofobeseandoverweightchildren,therewerestrongcorrelations
between body composition measured by D2O andsome indicesand anthropometric
indica-tors in females, but there was no positive and strong correlation of fat tissue with the
indices/indicatorsatallagesandinbothgenders.
©2015SociedadeBrasileiradePediatria.PublishedbyElsevierEditoraLtda.Allrightsreserved.
夽 Pleasecitethisarticleas:BilaWC,deFreitasAE,GaldinoAS,FerriolliE,PfrimerK,LamounierJA.Deuteriumoxidedilutionandbody compositioninoverweightandobeseschoolchildrenaged6---9years.JPediatr(RioJ).2016;92:46---52.
∗Correspondingauthor.
E-mail:[email protected](W.C.Bila).
http://dx.doi.org/10.1016/j.jped.2015.03.007
2
PALAVRAS-CHAVE
Deutério;
Composic¸ãocorporal; Obesidade;
Sobrepeso; Crianc¸a
Diluic¸ãodoóxidodedeutérioecomposic¸ãocorporalemescolaresdeseisanove anoscomsobrepesoeobesidade
Resumo
Objetivo: Correlacionardiferentesmétodosparaavaliac¸ãodecomposic¸ãocorporalem
esco-laresdiagnosticadoscomsobrepesoeobesos,utilizando-secomoreferênciaadiluic¸ãodeóxido
dedeutério(D2O).
Métodos: Opercentualdeáguacorporaltotal(%ACT),massalivredegordura(%MLG)egordura
corporal(%GC)foramobtidospeloD2Oebioimpedânciaelétricatetrapolar(BIA),em54
estu-dantescomsobrepesoeobesos,comidadeentre6-9anos.Ométododasdobrascutâneas(DC)
utilizando-setriciptalepanturrilha,índicedemassacorporal(IMC),índicedeconicidade(IC),
circunferênciadecintura(CC),relac¸ãocintura/estatura(RCE)erelac¸ãocintura/quadril(RCQ)
tambémforamutilizados.
Resultados: Os valores médios para composic¸ão corporal aferidos pelo D2O foram
38,4±8,4%GC, 44,9±6,1%ACT e61,6±8,4%MLG. Nãohouve diferenc¸a significativaentre o
pesocorporal,massacorporaldegordura(MG),ACTeMLGentreossexos.ConsiderandooD2O,
DCsubestimouo%GCesuperestimouo%MLGemambosossexos(p<0,05).BIAsuperestimou
%ACTnogrupocomoumtodoenomasculino(p<0,05).Asúnicascorrelac¸õesfortesepositivas
ocorreramnogrupofemininonasvariáveisCC(=0,679),IC(r=0,634)eRCE(r=0,666).
Conclusões: Nestaamostradecrianc¸asobesasecomsobrepeso,houvefortescorrelac¸õesentre
acomposic¸ãocorporalmensuradapeloD2Oealgunsíndiceseindicadoresantropométricosnas
meninas, masnenhumacorrelac¸ãoforteepositiva dotecidoadiposofoiencontrada comos
índices/indicadoresemtodasasidadeseambosossexos.
©2015SociedadeBrasileiradePediatria.PublicadoporElsevierEditoraLtda.Todososdireitos
reservados.
Introduction
Highlevelsofbodyfatareassociatedwithincreased mor-bidity,andoverweightandobesitydefinitionsareassociated withhealthrisks.1Aschildhoodobesityhasbecomean epi-demic worldwide,studies performed in several regionsof Brazilhavedemonstratedthemarkedincreaseofoverweight andobesityinchildhoodandadolescence.2,3
Normally,bodycompositionisusedasanimportant nutri-tionalindicator, allowing the divisionof body weightinto components, specifically lean body mass or fat-free mass FFM-(muscle,bone,andwater)andbodyfatmass(FM).4
Toassessthebodycompositionofanindividual,thetotal bodywater(TBW)canbemeasuredthroughtheingestionof adoseoflabeledwaterand,subsequently,FFMandFMare calculatedusing hydration coefficients.5 Evidence demon-stratesagrowinginterestintheuseofisotopesinresearch activitiesaimedatnutritionalandmetabolicstatus,mainly inchildren.6
Isotopic dilution with deuterium oxide (D2O) is the standard technique for measuring TBW,and is most com-monlyusedtomeasureTBWinchildren.7Bodycomposition characterization using D2O offers important advantages when compared to other methods, as it is innocuous to humans and can be used in pregnant women, children, andtheelderly, withnoclinical consequences.Verysmall amountsofmaterialarerequired forthesample,whichis particularlyadvantageousinpediatricuse.8
The aim ofthis studywastocorrelate different meth-odsusuallyemployedinclinicalpracticeforassessingbody composition,specificallyinschoolchildrenagedbetween6
and9 yearsdiagnosed withoverweight andobesity,using deuterium oxide (D2O) dilution asthe referencemethod. Among the methods used, body mass index (BMI), waist circumference(WC),waist-to-heightratio(WHtR), waist-to-hipratio(WHR),conicityindex(CI),skinfoldthickness(ST), andtetrapolarbioelectricalimpedanceanalysis(BIA)were analyzed.
Materials
and
methods
Studysiteandpopulation
This study was approved by CEPES/UFSJ-CCO (Comitê de ÉticaemPesquisa/UniversidadeFederaldeSãoJoãodelRei ---CampusCentro Oeste), Edict No.265,272, according to thecurrent normsofthePost-GraduatePrograminHealth Sciences,UFSJ-CCO.
Datawereobtainedfromastudyofprevalenceof over-weight and obesity, registered under No. 5533p2 in the Brazilian Registry of Clinical Trials (Registro Brasileiro de EnsaiosClínicos [ReBEC]),inasample of1564school chil-drenaged6---9years(fullyears)enrolledinpublicschools, fromthefirsttothefifthyearofelementaryschool.Atotal of1019childrenwereevaluated;thosewhowereintheBMI percentilerange≥85or≥95,accordingtogenderandage, wereclassifiedasoverweightor obese,respectively.9 The prevalenceofoverweightandobesitywas11.6%,10whichis equivalentto119children,characterizingthesubsetofdata thatcomprisedtheinitialstudysample.
signedby parents and/or guardians,thosewithinfectious diseases, balance disorders, and history of brain surgery, as the data collected were also part of a study that evaluatedtheresultsofaphysicalactivityprogramon bio-chemicalvariables.Onthecollectionday,studentswhodid notfollowthepreviousrecommendations(suchasthosewho fastedlessthaneighthoursorwhoparticipatedinstrenuous physicalactivityintheprevious24h)werealsoexcluded.
Datacollection
All assessments were performed in the morning in a pri-vate room where anthropometric and body composition parameterswereobtained.Measurementswereconducted bypreviouslytrainedevaluators.
Bodyweightwasmeasuredusingadigitalelectronicscale (BF-683W;Tanita® ---IL,USA)withamaximumcapacityof 150kgandprecision of100g,according tothetechniques recommended by Jellife in 1968.11 Height was measured usingamobileverticalanthropometer(ALTUREXATA® ---BH, Brazil)gradedincentimetersupto2.13mandwithprecision of0.1cm.
A two-meter long, flexible, inelastic anthropometric tape, divided into centimeters and subdivided into mil-limeters, was used to measure waist (WC) and hip (HC) circumference.The individualremainedintheorthostatic positionandallmeasuresoccurredinthehorizontalplane, takingcarenottocompresssofttissues.WCwasobtained duringnormalexpiration,usingthemidpointbetweenthe lastribandtheiliaccrestasreference,andtheHC measure-mentwasobtainedusingthewidestpointofthehipatthe levelofthegreatertrochanterofthefemurasreference.
Tocarryoutthemeasurementoftriceps (TSF)andcalf skinfold(CSF)thatwereusedintheequationsproposedby Slaughteretal.,12 askinfoldcaliperwasused(Lange Skin-foldCaliper---MI,USA)withascaleof0---60mmandprecision of±1mm.12Allmeasurementswereperformedontheright side of thebody, in triplicate, considering the arithmetic meanvalue asrepresentative of the region.The TSF was measured onthe posterior partof the right arm (vertical direction),atmidpointbetweenthescapulaacromionand theulnaolecranon. The CSFwasmeasured onthemedial sideoftherightleg(verticaldirection)atthepointof maxi-mumcircumferenceofthecalf,withthekneeandhipflexed to90◦.TheequationproposedbySlaughteretal.13wasused tocalculate%BF.TheequationFFM=bodyweight−FM pro-posedbyBarbosa-Cortésetal.14 wasusedtocalculatethe absolutevalueoftheFFM,anditsresultwasmultipliedby 100 and divided by the body weight value to obtain the %FFM.
BIAvariableswereobtainedusingthehorizontal tetrap-olarBIAequipment(Quadscan4000;Bodystat---IsleofMan, BritishIsles).
The plateauprotocol15 wasused for bodycomposition measurement through the isotope dilution of deuterium oxide(D2O).Standarddosesof2g,3g,and4gofdeuterium oxide were administered to children weighing 20---30kg, 30---50kg,and50---70kg,respectively,withdosesdistributed inindividualvialsandadministeredorallytoeverychild.The basalsalivasamplewascollectedafteraneight-hourfast. Subsequently, the diluted D2O solution was offered. The
secondsamplewascollectedthreehoursafterthe adminis-trationofthediluteddose(post-dose).
Basedonthefundamentalprincipleofdilution, concen-tration andvolumeof D2Opresent andmeasured insaliva arecorrelated beforeand after dose ingestion, disclosing thetotalbodywatervolume,whichprovidesacalculation ofFFM,usingthespecifichydrationcoefficients.
All samples were stored at −20◦C and sent to the Mass SpectrometryLaboratory oftheDepartmentof Clini-calMedicineatFaculdadedeMedicinadeRibeirãoPretoof UniversidadedeSãoPaulo,forlaboratoryanalyses.
Statisticalanalysis
AlldatawerecodedandstoredusingSPSSstatistical soft-ware (IBM Corp. Released 2011. IBM SPSS Statistics for Windows,version20.0. NY,USA). Descriptiveresults were obtainedthroughcentraltrend(meanandmedian)and dis-persionmeasures(standarddeviation).
Theanalyticalstatisticswasinitiallyperformedthrough univariate analysis, with a 95% confidence interval and a significancelevelof5%.TheShapiro---Wilktestwasusedto verifythenormaldistributionofvariables.Student’stand Mann---Whitney tests were used to compare, respectively, variables(FM,TBW,orFFM)withnormalornon-normal dis-tributionintheindependentgroups.
ANOVAwasusedtocompareindependentvariablesand Tukey’stestwasusedtoidentifythevariablesofcause.
Pearson’scorrelationcoefficient(r)andSpearman’srho ()wereusedtoevaluatethecorrelation,respectively, of
variables withnormalor non-normaldistribution between %BF measured by deuterium method and anthropometric indexes/variables,qualitativelyevaluatedaccordingtothe criteriaestablishedbyCallegari-Jacques.16
Results
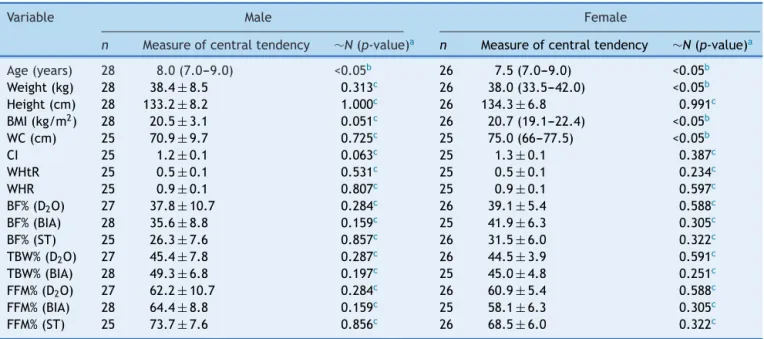
Ofthe79childrenwhoagreedtoparticipateandwere ini-tiallyincludedinthestudy,54individuals(28boysand26 girls) comprised the final sample, due to losses incurred duringdata collectionandanalysis.Bothgroups (pre-and post-loss) statistically maintained similar anthropometric characteristics(p=0.682).Exceptforage,weight,BMI,and CI, all other individuals in this total sample showed nor-maldistribution.Table1showsthedatadistribution.Median ageandBMIinthegroupwereeightyearsand20.3kg/m2, respectively.
Thepercentageoftotalbodywater(%TBW)obtainedby D2O method and BIA were significantly different (ANOVA,
˛=0.05).Differencesinthisvariableweresignificantforthe
groupasawhole(44.9%vs.47.6%)andforthemalegender (45.4%vs.49.3%)butnotforfemales.
The%FFMmeasuredthroughD2OandSTalsodiffered sig-nificantly(p<0.05)inthetotalsample(61.6%vs.71.1%),in males(62.2%vs.73.7%),andinfemales(60.9%vs.68.5). Sig-nificantdifferenceswerenotverifiedbetweenthemeansof %FFMusingtheD2OandBIAmethods.
2
Table1 Descriptionofthestudyvariablesofschoolchildrenaged6---9yearswithoverweightandobesity.
Variable Male Female
n Measureofcentraltendency ∼N(p-value)a n Measureofcentraltendency ∼N(p-value)a
Age(years) 28 8.0(7.0---9.0) <0.05b 26 7.5(7.0---9.0) <0.05b
Weight(kg) 28 38.4±8.5 0.313c 26 38.0(33.5---42.0) <0.05b
Height(cm) 28 133.2± 8.2 1.000c 26 134.3± 6.8 0.991c
BMI(kg/m2) 28 20.5±3.1 0.051c 26 20.7(19.1---22.4) <0.05b
WC(cm) 25 70.9± 9.7 0.725c 25 75.0(66---77.5) <0.05b
CI 25 1.2±0.1 0.063c 25 1.3±0.1 0.387c
WHtR 25 0.5± 0.1 0.531c 25 0.5± 0.1 0.234c
WHR 25 0.9±0.1 0.807c 25 0.9±0.1 0.597c
BF%(D2O) 27 37.8± 10.7 0.284c 26 39.1± 5.4 0.588c
BF%(BIA) 28 35.6± 8.8 0.159c 25 41.9± 6.3 0.305c
BF%(ST) 25 26.3±7.6 0.857c 26 31.5±6.0 0.322c
TBW%(D2O) 27 45.4± 7.8 0.287c 26 44.5± 3.9 0.591c
TBW%(BIA) 28 49.3±6.8 0.197c 25 45.0±4.8 0.251c
FFM%(D2O) 27 62.2± 10.7 0.284c 26 60.9± 5.4 0.588c
FFM%(BIA) 28 64.4±8.8 0.159c 25 58.1±6.3 0.305c
FFM%(ST) 25 73.7± 7.6 0.856c 26 68.5± 6.0 0.322c
n,samplesize;∼N,normaldistribution;BMI,bodymassindex;WC,waistcircumference;CI,conicityindex;WHtR,waist-to-heightratio; WHR,waist-to-hipratio;BF%,bodyfatpercentage;D2O,deuteriumoxide;BIA,Bioimpedance;ST,skinfoldthickness;TBW%,totalbody waterpercentage;FFM%,fat-freemasspercentage.
a Shapiro---Wilktest(confidenceinterval=95%). b Doesnothavenormaldistribution.
c Hasnormaldistribution.
differences (p<0.05) between the means in D2O and ST, eitherinthegroupasawhole(38.4%vs.29.3%),inthemales (37.8%vs.26.3%),andinfemales(39.1%vs.31.5%).There wasnosignificantdifferencein%BFmeasuredbytheBIAand D2Omethods.
Table2showstheabsolutevaluesofbodyweight,height, TBW,FFM,andFMmeasuredbyD2O,consideringgender.
Therewasnostatisticallysignificantdifferencebetween body weight and FM between the genders (p=0.924 and p=0.972,respectively).TBWandFFMdidnotsignificantly differ,either(p=0.777andp=0.775,respectively).
Table 3 shows thecorrelation of %BFby D2O,with the anthropometric indices and measurements. Fair but sig-nificant correlations(p<0.05)wereobserved inthe group asawholebetween the%BF, bodyweight(=0.385), BMI
(=0.445), and CI (=0.549). Similar results were found
between%BF,WC(r=0.440),andWHtR(r=0.463).
Afair,butsignificantcorrelationwasobservedbetween %BFandBMI(r=0.389)amongboys.
Faircorrelationsbetween%BFbyD2O,BMI(r=0.513),and WHR(r=0.481)werefoundinthefemalegender.Moreover, strongandsignificantcorrelations(p<0.05)wereobserved inthisgroupbetween%BF,WC(=0.679),CI(r=0.634),and WHtR(r=0.666).
Discussion
The%BFobtainedbyD2Ointhisstudywasgreaterthanthat describedbyDeurenbergetal.,citedbyFilho17inastudy using skinfolds of 378 children and adolescentsto define excessofbodyfat(20%and25%forboysandgirls, respec-tively).Therefore,thissample ofchildren aged6---9 years
classifiedasobeseoroverweighthadexcessbodyfat.None of the anthropometricindices/measurements usedin this study positively and strongly correlated withthe amount of adipose tissue at all ages and in both genders, which callsforprecautionsregardingtheirexclusiveanddefinitive useforthediagnosisofexcessbodyfat.
TBW wassignificantly different when measured by BIA and D2O, which potentiates misdiagnosis regarding body hydration.Resendeetal.18alsofoundsignificantdifferences inthe%TBW inobese adolescentswhenmeasured byD2O and tetrapolar BIA, withan overestimation of the values obtainedbyBIA.
Whileinthisstudynosignificantdifferencesin%FFMwere foundbetweenD2OandBIA,astudybyResendeetal.,19with obeseadolescentsand meanage of 11.2±0.9years,also using tetrapolar bioimpedance, found significantly higher (overestimation) FFM values measured by BIA when com-paredtoD2O.
TheSTmethodwithtwoskinfoldmeasuresandequations proposedbySlaughteretal.13underestimatedthe measure-mentof%BF,whichwouldleadtothemisinterpretationof reducedhealthrisksassociatedwithexcessbodyfatinthese individuals.However, accordingto Himes,20 skinfold mea-surementsusuallyshowbettercorrelation withtotalbody fatthanBMI.
Table2 DistributionofabsolutevaluesofbodycompositionvariablesobtainedbyD2Omethod,accordingtogender.
Variable(kg) Male Female
n X± X n X± X p-valuea
Bodyweight 28 38.4±8.5 38.1 26 38.9±8.4 38.0 0.924b
TBW 27 17.4±3.7 18.0 26 17.1±3.1 16.3 0.777c
FFM 27 23.8± 5.0 24.6 26 23.5± 4.3 22.4 0.775c
FM 27 15.0±5.9 15.1 26 15.4±5.0 14.3 0.972b
n,samplesize;X,samplemean;,standarddeviation;X,Median;TBW,totalbodywater;FFM,fat-freemass;FM,fatmass. aConfidenceinterval=95%.
b Mann---Whitneytest. c Student’st-test.
BIA prediction equations vary depending on the refer-encepopulationfromwhichtheyarederivedanddifferent equationsmayalsoyielddifferentbodyfatestimates. Con-sequently,althoughthemeasurementsareperformedwith goodreliability,biasesresultingfrompredictionequations andtheiradaptationstothestudiedpopulationarea con-cernregardingBIA.20
Bodyweightand BMIshoweda significant positive cor-relation,butonly afaironewith%BFmeasured atD2Oin thegroupasawhole.Escott-Stump22 statedthatBMIisnot a useful indicator in childhood tobe usedas a screening tool,asitdoesnotreflectbodycomposition.Freedmanand Sherry23statedthatchangesinweightandheightthatoccur duringthe growthprocess (agesbetween 5and 18 years) resultin substantialincreases(50%) inBMI, whichfurther complicatestheinterpretationofthisindexinchildrenand adolescents.
TheWHRwasnotreliablewhencomparedto%BF mea-suredbythereferencemethod,buttheWC,CI,andWHtR showedstrongandpositivecorrelationsinthefemale gen-der,demonstratingtheyaregoodindicatorsofhighbodyfat
in this group.In multiple regression models,WCwasalso found tobe betterthan BMItopredict insulin resistance, blood pressure, serumcholesterol and triglyceridelevels, especiallyinadolescents,accordingtoastudypublishedby Himes.20
AccordingtoOliveiraetal.,24 WChasbeenusedin out-patientcaretoassessfatdepositionintheabdominalarea of children and adolescents, as this single variable has shownabetterassociationwithmetabolicchangesthanthe waist---hipcircumferenceratio(WHR).
Inthis study,themean value correspondingtotheWC inthegroupasawholeshowedtobehigherthanthe cut-offof71cm,recommendedasalimitfortheoccurrenceof healthrisks.25 However,24individuals(44.4%)hadalower WC value than the cutoff, 16 (29.6%) with %BF>33%, an importantcutoffvalueforcardiovascularriskrecommended byABESO(Associac¸ãoBrasileiraparaoEstudodaObesidade e Síndrome Metabólica)25 measured by DEXA(DualEnergy X-rayAbsorptiometry)inthestudybyHigginsetal.26 with children aged4---11years.Therefore,the exclusiveuse of theWCcouldleadtoafalse-negativeriskassessment.
Table3 Comparisonsbetweenbodyfatpercentagemeasuredbydeuteriumoxidedilutionwiththeanthropometricindicesand
measurementsinschoolchildrenaged6---9yearswithoverweightandobesity.
Index/anthropometricmeasure n Measureofcentraltendency Correlationcoefficient Levelofcorrelationc p-value
Male
Bodyweight 28 38.4±8.5 0.374a Fair 0.055
BMI 28 20.5±3.1 0.389a Fair 0.045d
WC 25 70.9± 9.7 0.371a Fair 0.074
CI 25 1.2±0.1 0.346a Fair 0.097
WHtR 25 0.5±0.1 0.384a Fair 0.064
WHR 25 0.9± 0.1 0.158a Weak 0.461
Female
Bodyweight 26 38.0(33.5---42.0) 0.385b Fair 0.052
BMI 26 20.7(19.1---22.4) 0.513b Fair 0.007d
WC 25 75.0(66---77.5) 0.679b Strong 0.000d
CI 25 1.3± 0.1 0.634a Strong 0.001d
WHtR 25 0.5±0.1 0.666a Strong 0.000d
WHR 25 0.9±0.1 0.481a Fair 0.015d
BMI,bodymassindex;WC,waistcircumference;CI,conicityindex;WHtR,waist-to-heightratio;WHR,waist-to-hipratio. aPearson’scorrelation(normaldistribution).
b Spearman’srho(nonparametricdistribution). c AccordingtoCallegari-Jacques.16
2
Additionally, six individuals(11.1%) hadWCbelow the proposed cutoff points for detection of high fat mass in thetrunk(adjustedforage/gender),27butwith%BFhigher than the cutoff point used in this study, also potentially characterizingfalsenegativeresults.
According toCI cutoffpointsused for excess fat iden-tificationrecommendedbySant’Annaetal.28intheirstudy withchildrenaged6---9yearsold,fourindividuals(7.4%)had acceptable values, but with %BFhigher than that recom-mendedinthisstudyasborderline,adjustedbygender/age, whichcanalsocharacterizefalsenegativeresults.
ThemeanvaluesofWHtRinthegroupasawholeshowed tobe slightly higher than the cutoffof 0.50cm,which is thethresholdforhealth riskinindividualsofbothgenders after the age of six, according to a study carried out by McCarthyandAshwell(2006)thatevaluated8135children andadolescents.29 However,15children(27.8%) showeda lowerWHtRthanthisvalueandahigher%BFthanthe refer-enceusedinthisstudy,whichcouldresultinfalsenegative resultsifitweretheonlyvariableassessed.
FreedmanandSherry23 affirmthattheskinfoldand cir-cumference measurementsrequireadditionaltrainingand maybe difficulttostandardize. The informationprovided bythesemeasuresinchildrenwithexcessweightisactually inexact.
Allindividualsshoweda%TBWbelow50%ofbodyweight. Overweight or obese children potentially have less TBW, probablyjustifiedby higherFMand%BF.Kliegman etal.30 reportedthatthegreateramountoffatinoverweight chil-drencausesareductionintheTBWasapercentageofbody weight.
Studylimitationsincludetheanalysisofasubsetofdata from a study with cross-sectional design, which does not translateintoanyconclusionsaboutcausalassociationsand doesnotallowcomparisonswithotherstudieswithidentical design,methodology,andpopulation.
Theresultsofinthisstudysuggestconsideringtheuseof indexesandanthropometricmeasurements,skinfold thick-ness,andbioimpedanceastoolsforthedefinitivediagnosis ofoverweightandobesityinchildren,astherewasno abso-luteagreementofanyofthetechniquesatallagerangesin bothgenders.
More studies are clearly necessary in this age range of the population, especially on the viability of greater use of the D2O method for body compositionassessment, consideredareferenceforthemeasurementofTBWin chil-dren,asitrequiressmallersamplequantityandisinnocuous tohumans,withnorisksorclinicalconsequences.
Conflicts
of
interest
Theauthorsdeclarenoconflictsofinterest.
Acknowledgements
The authors would like to thank CAPES (Coordenac¸ão de Aperfeic¸oamento de Pessoal de Nível Superior) for finan-cialsupport.TheyalsothankthePost-GraduateProgramin HealthSciencesofUniversidadeFederaldeSãoJoãodelRei, forthefinancialandinstitutionalsupport,throughits pro-fessionals and teachers,particularly toProfessor Gilberto
Fontes,whocontributedwithimportantsuggestionsforthe article.
References
1.SpeiserPW,RudolfMC,AnhaltH,Camacho-HubnerC,Chiarelli F,Eliakim A, et al. Consensus statement: childhood obesity. JClinEndocrinolMetab.2005;90:1871---87.
2.Abrantes MM, Lamounier JA, Colosimo E. Prevalência de sobrepesoeobesidadenasregiõesnordesteesudestedoBrasil. JPediatr(RioJ).2002;78:335---40.
3.Silveira JA, Colugnati FA, Cocetti M, Taddei JA. Secular trendsand factors associatedwithoverweightamong Brazil-ianpreschool children:PNSN-1989,PNDS-1996,and 2006/07. JPediatr(RioJ).2014;90:258---66.
4.FerriolliE,CruzBM,PfrimerK.Usodeisótoposlevesem ciên-ciasnutricionais.In:OliveiraJE,MarcrhiniJS,editors.Ciências nutricionais:aprendendoa aprender.SãoPaulo(SP):Sarvier; 2008.p.443---65.
5.IAEA. Targeting malnutrition: isotopic tools for evaluating nutritionworldwide; 1996.Available from:http://www.iaea. org/Publications/Booklets/Malnutrition/seven.html [cited 30.05.13].
6.Wells JC, Chomtho S, Fewtrell MS. Programming of body composition by early growth and nutrition. Proc Nutr Soc. 2007;66:423---34.
7.Alemán-MateoH,EsparzaRomeroJ,MaciasMoralesN,Salazer G,HernándezTrianM,ValenciaME.Bodycompositionby three-compartmentmodelandrelativevalidityofsomemethodsto assesspercentagebodyfatinMexicanhealthyelderlysubjects. Gerontology.2004;50:366---72.
8.KoletzkoB,DemmelmairaH,HartlbW,KindermannA,Koletzko S,SauerwaldT,etal.Theuseofstableisotopetechniquesfor nutritionaland metabolicresearch inpaediatrics.EarlyHum Dev.1998;53:S77---97.
9.DeOnisM,OnyangoAW,BorguiE,SiyamA,NishidaC,Siekmann J. Developmentofa WHO growth reference for school-aged childrenandadolescents.WHO(Genebra).2007;85:660---7. 10.FreitasAE[Thesis]Avaliac¸ãodoimpacto deumprogramade
atividadefísicanaconcentrac¸ãoplasmáticadeadipocitocinas egrelinaemcrianc¸asobesasecomsobrepeso,deescolas públi-casdazona urbanadeOuroPreto,MG.BeloHorizonte,MG: UniversidadeFederaldeMinasGerais;2010.
11.JelliffeDB.Evolucióndelestadodenutricióndelacomunidad. Ginebra:OrganizaciónMundialdelaSalud;1968.
12.HeywardVH,StolarczylLM.Avaliac¸ãodacomposic¸ãocorporal. SãoPaulo,SP:Manole;2000.
13.SlaughterMH,LohmanTG,Boileau RA,Horswill CA,Stillman RJ,LoanMD,etal.Skinfoldequationsforestimationsofbody fatnessinchildrenandyouth.HumBiol.1988;60:709---23. 14.Barbosa-Cortéz L, Tapia-Rojas M, López-Aguilar E,
Mejía-AranguréJM,Rivera-MárquezH.Bodycompositionbydilutionof deuteriumoxideinMexicanchildrenwithlymphomaandsolid tumors.Nutrition.2007;23:739---44.
15.AzócarMP,CanoFS,MarínVB,DíazEB,SalazarGR,VásquezLF. Estimacióndeláguacorporaltotalpordeutérioemdiálisis perit-onealpediátrica.RevChilPedriatr(Santiago).2003;74:504---10. 16.Callegari-Jacques SM. Bioestatística.Princípios eaplicac¸ões.
SãoPaulo,SP:Artmed;2007.
17.FilhoJF.Apráticadaavaliac¸ãofísica.2nded.RiodeJaneiro, RJ:Shape;2003.
19.ResenCM,JúniorJS,VieiraMN,FerriolliE,PfrimerK,Perdoná GS, et al. Body compositionmeasures ofobese adolescents bythedeuteriumoxidedilution methodandbybioelectrical impedance.BrazJMedBiolRes.2011;44:1164---70.
20.Himes JH. Challenges of accurately measuring and using BMI and other indicators of obesity in children. Pediatrics. 2009;124:S3---22.
21.CamarneiroJM,JuniorJSC,CiampoLAD,NavarroAM,Antonucci GA,MonteiroJP.Bodycompositionestimativesby anthropom-etry,bioelectricalimpedanceanddeuteriumoxidedilutionin obeseadolescents.FoodNutrSci(Irvine).2013;4:9---17. 22.Escott-StumpS. Nutric¸ãorelacionadaaodiagnósticoe
trata-mento.5ed.Barueri,SP:Manole;2007.
23.Freedman DS, Sherry B. The validity of BMI as an indi-cator of body fatness and risk among children. Pediatrics. 2009;124:S23---34.
24.Oliveira CL,De Mello MT,Cintra IP, Fisberg M. Obesidade e síndrome metabólica na infância e adolescência. Rev Nutr (Campinas).2004;17:237---45.
25.ABESO,Associac¸ãoBrasileiraparaoEstudodaObesidadee Sín-drome Metabólica.Diretrizesbrasileiras daobesidade; 2009.
Available from: http://www.abeso.org.br/pdf/diretrizes brasileirasobesidade200920101.pdf[cited06.01.14]. 26.Higgins PB, Gower BA, Hunter GR, Goran MI. Defining
health-related obesity in prepubertal children. Obes Res. 2001;9(4):233---40.
27.TaylorRW,Jones IE,Williams SM,GouldlingA. Evaluationof waistcircumference,waist-to-hipratio,andtheconicityindex asscreeningtoolsforhightrunkfatmass,asmeasuredby dual-energyX-rayabsorptiometry,inchildrenaged3---19y.AmJClin Nutr.2000;72:490---5.
28.Sant’anna MS, Tinôco AL, Rosado LE, Sant’ana LF, Brito IS, AraújoLF,etal.Eficáciadoíndicedeconicidadeedarelac¸ão cintura/estaturaempredizeropercentualdegorduracorporal emcrianc¸as.Nutrire.2010;35:67---80.
29.Mccarthy HD, Ashwell M. A study of central fatness using waist-to-heightratiosinUKchildrenandadolescentsovertwo decadessupportsthesimplemessage---‘keepyourwaist cir-cumferencetolessthanhalfyourheight’. IntJObes(Lond). 2006;30:988---92.