Land cover classification of Lago Grande de Curuai
floodplain (Amazon, Brazil) using multi-sensor and
image fusion techniques
Luiz Felipe de Almeida FURTADO*1,Thiago Sanna Freire SILVA2, Pedro José Farias FERNANDES3,
Evlyn Márcia Leão de Moraes NOVO4
1 Instituto Nacional de Pesquisas Espaciais, Divisão de Sensoriamento Remoto, Avenida dos Astronautas, 1758, Jardim da Granja, São José dos Campos, SP, Brasil. CEP: 12227-010. 2 Instituto de Geociências e Ciências Exatas, UNESP - Universidade Estadual Paulista, Campus de Rio Claro, Departamento de Geografia. Av. 24A, 1515, Rio Claro, SP, Brasil. CEP: 13506-900. 3 Universidade Federal Fluminense, Departamento de Geografia, Instituto de Geociências, Av. Gen. Milton Tavares de Souza s/n - Campus da Praia Vermelha, Niterói, RJ. CEP: 24.210-340. 4 Instituto Nacional de Pesquisas Espaciais, Divisão de Sensoriamento Remoto, Avenida dos Astronautas, 1758, Jardim da Granja, São José dos Campos, SP, Brasil. CEP: 12227-010.
* Corresponding author: [email protected]
ABSTRACT
Given the limitations of different types of remote sensing images, automated land-cover classifications of the Amazon várzea may yield poor accuracy indexes. One way to improve accuracy is through the combination of images from different sensors, by either image fusion or multi-sensor classifications. Therefore, the objective of this study was to determine which classification method is more efficient in improving land cover classification accuracies for the Amazon várzea and similar wetland environments - (a) synthetically fused optical and SAR images or (b) multi-sensor classification of paired SAR and optical images. Land cover classifications based on images from a single sensor (Landsat TM or Radarsat-2) are compared with multi-sensor and image fusion classifications. Object-based image analyses (OBIA) and the J.48 data-mining algorithm were used for automated classification, and classification accuracies were assessed using the kappa index of agreement and the recently proposed allocation and quantity disagreement measures. Overall, optical-based classifications had better accuracy than SAR-based classifications. Once both datasets were combined using the multi-sensor approach, there was a 2% decrease in allocation disagreement, as the method was able to overcome part of the limitations present in both images. Accuracy decreased when image fusion methods were used, however. We therefore concluded that the multi-sensor classification method is more appropriate for classifying land cover in the Amazon várzea.
KEYWORDS: wetlands, remote sensing, synthetic aperture radar.
Classificação da cobertura da terra na planície de inundação do Lago Grande
de Curuai (Amazônia, Brasil) utilizando dados multisensor e fusão de imagens
RESUMO
Dadas as limitações de diferentes tipos de imagens de sensores remotos, classificações automáticas do uso e cobertura do solo na várzea Amazônica podem resultar em índices de acurácia insatisfatórios. Uma das maneiras de melhorar esses índices é através da combinação de dados de distintos sensores, por fusão de imagens ou através de classificações multi-sensores. Desta forma, o presente estudo teve o objetivo de determinar qual método de classificação é mais eficiente em melhorar os índices de acurácia das classificações do uso e cobertura do solo para a várzea Amazônica e áreas úmidas similares – (a) a fusão sintética de imagens SAR e ópticas ou (b) a classificação multi-sensor de imagens ópticas e SAR pareadas. Classificações da cobertura do solo com base em imagens de um único sensor (Landsat TM ou Radarsat-2) foram comparadas com as classificações multi-sensor e classificações baseadas em fusão de imagens. A análise de imagens baseada em objetos (OBIA) e o algoritmo de mineração de dados J.48 foram utilizados para realizar a classificação automática, cuja precisão foi avaliada com o índice kappa e com as medidas de discordância de alocação e de quantidade, recentemente propostas na literatura. Em geral, as classificações baseadas em imagens ópticas apresentaram melhor precisão do que as classificações baseadas em dados SAR. Uma vez que ambos os conjuntos de dados foram combinados em uma abordagem multi-sensores, houve uma redução de 2% no erro de alocação da classificação, uma vez que o método foi capaz de superar parte das limitações presentes em ambas as imagens. Contudo, a precisão diminuiu quando foram usados métodos de fusão de imagens. Concluiu-se que o método de classificação multi-sensor é mais apropriado para classificações de uso do solo na várzea amazônica.
Land Cover Classification of Lago Grande de Curuai Floodplain (Amazon, Brazil) Using Multi-Sensor and Image Fusion Techniques
ACTA
AMAZONICA
INTRODUCTION
Wetlands are important ecosystems, hosting unique biodiversity and providing essential environmental services, as well as acting as sources or sinks of greenhouse gases (Mitch and Gosselink 2007). The Amazon region contains some of the largest wetland areas in the world, estimated at about 800 thousand km² (Melack and Hess 2007). These areas are extensively vegetated, support large animal and botanical diversity and are a significant component in the cycling of carbon and other nutrients (Junk 1997).
Given the extent and importance of the Amazonian wetlands, remote sensing is a valuable tool for acquiring information on ecosystem conditions and landscape evolution, and for supporting resource management and environmental monitoring in a synoptic and systematic manner (Hess et al. 1995).
The intense and near-constant cloud cover in the tropics severely impairs the acquisition of optical remote sensing data. Synthetic aperture radar (SAR) sensors are relatively insensitive to atmospheric conditions, being an important alternative to optical remote sensing for Amazonian and other tropical landscapes. However, the combination of speckle effects and the limited number of SAR wavelengths and polarizations in a single SAR image can often result in poor discrimination among land cover classes (Hess et al. 1995; Silva et al. 2010). For this reason, wetlands SAR classification often relies on multi-temporal imagery (Hess
et al. 2003; Martinez and Le Toan 2007; Silva et al. 2010),
multi-polarized or polarimetric information (Touzi et al. 2009; Sartori et al. 2011), or a multi-frequency approach
(Evans et al. 2010; Evans et al. 2013).
Integrating data from multiple sensors is an alternative approach: optical and SAR sensors acquire complementary information by operating at different regions of the electromagnetic spectrum, and its integration can lead to more accurate information for landscape classification (Pohl and Genderen 1998; Luo et al. 2002; Zhang 2010). This integration can be achieved using two different methods: image fusion or multi-sensor integration. The first method combines the data contained in two or more image bands to form a new synthetic image or group of images. The second method combines n images in n different layers algorithmically, without creating a new set of images (Pohl and Genderen 1998; Luo et al. 2002). Several studies have assessed the effectiveness of integrating multi-sensor imagery to land-cover mapping (Castañeda and Ducrot 2009; Li and Chen 2005; Zhu and Tateishi 2006). Data from different sensors can be integrated using Object Based Image Analysis (OBIA) (Benz et al. 2004; Blaschke 2010), which has been shown to be an effective method for wetland classification
of combined optical and SAR imagery (Silva et al. 2010; Santiago et al. 2013).
Therefore, the objective of this study was to determine which classification method is more efficient in improving land cover classification accuracies for the Amazon várzea and similar wetland environments - (a) synthetically fused optical and SAR images or (b) multi-sensor classification of paired SAR and optical images.
MATERIALS AND METHODS
Study Area
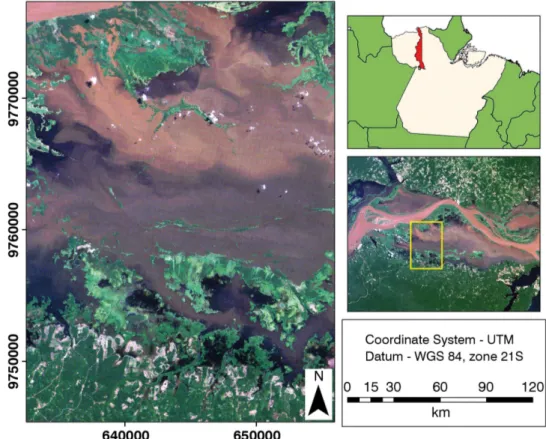
The Lago Grande de Curuai floodplain is located south of the town of Óbidos, in the state of Pará (Brazil), about 900 km from the Amazon river mouth (central coordinate: 2.05°S, 55.5°W). The selected study area comprises a subset of this floodplain, which includes a representative proportion of its main vegetation types (Figure 1). The high water season occurs in June and July, and the low water season occurs in November and December.
Data Acquisition
One dual-polarized Radarsat-2 (RS2, HH / HV) and a mosaic of two Landsat/Thematic Mapper (TM) scenes were employed in the study. The RS2 image was obtained through the Science and Operational Applications Research (SOAR) program of the Canadian Space Agency (CSA). This image was acquired at Standard 1 (S1) imaging mode, with an incidence angle of 23.5º and 12.5 meters of pixel spacing. Acquisition date was 2011-07-06 (yyyy-mm-dd). TM images were acquired from the National Institute for Space Research (INPE) database, freely available at http://www.dgi.inpe.br /, for WRS-2 path 228 and rows 061 and 062. A high water season TM image was acquired for the date of 2008-07-16. Due to cloud-cover, it was not possible to obtain Landsat/ TM imagery from the same year as the RS2 image. A low water season TM image was acquired for the date of 2009-10-07, for validation purposes. Other sources of imagery such as Google Earth ™, Nokia Here ™, and georeferenced field photographs acquired by Arnesen et al. (2013) were also used for validation purposes.
A digital elevation model (DEM) obtained by the Shuttle Radar Topographic Mission (SRTM) was used for orthorectifying the SAR scenes. The SRTM DEM was downloaded from the Consortium for Spatial Information (CGIAR – CSI) website, at http://srtm.csi.cgiar.org/, version 4.1. It has 90 m in spatial resolution and ~16 m in vertical accuracy.
Image Processing and classification
Orthorectification was executed using the Radar Specific Model implemented in PCI Geomatica v.10.3 Ortho Engine. Positional errors after orthorectification were under 0.5 pixel, and all images (including Landsat/TM) were georeferenced to the UTM coordinate system and WGS-84 datum, using an USGS Orthorectified ETM+ Geocover image as reference (http://glcfapp.glcf.umd.edu:8080/esdi/).
The enhanced Frost adaptive filter was applied to all SAR bands to reduce the speckle effect, using a single pass of a 3x3 window. All SAR scenes were converted from 16 to 8 bits after filtering to allow the use of the IHS fusion method. For this conversion, the SAR image histogram for both HH and HV channels was truncated between 0 and 1, with values linearly redistributed to 0 – 255. The 0-1 range contained about 99% of the original image information.
For optical data, a Principal Component Analysis (PCA) was applied to synthesize the information contained on the six original TM bands, optimizing the IHS fusion (Pohl and Genderen 1998). The first three PCA components were fused with the RS2 imagery using the IHS fusion method. This method starts by transforming an RGB color composite into
Intensity, Hue and Saturation images. The fusion is then obtained by (1) replacing the original intensity image by the SAR image, after a statistical transformation to match its mean and variance to the original intensity band, (2) resampling both hue and saturation images to match the SAR pixel size and (3) applying the reverse IHS to RGB transformation. The TM - PCA images were fused separately to the HH and HV polarizations of the Radarsat-2 scene, using the IHS method as implemented in ENVI 4.7.
All images were segmented using the multi-resolution algorithm implemented on eCognition 8.0 (Benz et al. 2004). Each group of images (TM only; SAR only; fused images and multi-sensor image set) used optimized segmentation parameters in order to maximize object detection and feature extraction in each group. For the TM only dataset, a scale parameter of 15 was used; the SAR only used a scale parameter of 40; the fusion dataset used a scale parameter of 35 and a scale parameter of 20 was used for the multi-sensor dataset. All datasets used 0.1 and 0.5 for shape and compactness parameters, respectively.
Land Cover Classification of Lago Grande de Curuai Floodplain (Amazon, Brazil) Using Multi-Sensor and Image Fusion Techniques
ACTA
AMAZONICA
Seven land-cover classes were defined: (1) Floodable
Forest, comprising tree vegetation growing on higher
floodplain areas and subject to shorter seasonal flooding periods; (2) Upland Forest, comprising tree vegetation not subjected to seasonal flooding; (3) Shrubs, comprising shrubs and early succession arboreal vegetation, with sparse canopies and low height, subject to longer seasonal flooding;
(4) Emergent Macrophytes, comprising herbaceous plant
communities dominated by palustrine grasses, with high biomass and density levels, subjected to longer seasonal flooding periods; (5) Floating Macrophytes, comprising free floating herbaceous vegetation with lower biomass and/or sparse canopies; (6) Bare Soil, comprising areas of bare soil, sparse grasses or exposed lake substrate; and (7) Open Water, comprising free water surfaces.
After segmentation, training samples were collected from the resulting objects, for each image set and land cover class. Location and extent of the training samples were kept as similar as possible for all four image groups, varying only slightly in their relative area due to differences in segmentation results and to the spatial extent of each class on the scenes.
The object features used for training the classification algorithm were the median pixel value per object and texture attributes. The standard deviation of pixel values was not chosen as it is strongly correlated with texture attributes, and the median was chosen instead of the mean because of its lesser sensitivity to extreme pixel values. The texture attributes used in the present study were calculated using the eCognition 8.0 implementation of Haralick textures, in turn based on Haralick et al. (1973).
The texture attributes used on this paper were GLCM Homogeneity, GLCM Dissimilarity, GLCM Entropy and
GLCM Correlation, calculated on all directions.
Given the dynamics of the várzea landscape over the three years spanned between TM and RS2 image acquisitions, transient classes such as Emergent Macrophytes and Floating
Macrophytes varied spatially between the two set of images.
The mismatches were therefore manually excluded from all image sets, to avoid allocation and proportion errors when evaluating the classifications.
The Weka 3.6.10 data-mining software (http://www. cs.waikato.ac.nz/ml/weka/) was used to build the decision trees, using the J.48 algorithm. This is a non-parametric algorithm based on information gain. Please refer to Witten and Frank (2005) for a detailed description of the algorithm. To assess classification accuracies, 420 random validation points were used to calculate the kappa index of agreement (Congalton 1991) and the recently proposed quantity disagreement (QD) and allocation disagreement (AD) indexes (Pontius and Millones 2011). QD measures the
mean percentage of super- or sub-estimated class areas and AD measures the percentage of misplaced objects in each mapped class. For further details on these indexes, please refer to Pontius and Millones (2011).
RESULTS
Overall Classification
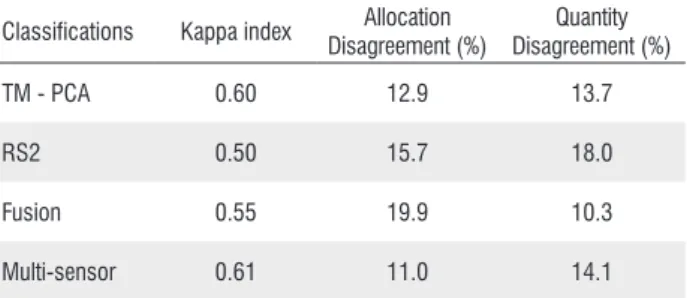
The highest kappa (K) values and smallest allocation disagreement (AD) values were obtained by TM-PCA and multi-sensor classifications (0.6 and 0.61; 12.9% and 11% respectively), followed by fusion classification (0.55 and 19.9%) and SAR-only classification (0.5 and 15.7%) (Table 1 and Figure 2).
The fusion between RS2 and TM-PCA increased AD from 12.9% to 19.9% but reduced quantity disagreement (QD) (13.7% to 10.3%). However, QD can be unrealistically lowered if allocation errors compensate each other (Pontius and Millones 2011). Therefore, we do not believe that image fusion improved classification results. Multi-sensor classification, on the other hand, improved both AD and QD, compared to optical-only and SAR-only classifications. AD was slightly improved (12.9 to 11%) and QD did not change in relation to the TM-PCA classification, while AD and QD were both improved from the SAR-only classification, from 15.7 to 11% and from 18 to 14.1%, respectively.
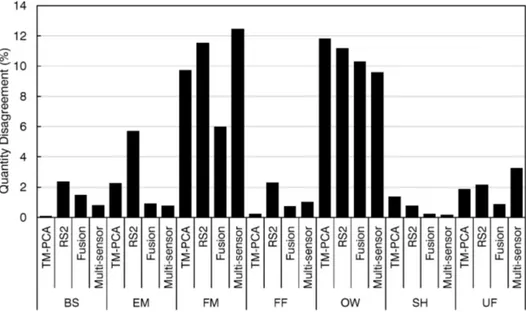
Accuracy assessment per class
There were large overlaps among all vegetation classes on the TM-PCA classification, and between Shrubs and Emergent
Macrophytes or Floodable Forest and Upland Forest on the
RS2 classification. The multi-sensor approach was able to decrease the overall AD for the Upland Forest,Floodable Forest
and Floating Macrophytes classes, the QD for the Emergent
Macrophytes class and both AD and QD for Shrubs, when
compared to the RS2 and TM-PCA classifications. The fusion-based classification, on the other hand, increased AD for almost all vegetation classes, with the exception of Shrubs
(Figures 3 and 4 and Tables 2 to 5).
Classifications Kappa index Allocation
Disagreement (%)
Quantity Disagreement (%)
TM - PCA 0.60 12.9 13.7
RS2 0.50 15.7 18.0
Fusion 0.55 19.9 10.3
Multi-sensor 0.61 11.0 14.1
Figure 2. Land cover classification results for Lago Grande de Curuai. The blank polygons are areas excluded due to temporal differences in land cover between TM and RS2 image acquisitions. The classifications are (A) TM-PCA; (B) RS2; (C) Fusion and (D) Multi-sensor. BS: Bare Soil; EM: Emergent Macrophytes; FM: Floating Macrophytes; FF: Floodable Forest; OW: Open Water; SH: Shrubs; UF: Upland Forest. Please refer to the online version of this paper for the colored version of this figure.
Land Cover Classification of Lago Grande de Curuai Floodplain (Amazon, Brazil) Using Multi-Sensor and Image Fusion Techniques
ACTA
AMAZONICA
Table 2. Confusion matrix for the optical-based (TM-PCA) classification of land cover in the Lago Grande de Curuai floodplain (Amazon, Brazil). BS: Bare Soil; EM: Emergent Macrophytes; FM: Floating Macrophytes; FF: Floodable Forest; OW: Open Water; SH: Shrubs; UF: Upland Forest.
Reference
Estimate
TM - PCA BS EM FM FF OW SH UF Total
BS 40 1 3 0 0 0 4 48
EM 0 32 11 5 0 2 0 50
FM 1 3 41 5 4 0 0 54
FF 0 16 9 21 0 16 2 64
OW 0 1 11 3 63 1 0 79
SH 1 6 0 15 0 37 1 60
UF 4 1 1 8 1 2 48 65
Total 46 60 76 57 68 58 55 420
Table 3. Confusion matrix for the SAR based (RS2) classification) of land cover in the Lago Grande de Curuai floodplain (Amazon, Brazil). BS: Bare Soil; EM: Emergent Macrophytes; FM: Floating Macrophytes; FF: Floodable Forest; OW: Open Water; SH: Shrubs; UF: Upland Forest.
Reference
Estimate
RS2 BS EM FM FF OW SH UF Total
BS 30 9 10 4 2 3 14 72
EM 0 10 1 4 2 10 2 29
FM 1 1 36 0 1 1 0 40
FF 3 21 8 23 0 17 8 80
OW 0 2 11 2 63 0 0 78
SH 2 13 4 9 0 25 2 55
UF 10 4 6 14 0 3 29 66
Total 46 60 76 56 68 59 55 420
Table 4. Confusion matrix for the fusion-based (TM-PCA + RS2) classification of land cover in the Lago Grande de Curuai floodplain (Amazon, Brazil). BS: Bare Soil; EM: Emergent Macrophytes; FM: Floating Macrophytes; FF: Floodable Forest; OW: Open Water; SH: Shrubs; UF: Upland Forest.
Reference
Estimate
Fusion BS EM FM FF OW SH UF Total
BS 32 0 0 4 1 0 10 43
EM 0 14 2 27 2 7 7 46
FM 1 1 44 22 7 0 2 56
FF 3 10 0 29 2 3 10 112
OW 0 0 11 3 55 0 0 66
SH 2 16 0 9 0 24 4 29
UF 6 1 0 7 0 1 41 68
Total 46 60 76 57 68 58 55 420
Table 5. Confusion matrix for the multi-sensor (TM-PCA + RS2) classification of land cover in the Lago Grande de Curuai floodplain (Amazon, Brazil). BS: Bare Soil; EM: Emergent Macrophytes; FM: Floating Macrophytes; FF: Floodable Forest; OW: Open Water; SH: Shrubs; UF: Upland Forest.
Reference
Estimate
Multi-sensor BS EM FM FF OW SH UF Total
BS 39 1 1 0 0 0 1 42
EM 1 34 12 3 0 2 0 52
FM 0 1 33 2 1 1 0 38
FF 0 20 13 26 14 0 1 74
OW 0 0 12 2 66 1 0 81
SH 0 4 0 17 0 37 0 58
UF 6 0 5 7 1 3 53 75
Total 46 60 76 57 82 44 55 420
DISCUSSION
Overall classification
The better performance of the multi-sensor classification method over the fusion-based method can be attributed to the nature of the classification process. While fusion methods necessarily combine both the strengths and weaknesses of each image source into the final product, the multi-sensor approach allows the classification algorithm to choose, at each node of the decision tree, the image with the best capacity for class discrimination.
Wetland classification results from either multi-sensor or image fusion methods have been evaluated in the literature for tropical forested wetlands (Bwangoy et al. 2010; Silva et al.
2010; Rodrigues et al. 2011) and grass-dominated temperate wetlands (Li and Chen 2005; Castañeda and Ducrot 2009). For tropical environments, Silva et al. (2010) and Bwangoy
et al. (2010) reported good results using the multi-sensor
method, the first studying a wetland adjacent to our study site, in the Amazon várzea, and the second mapping forested wetlands in the Congo River basin. Rodrigues et al. (2011), on the other hand, reported good results using an image fusion approach to classify mangrove wetlands in the Amazon delta. The success of each method can likely be attributed to differences in vegetation structure and hydrological patterns among study sites, with an emphasis on achieving good results from multi-sensor classification of river floodplains. For grass-dominated temperate wetlands, however, fusion-based classification achieved the most accurate classifications, while the combination of SAR and optical data using a multi-sensor approach worsened classification accuracies (Li and Chen 2005; Castañeda and Ducrot 2009). Again, these diverging results may be linked to the different vegetation physiognomies, which will interact differently with the electromagnetic spectrum (Henderson and Lewis 2008). Furthermore, despite all using object-based classifications, each study has used a different classification algorithm, hindering direct comparisons between studies.
Accuracy assessment per class
The increased confusion between vegetation classes in the TM-PCA classification occurred mainly due (1) the limited penetration power of optical wavelengths on dense plant canopies, such as Shrubs, Floodable Forests and Upland
Forests, and (2) the spectral similarities between flooded and
non-flooded vegetation (Silva et al. 2008). The confusion between Floating Macrophytes and Open Water classes can also be explained by their spectral similarity: under low biomass/density conditions, the floating vegetation is sparsely distributed and the exposed water surfaces strongly reduce the radiometric signal for the TM-PCA images (Silva et al. 2008).
The errors observed on RS2-based classifications can be partially explained by (a) the difficulty in generating proper image objects though segmentation, given the effects of radar speckle and (b) overlapping class responses, due the C-band signal saturation on dense vegetation canopies, mainly observed for Floodable Forest and Upland Forest classes(Hess
et al. 1995; Silva et al. 2010). In addition, SAR backscattering
can be increased by Bragg scattering on windy water surfaces, reaching similar levels to the ranges observed by Floating
Macrophytes, increasing the confusion between open water
and vegetation classes.
Multi-sensor classification reduced the confusion between vegetation classes by being able to choose, at each node of the decision tree, the image/band with best class separability. For example, the confusion between flooded vegetation classes (mainly Shrubs and Floodable Forest) and Upland Forest was decreased by choosing the SAR image, where the increased occurrence of double-bounce backscattering on flooded vegetation best separates it from non-flooded forest (Hess
et al. 1995). On the other hand, in situations where the
C-band SAR has poor separability (such as between Emergent
Macrophytes and Shrubs), the PCA-TM image offered better
separability. On fused images, however, all images are merged into a new set of synthetic images, limiting opportunities for reducing confusion among classes.
CONCLUSIONS
We have shown that the combination of optical and SAR images using a multi-sensor approach yielded the highest accuracy indexes and was able to overcome some of the specific limitations of each type of image. Although the fusion-based classification yielded a higher apparent accuracy for area estimates (smallest quantity disagreement), this accuracy was biased by error compensation between allocation errors for different classes. Therefore, we conclude that multi-sensor classification is the best approach for combining optical and SAR data to classify land use and land cover in Amazon várzeas, and support previous studies in suggesting that multi-sensor classification may be the best approach to map tropical forested wetlands.
ACKNOWLEDGEMENTS
Land Cover Classification of Lago Grande de Curuai Floodplain (Amazon, Brazil) Using Multi-Sensor and Image Fusion Techniques
ACTA
AMAZONICA
REFERENCES
Arnesen, A. S.; Silva, T. S. F.; Hess, L. L.; Novo, E. M. L. M.; Rudorff, C. M.; Chapman, B. D.; McDonald, K. C. 2013. Monitoring flood extent in the lower Amazon River floodplain using ALOS/PALSAR
ScanSAR images. Remote Sensing of Environment, 130: 51–61.
Benz, U. C.; Hofmann, P.; Willhauck, G.; Lingenfelder, I.; Heynen, M. 2004. Multi-resolution, object-oriented fuzzy analysis of
remote sensing data for GIS-ready information. ISPRS Journal
of Photogrammetry and Remote Sensing, 58: 239–258. Blaschke, T. 2010. Object Based Image Analysis for Remote Sensing.
ISPRS Journal of Photogrammetry and Remote Sensing, 65: 2–16. Bwangoy, J.-R. B.; Hansen, M. C.; Roy, D. P.; Grandi, G.; Justice, C. O. 2010. Wetland mapping in the Congo Basin using optical and radar remotely sensed data and derived topographical indices.
Remote Sensing of Environment, 114: 73–86.
Castañeda, C.; Ducrot, D. 2009. Land cover mapping of wetland areas in an agricultural landscape using SAR and Landsat
imagery. Journal of Environmental Management, 90: 2270–2277.
Congalton, R. G. 1991.A review of assessing the accuracy of
classifications of remotely sensed data. Remote Sensing of
Environment, 37:35–46.
Evans, T. L.; Costa, M. 2013. Landcover classification of the Lower Nhecolândia subregion of the Brazilian Pantanal wetlands using ALOS/PALSAR, RADARSAT-2 and ENVISAT/ASAR imagery.
Remote Sensing of Environment, 128: 118–137.
Evans, T. L.; Costa, M.; Telmer, K.; Silva, T. S. F. 2010. Using ALOS/PALSAR and RADARSAT-2 to map land cover and
seasonal inundation in the Brazilian Pantanal. IEEE Journal of
Selected Topics in Applied Earth Observations and Remote Sensing, 3: 560–575.
Haralick, R. M.; Shanmugam, K.; Dinstein, I. 1973. Textural
Features for Image Classification. IEEE Transactions on Systems,
Man, and Cybernetics, 3: 610–621.
Henderson, F. M.; Lewis, A. J. 2008. Radar detection of wetland
ecosystems: a review. International Journal of Remote Sensing,
29: 5809–5835.
Hess, L. L.; Melack, J. M.; Filoso, S.; Wang, Y. 1995.Delineation
of inundated area and vegetation along the Amazon floodplain
with the SIR-C synthetic aperture radar. IEEE Transactions on
Geoscience and Remote Sensing, 33: 893–904.
Hess, L. L.; Melack, J. M.; Novo, E. M. L. M.; Barbosa, C. C. F.; Gastil, M. 2003. Dual-season mapping of wetland inundation
and vegetation for the central Amazon basin. Remote Sensing of
Environment, 87: 404–428.
Junk, W. J. 1997. The Central Amazon Floodplain: Ecology of a Pulsing
System. Springer, Verlag, 1997, 548p.
Li, J.; Chen, W. 2005. A rule-based method for mapping Canada’s
wetlands using optical, radar and DEM data. International
Journal of Remote Sensing, 26: 5051–5069.
Luo, R. C.; Yih, C. C.; Su, L.K. 2002. Multisensor Fusion and Integration: Approaches, Applications, and Future Research
Directions. IEEE Sensors Journal, 2:107–119.
Martinez, J. M.; Le Toan, T. 2007. Mapping of flood dynamics and spatial distribution of vegetation in the Amazon floodplain
using multitemporal SAR data. Remote Sensing of Environment,
108: 209–223.
Melack, J. M.; Hess, L. L. 2007. Remote Sensing of the Distribution and Extent of Wetlands in the Amazon Basin. In: Junk, W. J.; Piedade, M. T. F.; Wittmann, F.; Schöngart, J.; Parolin, P. (Ed.).
Amazonian Floodplain Forests: Ecophysiology, Biodiversity and
Sustainable Management. Springer, Verlag, p.40-60.
Mitsch, W. J.; Gosselink, J. G. 2007.Wetlands. 4a ed. John Wiley
& Sons, New York, 2007, 600p.
Pohl, C.; Genderen, J. L. V. 1998. Multisensor image fusion in remote sensing: concepts, methods and applications.
International Journal of Remote Sensing, 19: 823–854.
Pontius, R.G. JR.; Millones, M. 2011.Death to Kappa: birth
of quantity disagreement and allocation disagreement for
accuracy assessment. International Journal of Remote Sensing,
32: 4407–4429.
Rodrigues, S. W. P.; Souza-Filho, P. W. M. 2011. Use of Multi-Sensor Data to Identify and Map Tropical Coastal Wetlands in the
Amazon of Northern Brazil. Wetlands, 31: 11–23.
Santiago, F. F. D.; Kovacs, J. M.; Lafrance, P. 2013. An object-oriented classification method for mapping mangroves in Guinea, West Africa, using multipolarized ALOS PALSAR L-band data.
International Journal of Remote Sensing, 34: 563–586.
Sartori, L. R.; Imai, N. N.; Mura, J. C.; Novo, E. M. L. M.; Silva, T. S. F. 2011. Mapping Macrophyte Species in the Amazon Floodplain
Wetlands Using Fully Polarimetric ALOS/PALSAR Data. IEEE
Transactions on Geoscience and Remote Sensing, 49: 4717–4728. Silva, T. S. F.; Costa, M. P. F.; Melack, J. M.; Novo, E. M. L. M. 2008. Remote sensing of aquatic vegetation: theory and applications.
Environmental Monitoring and Assessment, 140: 131 – 145. Silva, T. S. F.; Costa, M. P. F.; Melack, J. M. 2010. Spatial and
temporal variability of macrophyte cover and productivity in the
eastern Amazon floodplain: A remote sensing approach. Remote
Sensing of Environment, 114: 1998-2010.
Touzi, R.; Deschamps, A.; Rother, G. 2009. Phase of Target Scattering for Wetland Characterization Using Polarimetric
C-Band SAR. IEEE Transactions on Geoscience and Remote
Sensing, 47: 3241–3261.
Witten, I. H.; Frank, E. 2005. Data Mining – Practical Machine
Learning Tools and Techniques. 2nd. ed. Elsevier, San Francisco, 2005, 525p.
Zhang, J. 2010. Multi-source remote sensing data fusion: status and
trends. InternationalJournal of Image and Data Fusion, 1: 5–24.
Zhu, L.; Tateishi, R. 2006. Fusion of multisensor multitemporal
satellite data for land cover mapping. International Journal of
Remote Sensing, 27: 903–918.