Anelasticity of Phase Transitions and Magnetostriction in Fe-(27-28%)Ga Alloys
Igor Stanislavovich Golovina* , Valeria Valerievna Palachevaa, Aliakbar Emdadia, Daniele Marib , Alexei Heintzb, Аnatoliy Mikhailovich Balagurovc, Ivan Anatolievich Bobrikovc
Received: October 05, 2017; Revised: February 21, 2018; Accepted: April 20, 2018
Several aspects of anelastic behavior of Fe-(27-28%)Ga-Tb alloys are considered in this paper: (i) the phase transitions from a metastable to an equilibrium phase and phase transitions between equilibrium phases at higher temperatures in as cast alloys, (ii) the nature of corresponding three
transient anelastic effects, (iii) the formation of an intrinsic composite microstructure with a different ratio between the bcc-derivative metastable and fcc-derivative equilibrium phases that have different magnetostriction and the effect of alloys doping by Tb to stabilize the metastable phase with high
positive values of magnetostriction.
Keywords: Fe-Ga, mechanical spectroscopy, transient effects, magnetostriction, neutron diffraction, phase transitions.
*e-mail: [email protected]
1. Introduction
Fe-Ga alloys exhibit attractive functional properties, such as magnetostriction that can be varied from giant positive values
to negative values including zero magnetostriction1,2. This
effect relates to a complex phase transformation sequences in
the Fe-27%Ga alloys. Phase transitions in Fe3Ga-type alloys
were first studied by X-ray diffraction3-5, and more recently
by in situ neutron diffraction2,6,7 to characterize the bulk
alloy. Different ratios between metastable and equilibrium phases characterized by magnetostriction values of different signs vary the magnetostriction values of the alloy, λS, from
positive to negative, including the value of λS = 0
2. The phase
transition from metastable D03 to stable L12 is accompanied
with a well-pronounced transient anelas tic effect at about
450-550°C depending on the heating rate8. Anelastic effects
for phase transitions at higher temperatures have as yet not been reported in the literature. Doping Fe-Ga with rare earth elements enhances magnetostriction in Fe-(17-19)Ga alloys by creating local inhomogeneities9-11 and stabilizes
the metastable bcc-derivative phase in as cast Fe-27Ga alloys by preventing L12 phase nucleation on the D03 grain boundaries7,12-14. The structure of metastable Fe-27Ga type
alloys before their transition to equilibrium L12 phase may show several metastable phases (A2, B2, D03), the size of which, as reported in the literature, can be from nano (e.g.15)
to macro domains.
In this paper, we studied the following phenomena: (i)
transient internal friction peaks accompanied by three
first-order phase transitions, namely: D03 to L12, L12 to D019, and D019 to A2, (ii) influence of doping by Tb on these transitions, (ii) tailoring magnetostriction by isothermal phase transitions in Fe-27%Ga alloys.
2. Methods
Several Fe-27at.%Ga and Fe-27.4at.%Ga-Tb alloys were
produced by rapid solidification in a copper mold using pure
Fe and Ga by arc melting under the protection of a high-purity inert argon gas using an Arc 200 mini vacuum furnace (Arcast Inc, USA). In this paper, all the compositions are given in atomic percent. We used energy dispersive spectroscopy to measure the chemical compositions of the cast buttons with ±0.2% accuracy as 27.4 to 27.8%Ga in binary alloys and Fe-27.4%Ga-0.3%Tb.
The phase transitions were characterized by in situ
neutron diffraction measured with a high-resolution Fourier diffractometer (HRFD)16 at the IBR-2 pulsed reactor in JINR
(Dubna). The tests were performed on rectangular samples
with a size of 4×8×40 mm. The acquisition time for each diffraction pattern was 1 min. Heating of the samples was carried out in a specialized furnace (ILL standard) with
vanadium screens up to 850°C at a temperature rate of 1 or 2 K/min. Further details can be found in Refs.2,6.
aNational University of Science and Technology MISiS, Moscow, Russia bEcole Polytechnique Fédérale de Lausanne, Lausanne, Suisse
The internal friction (IF, or Q-1) was obtained by
measuring the phase lag φ between the applied cyclic stress
and the resulting strain: σ = σ0cos(ωt) and ε = ε0cos(ωt+φ), correspondingly. ω = 2πf and φ is the phase or the loss angle.
It can be demonstrated that IF = tan(φ) if φ is small. The
measurements were performed by two types of equipment: 1. An inversed torsion pendulum working in a
forced mode. Most of the spectra were recorded
at a frequency of 0.02 Hz to enhance the peak
amplitude in case of phase transformations. The
strain amplitude of the oscillations was 5×10⁻⁵.
Additionally, the spectra were also recorded at
0.3 and 1 Hz. The sample size was 1×4×30 mm
between the clamps. The temperature was recorded by a thermocouple inserted in the lower clamp and touching the specimen. Therefore, a relatively good accuracy (± 2 K) can be expected. The heating and cooling rate was 1K/min. All the measurements
were performed under a vacuum better than 5×10⁻⁵
mbar. Each cycle presented here was confirmed at
least once by another measurement in the same pendulum and sometimes even in another apparatus.
2. A dynamical mechanical analyzer DMA Q800 TA
Instruments. The measurements were conducted as a function of temperature between 0 and 600 °C using forced bending single cantilever vibrations
in a range between 0.1 and 30 Hz with ε0 = 7×10 -5
with a heating and cooling rate of 1 or 2 K/min. A DualScope C26 magnetic force microscope, MFM
(DME Company, Copenhagen, Denmark) was used to obtain
the magnetic force gradient image with a lift height of 250
nm and a high-moment Co-coated tip magnetized normal
to the sample surface. The magnetostriction was measured using a hand-made experimental setup based on a strain gauge
method up to a saturated magnetic field value of 350 kA/m.
3. Results
3.1. Anelastic effects due to phase transitions
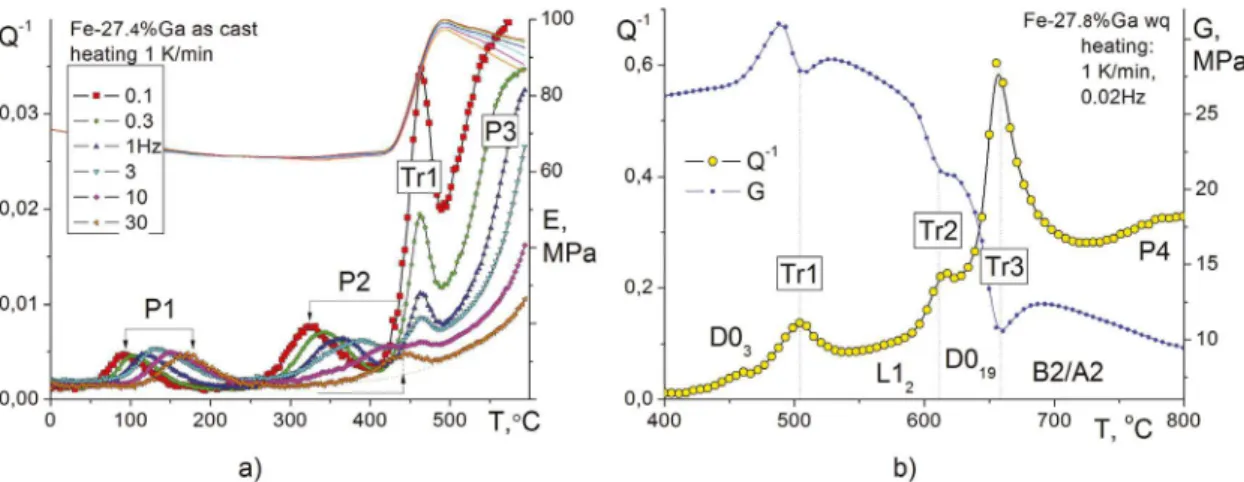
Several internal friction (IF) peaks of different nature
can be observed at Temperature Dependent IF (TDIF) curves for the Fe-27Ga-type alloys. At least three of them
are Debye-type thermally activated peaks (P1, P2, P3, P4) and three transient effects (Tr1, Tr2, Tr3) (Fig. 1).
The activation parameters for P1 and P2 peaks were
collected in our previous papers, e.g.8,17, and assigned to
Snoek-type and Zener relaxations.
In this paper, we focus on transient effects: in situ neutron
diffractions were run with practically the same heating rate as mechanical spectroscopy to define phase transitions in the
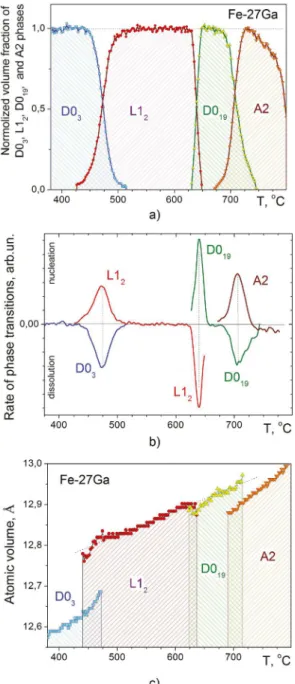
alloys (Fig. 2). Figure 2 shows intervals for phase transitions, phase transition reaction rates, and atomic volume of the phases in Fe-27Ga. The D03 → L12 transition is accompanied by a pronounced jump in the atomic volume, the D019 →
А2 transition is also accompanied with a jump in the atomic volume, whereas this effect is negligibly small in the case of
the L12 → D019 transition. The change in the atomic volume in the range of the co-existing phases (D03 and L12 or D019
and А2) leads to an increase in micro stresses in the alloy.
It is important to note that each time the transient IF
peak is associated with a modulus dip. The drop in the
elastic shear modulus is due to a strong coupling between the stress and the anelastic strain: similarly to martensitic transformation, phase interfaces in Fe-Ga alloys propagate
during the transformation. Misfit dislocations migration
may also contribute. From the temperature of the modulus dip and considering the precision of the measurements, we cannot state that some precursor soft mode activates
the transformation. Below we consider anelastic effects
accompanied by these phase transitions.
Figure 2. Phase transitions in the Fe-27.0Ga (a) samples heated with a rate of 2 K/min obtained by normalizing the intensities of the characteristic diffraction peaks at their maximum values (reduction of the A2 phase above 700°C is associated with a gradual decrease in the intensity of the magnetic contribution to the peaks); (b) First derivatives of the above curves-the rate of the phase transitions-illustrate the rate of growth and the dissolution of different phases. (c) Atomic volumes of the phases in the same temperature range.
3.1.1. The D03 to L12 transition (Tr1) and tailoring
magnetostriction of the alloy
The relatively low-temperature D03 to L12 transition (Tr1) was mainly studied using DMA equipment with
varying frequencies from 0.1 to 30Hz. An example of these
tests is given in Fig. 1a. The dependence of the Tr1-peak
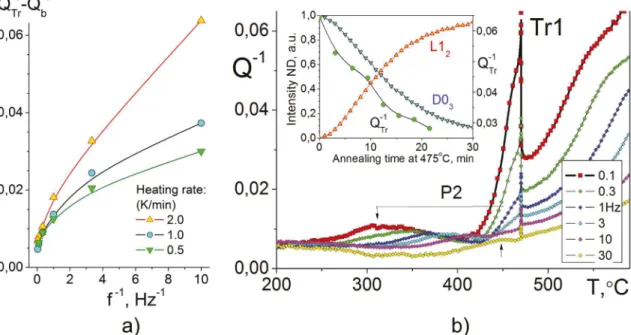
height on frequency and the heating rate is plotted in Fig. 3a. The dependence:
(1)
where ω = 2πf is the frequency, (dn/dT) is the volume
fraction of the transformed phase during the transition with
an increase in T - temperature, J is compliance, k and m are coefficients where m ≈ 0.45 is typical for a shear
(martensite-like) transition. In contrast with18, no evidence of martensite
or any other phases were detected by our in situ neutron
diffraction tests. Moreover, careful study of the D03 to L12
transition shows that this transition goes through diffusion
controlled disordering D03 to A2 followed by A2 to A1 transition and L12 ordering of the A1 phase2,7. Significant local
stresses that appeared at D03 to L12 transition are strongly anisotropic and the average lattice deformation depends on D03 and L12 phase fraction2: an increase of the volume
fraction of the L12 phase leads to an increase of the stress mainly in the D03 phase, whereas the stress in the L12 phase remains at the same level, which is relatively high from the beginning of the appearance of this phase.
If during the TDIF tests the heating is interrupted at
the temperature of the Tr1-peak maximum, i.e., at about
470-475°C (Fig. 3b), the IF level decreases with holding
time. A similar effect, which is slower, occurs in NiTi- or
CuAl-based alloys with a thermoelastic martensite transition19.
The isothermal in situ neutron diffraction tests carried out at the same temperature demonstrate practically the same rate for the D03 to L12 transition rate (see inset in Fig. 3b). Thus,
the Tr1-peak height is, indeed, proportional to the transition
rate for the D03 to L12 reaction, as predicted by Eq. (1), both at instant heating and isothermal annealing.
Isothermal annealing in the range of the D03 to L12 transition leads to another important consequence. Isothermal
heat treatment offers an excellent opportunity to vary the
magnetostriction values in the alloys by interrupting the
transition to obtain a different ratio between the phases.
The metastable D03 and the equilibrium L12 phase are
both ferromagnetic phases, but with a different sign of magnetostriction. The difference in the ratio between these
phases in the same sample, as a result of incomplete D03 to L12 transition, may change magnetostriction of the sample from positive (in D03) to negative (in L12) values. This effect was recently reported by Chinese researchers1,20 and by the
present authors2,7.
The domain wall motion of the D03 phase with positive magnetostriction results in elongation up to the maximum value
at lower magnetic fields. With an increase in the magnetic field,
the L12 phase with stronger magneto-crystalline anisotropy reduces magnetostriction and contracts the sample (Fig. 4).
Annealing at 400 and 435°C leads to different dispersion
,
Q
Tr1J
k
dT
dn T
m~
=
-Figure 3. a) The Tr1-peak height as a function of inverse frequency for three different heating rates; b) TDIF curve with interrupted heating at 470°C. Inset: The decrease of the Tr1 peak as a function of time of isothermal annealing (green circles) and intensities of neutron diffraction lines from decaying D03 phase (blue down triangles) and growing L12 phase (red up triangles) under the same conditions.
of the L12 phase, which nuclei on the grain boundaries of the D03 phase. One can observe a different sensitivity of
magnetostriction in the samples with differently dispersed
L12 phase to the magnetic field. Both the maximum positive magnetostriction (red arrows) due to contribution of the D03
phase in low fields and the leveling-off magnetostriction values at higher magnetic field (black arrows) due to the
compensating contribution of the L12 phase with negative
magnetostriction occur at lower values of the applied field
in the sample annealed at 400°C with a more dispersed L12 phase as compared with the samples annealed at 500°C.
Figure 4. Magnetostriction vs applied field and different dispersion of the L12 (red color) phase at 400 (fine) and 475/500°C (coarse grains).
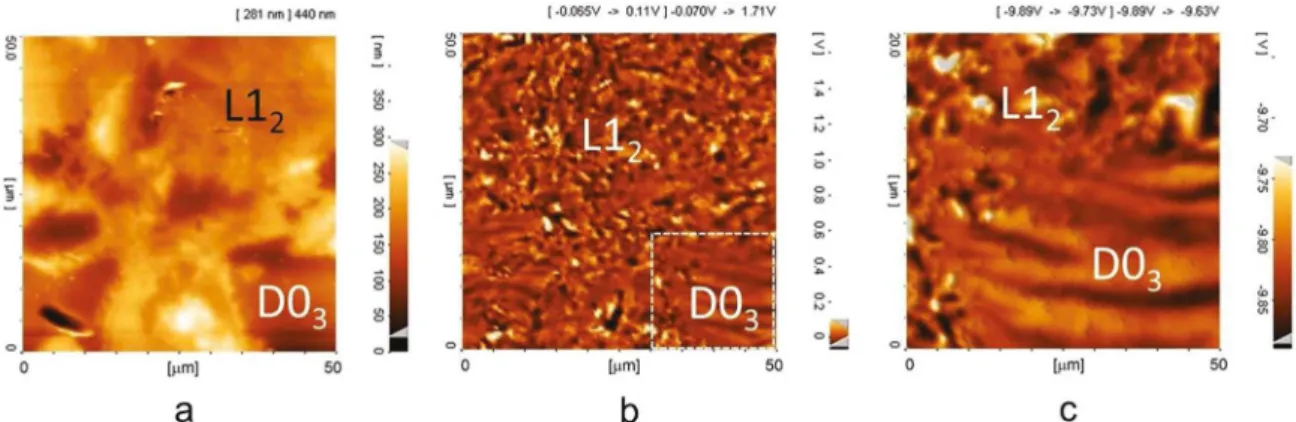
The magnetic domain structure in the Fe-27.8Ga sample annealed at 400 °C for 600 min was studied by MFM. The magnetic domain structure of the D03 and L12 phases is
rather different: the L12 phase contains random and irregular
magnetic domains, whereas the D03 phase has plate-like magnetic domains with a distinct magnetic substructure. Fig. 5a and b display the topography and the MFM images in a
different region of the sample. Fig. 5c shows the enlarged region of the marked area (white rectangle), in Fig. 5b with
irregular magnetic domain patterns in the L12 phase and a large (width: 3-5 µm, length: about 40 µm) well-aligned stripe domains are observed in the D03 phase. The domain walls in the well-aligned stripe domains are more easily movable as compared to the irregular magnetic domains. 3.1.2. The L12 to D019 transition
According to the in situ neutron diffraction, the
phase transition between two closed packed phases is
not accompanied by a change in the atomic volume and a pronounced increase in internal stresses. Moreover, heating of the sample above the D03 to L12 transition leads to a smooth decrease in microstresses in the sample21. Thus,
most probably, the IF peak (Tr2) in the case of the L12 →
D019 (or fcc → hcp) phase transition is due to a long-range
motion of the Shockley dislocation, which assists transition between these two closed packed phases. In accordance with our neutron diffraction data, the L12 → D019 transition also
Figure 5. Topography (a), low magnification MFM (b), and high magnification MFM (c) images of the Fe-27.8Ga sample annealed at 400 °C for 600 min showing D03 (darker contrast) and L12 (brighter contrast) phases.
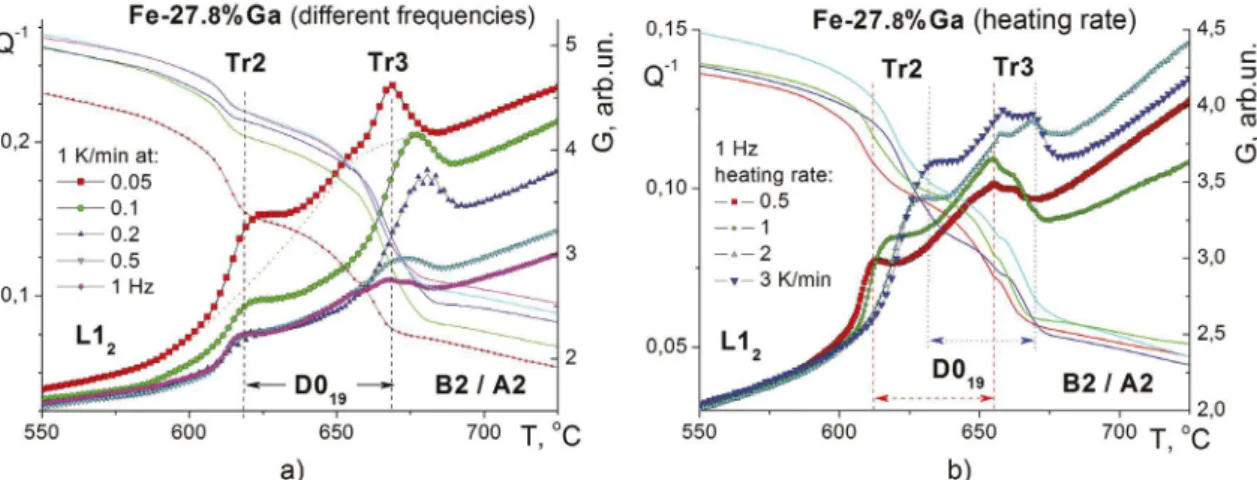
We carried out several tests with five frequencies (Fig.
6a) and four heating rates (Fig. 6b) in several subsequent
runs, with the peak height changing roughly in agreement with Eq. (1). The effect of the frequency on the transient component of the martensitic transition peak for fcc - hcp
transition in pure Co was studied by Bidaux et al.22. They
demonstrated that the main (transient) component of internal
friction must depend on Ṫ/ωσ23. An increase in the heating
rate expectably leads to a shift of these diffusion controlled
phase transitions to a higher temperature: the red dash lines for 0.5 K/min and the blue dot lines for 3 K/min show the range of existence of D019 phase in Fig. 6b.
3.1.3. The D019 to A2 transition
The effect of this first-order phase transition is similar to that of discussed in section 3.1.2. Here, we can only specify
that it is the D019 → B2 → A2 transition. According to the in situ neutron diffraction study, if the heating rate is 2 K/
min, there is not enough time for the B2 → A2 reaction,
whereas in the case of heating with a rate of 1 K/min, the
neutron diffraction detects weak B2 ordering of the A2 phase,
as discussed in6. The Tr3 peak splitting with an increase in
the heating rate (Fig. 6b) can be related to this effect, i.e.,
to the formation of the A2 phase from D019 followed by a
B2 → A2 reaction. This effect needs a more careful study in future. A little IF peak at about 800°C, which probably corresponds to the B2 → A2 reaction that is in agreement
with the equilibrium phase diagram, is not included in Fig. 6. It is important to note that each time the transient IF
peak is associated with a modulus dip. The presence of
a drop in the elastic shear modulus witnesses a strong coupling between the stress and the anelastic strain, which means that, similarly to the martensitic transformation, the phase interfaces propagate during the transformation.
Misfit dislocations migration may also contribute. From the
temperature of the modulus dip and considering the precision of the measurements, we cannot state that some precursor soft mode is activating the transformation.
3.2. Doping Fe-27Ga by Tb
Doping the Fe-27Ga alloys by Tb significantly increases
saturation magnetostriction in the as cast alloy with the D03 structure and slows down the D03 to L12 transition both upon isothermal annealing (Fig. 7a) and instant heating (Fig.
7b). The effect of Tb on magnetostriction is supposed to be caused by enhancing a tetragonal distortion in the nano-sized ordered domains in the bcc derivative lattice. The effect of Tb on the kinetics of the phase transition from bcc to fcc derivative lattice in the Fe-Ga alloys was also confirmed by
neutron scattering13,24. Consequently, Tb smears the D0 3 to
L12 transition, shifts it to higher temperatures and decreases a volume fraction of the L12 phase at constant heating13. As a
result, the Tr1-peak is not well recorded in most of our tests
of the Tb-doped Fe-27Ga alloys. In contrast, the Tr2- and
Tr3-peaks at higher temperatures are well recorded (Fig. 7).
Their temperature positions are in excellent agreement with the L12 to D019 and D019 to B2 transitions similarly to this
effect in the binary alloys. In contrast with the binary alloys,
in the Tb-doped samples, the L12 and D019 phases coexist with the B2 phase (the volume fraction of the B2 phase is
at least twice larger as compared with these closed packed
structures), as the D03 to L12 transition is not complete in the alloys doped by Tb.
The apparent activation parameters of the P3 peak are: H = 2.5 eV, τ0 = 2.5×10
-14, which is typical for a point defect
peak with a broadening parameter ≈1. Our estimation of the activation energy for the P4 peak gives a value of 2.84 eV, which is close to those for Fe-Al-Si (H = 2.7 eV25) and
Fe-Al-Cr (H = 2.3-2.5 eV26, 2.7-2.9 eV27) alloys early reported in25-27
and assigned to dislocation peaks at elevated temperatures. The peak height in all these systems significantly increases when it is measured at cooling (not shown in the figure) as
compared with the measurements at heating. In the ordered alloys, independently of the type of order, the mobility of
the dislocations and the grain boundaries is significantly
Figure 6. Second and third transition peaks in the Fe-27.8Ga sample: a) influence of the frequency of vibrations (from 0.05 to 1 Hz, heating rate 1 K/min), b) influence of the heating rate (from 0.5 to 3 K/min, 1 Hz).
Figure 7. (a) Amount of L12 phase determined by X-ray analysis after isothermal annealing in the Fe-27.4Ga (yellow circles) and in the
Fe-27.4Ga-0.5Tb (red circles) samples; (b) Phase transitions in the Fe-27.4Ga-0.3Tb sample according to the in situ neutron diffraction
(Intersity, left Y-axe) and TDIF (black curve corresponds to right Y-axe).
subsequent cooling, the dislocation and the grain boundary mobility increase, which leads to an increase in damping as compared with the ordered state28. Thus, we can preliminary
attribute the P4 peak to dislocation effects.
4. Conclusions
Three transient IF effects or peaks are recorded in the studied Fe-Ga alloys. These peaks correspond to the D03 →
L12 → D019 → A2 (or B2) phase transitions. The transient
peaks (the best studied is the Tr1 peak of the D03 → L12
transition in the binary alloys) have similar features with
respect to transient peaks in the thermoelastic martensitic
transition. Nevertheless, the in situ neutron diffraction does not support the idea about the appearance of the tetragonal
phases by shear deformation. Moreover, the diffusion controlled disordering-ordering processes are confirmed.
The D03 → L12 and the D019 → A2 (or B2) phase transitions
occur with a change in the atomic volume and a rise of the
local stresses and strains, which lead to these anelastic peaks.
The presence of the dips, i.e., shear modulus minima at the transition means that a softening of the elastic constants in some directions triggers the transition or maybe just a dislocation motion. One should note the pre-transition hardening that is better observed in the pendulum before the D03 → L12 transition. This behaviour is probably due to the metastable nature of the D03 phase.
The L12 → D019 phase transitions are accompanied neither
by a change in the atomic volume nor by a significant rise of the local strains. Most probably, the IF peak in this case is due to a long-range motion of the Shockley dislocation
that assists this transition.
The D03 → L12 phase transition is a unique tool to vary magnetostriction in the Fe-27Ga type alloys. The parameters
of magnetization vs. field curves depend on the dispersion
5. Acknowledgements
I.S.G. is grateful to NUST MISiS (5-100 Program)
for financial support of his participation at ICIFMS-18
conference. Part of this study was carried out within RFBR
project: 18-58-53032. The authors thank Mr. J. Cifre and Dr. V. Cheverikin for help with DMA tests and SEM EBSD work, Dr. E. Bazanova for her critical reading of the manuscript.
6. References
1. Gou J, Liu X, Wu K, Wang Y, Hu S, Zhao H, et al. Tailoring magnetostriction sign of ferromagnetic composite by increasing magnetic field strength. Applied Physics Letters. 2016;109(8):082404.
2. Palacheva VV, Emdadi A, Emeis F, Bobrikov IA, Balagurov AM, Divinski SV, et al. Phase transitions as a tool for tailoring magnetostriction in intrinsic Fe-Ga composites. Acta Materialia. 2017;130:229-239.
3. Lograsso TA, Ross AR, Schlagel DL, Clark AE, Wun-Fogle M. Structural transformations in quenched Fe-Ga alloys. Journal
of Alloys and Compounds. 2003;350(1-2):95-101.
4. Datta S, Huang M, Raim J, Lograsso TA, Flatau AB. Effect of thermal history and gallium content on magneto-mechanical properties of iron-gallium alloys. Materials Science and
Engineering: A. 2006;435-436:221-227.
5. Golovin IS, Palacheva VV, Bazlov AI, Cifre J, Nollmann N, Divinski SV, et al. Diffusionless nature of D03→ L12 transition in
Fe3Ga alloys. Journal of Alloys and Compounds. 2016;656:897-902.
6. Golovin IS, Balagurov AM, Palacheva VV, Bobrikov IA, Zlokazov VB. In-situ neutron diffraction study of bulk phase transitions
in Fe-27Ga alloys. Materials & Design. 2016;98:113-119.
7. Emdadi A, Palacheva VV, Cheverikin VV, Divinski S, Wilde G, Golovin IS. Structure and magnetic properties of Fe-Ga alloys doped by Tb. Journal of Alloys and Compounds. 2018;758:214-223.
8. Golovin IS. Anelasticity of Fe-Ga based alloys. Materials & Design. 2015;88:577-587.
9. Jiang L, Yang J, Hao H, Zhang G, Wu S, Chen Y, et al. Giant enhancement in the magnetostrictive effect of FeGa alloys doped with low levels of terbium. Applied Physics Letters. 2013;102(22):222409.
10. Meng C, Jiang C. Magnetostriction of a Fe83Ga17 single crystal
slightly doped with Tb. Scripta Materialia. 2016;114:9-12.
11. Meng C, Wu Y, Jiang C. Design of high ductility FeGa magnetostrictive alloys: Tb doping and directional solidification.
Materials & Design. 2017;130:183-189.
12. Balagurov AM, Bobrikov IA, Golovin IS, Cheverikin VV, Golovin SA. Stabilization of bcc-born phases in Fe-27Ga by adding Tb: Comparative in situ neutron diffraction study. Materials Letters. 2016;181:67-70.
13. Golovin IS, Balagurov AM, Palacheva VV, Emdadi A, Bobrikov IA, Churyumov AY, et al. Influence of Tb on structure and
properties of Fe-19%Ga and Fe-27%Ga alloys. Journal of
Alloys and Compounds. 2017;707:51-56.
14. Emdadi A, Palacheva VV, Balagurov AM, Bobrikov IA, Cheverikin VV, Cifre J, et al. Tb-dependent phase transitions in Fe-Ga functional alloys. Intermetallics. 2018;93:55-62.
15. Li X, Bao X, Yu X, Gao X. Magnetostriction enhancement of Fe73Ga27 alloy by magnetic field annealing. Scripta Materialia. 2018;147:64-68.
16. Balagurov AM. Scientific Reviews: High-resolution Fourier diffraction at the IBR-2 reactor. Neutron News. 2005;16(3):8-12. 17. Boyer SAE, Gerland M, Rivière A, Cifre J, Palacheva VV,
Mikhaylovskaya AV, et al. Anelasticity of the Fe-Ga alloys in the range of Zener relaxation. Journal of Alloys and Compounds. 2018;730:424-433.
18. Lin YC, Lin CF. Effects of phase transformation on the microstructures and magnetostriction of Fe-Ga and Fe-Ga-Zn ferromagnetic shape memory alloys. Journal of Applied Physics. 2015;117(17):17A920.
19. Schaller R, Fantozzi G, Gremaud G, eds. Mechanical Spectroscopy
Q-1 2001 With Applications to Materials Science. Zurich: Trans Tech Publications; 2001.
20. Ma T, Gou J, Hu S, Liu X, Wu C, Ren S, et al. Highly thermal-stable ferromagnetism by a natural composite. Nature
Communications. 2017;8:13937. DOI: 10.1038/ncomms13937 21. Balagurov AM, Golovin IS, Bobrikov IA, Palacheva VV,
Sumnikov SV, Zlokazov VB. Comparative study of structural phase transitions in bulk and powdered Fe-27Ga alloy by real-time neutron thermodiffractometry. Journal of Applied Crystallography. 2017;50:198-210.
22. Bidaux J, Schaller R, Benoit W. Internal friction associated with the allotropic transformation of cobalt. Journal de Physique
Colloques. 1985;46(C10):C10-601-C10-604.
23. Bidaux JE, Gremaud G, Benoit W. Transient Internal Friction and Martensitic Phase Transformations. Materials Science Forum. 1993;119-121:299-304.
24. Golovin IS, Emdadi A, Balagurov AM, Bobrikov IA, Cifre J, Zadorozhnyy MY, et al. Anelasticity of iron-aluminide Fe3Al
type single and polycrystals. Journal of Alloys and Compounds. 2018;746:660-669.
25. Lambri OA, Pérez-Landazábal JI, Cuello GJ, Cano JA, Recarte V, Siemers C, et al. Mechanical Spectroscopy in Fe-Al-Si alloys at elevated temperatures. Journal of Alloys and Compounds. 2009;468(1-2):96-102.
26. Lambri OA, Pérez-Landazábal JI, Recarte V, Cuello GJ, Golovin IS. Order controlled dislocations and grain boundary mobility in Fe-Al-Cr alloys. Journal of Alloys and Compounds. 2012;537:117-122.
27. Golovin IS, Rivière A. Anelasticity in Fe-Al-Cr alloys at elevated temperatures. Materials Science and Engineering:
A. 2009;521-522:67-72.