Article
Printed in Brazil - ©2018 Sociedade Brasileira de Química
*e-mail: [email protected]
Microemulsion as Sample Preparation for Direct Flame Atomic
Absorption Spectrometry (FAAS) Determination of Total Iron in
Crude and Refined Vegetable Oils
Marília B. Galuch,a Angélica F. B. Piccioli,a Eduardo Sobieski Neto,a Natália Fier,b
Nayara C. Saldana and Edivaldo E. Garcia*,a
aDepartamento de Química and bComplexo de Centrais de Apoio à Pesquisa (COMCAP),
Universidade Estadual de Maringá (UEM), 87020-900 Maringá-PR, Brazil
This work proposed a novel, relatively low-cost and rapid analytical method using microemulsion as sample preparation to determine iron (Fe) in vegetable oils by flame atomic absorption spectrometry technique (FAAS). The vegetable oil microemulsions were obtained by mixing appropriate proportions of the crude and refined vegetable oil, Triton® X-100, 1-propanol
and nitric acid 50% (v v-1). Moreover, an external calibration method was established using aqueous
Fe standards instead of expensive and unstable organometallic standards. The limits of detection and quantification were 0.40 and 1.3 mg kg-1 of oil, respectively. The accuracy was checked by
recovery studies (with recoveries ranging 84-105%) and by Fe determination in digested vegetable oil samples by inductively coupled plasma optical emission spectrometry (ICP OES) as comparative procedure. The proposed analytical method was efficient to determine Fe in crude and refined vegetable oils from various vegetable sources, besides being suitable for routine analyses due to its simplicity.
Keywords: iron, direct analysis, flame atomic absorption spectrometry, microemulsion, vegetable oil
Introduction
Iron (Fe) is one of the most abundant elements in
the earth’s crust.1 This mineral naturally occurs at low
concentrations in vegetable products, such as refined and
crude vegetable oils.2 Vegetable oils can be contaminated
with Fe and other transition metals, during the steps of oil production, transportation and packaging, as well as during
the cultivation of oilseeds with irrigation water,3 fertilizers
and pesticides.4
One of the main issues caused by the presence of trace Fe levels in vegetable oils is the accelerated decrease in both oil quality and oxidative stability, due to catalyzed lipid
oxidation,5 because Fe is one of the most active prooxidant
transition metals in vegetable oils.6 Lipid oxidation leads
to the formation of primary oxidation products, such as hydroperoxides, which are decomposed into secondary oxidation products, such as aldehydes, ketones and alcohols. Secondary oxidation products have negative implications for sensory characteristics (smell and taste,
for example) and shelf life of vegetable oils, as well as for
human health.7 Therefore, monitoring Fe concentration
throughout the manufacturing process of edible vegetable oils is highly desirable from the technological, nutritional, and toxicological perspectives. According to Codex
Alimentarius,8 the recommended maximum acceptable Fe
levels in refined and crude vegetable oils that are presented
in a state for human consumption are 1.5 and 5.0 mg kg-1,
respectively.
Traditional analytical methods to determine trace Fe in vegetable oils are mainly based on the use of instrumental techniques, such as flame atomic absorption spectrometry
(FAAS),9,10 electrothermal atomic absorption spectrometry
(ETAAS),11 inductively coupled plasma optical emission
spectrometry (ICP OES)2,12 and inductively coupled plasma
mass spectrometry (ICP-MS).13 In most instances, these
proposed procedures that directly analyze vegetable oils
for Fe determination.14,15
Direct analysis of vegetable oils for the determination of Fe or other metals is not a simple task. The difficulty is mainly due to the low levels of Fe in vegetable oils, as well
as to the other problems caused by matrix interferences,2,9,16
such as the high organic content and high viscosity
of these matrices.2 These matrix properties can cause
destabilization of the inductively coupled plasmas and flames employed as atomization systems in ICP and FAAS techniques, respectively. Besides, direct analysis may cause problems with the process of introduction of samples into the atomization systems (when graphite furnace atomic absorption spectroscopy (GF AAS) or pneumatic nebulizers
are used).17 Furthermore, the complex matrices of vegetable
oils also hamper the establishment of an appropriate
calibration procedure for their direct analysis.2
Most of the sample treatment procedures applied in the analysis of vegetable oils are based on liquid-liquid
extraction,10 acid extraction,11,18 extraction induced by
emulsion breaking,13 ultrasound assisted extraction,5,6
emulsification19,20 and microemulsification.3 Among these,
microemulsification has emerged as a suitable and promising sample pretreatment procedure for direct analysis of samples
with a high organic content, such as vegetable oils, diesel,21
biodiesel,22-25 lubricating oil,26,27 and fuels.28
Microemulsions can be defined as thermodynamically
stable, optically transparent3,23,25,27-31 and microscopically
homogeneous systems, composed of appropriate amounts of
aqueous and oil phases and surfactant and/or co-surfactant.31,32
These systems have some characteristic properties, such as
low viscosity23,28 and the capacity to solubilize both polar
(aqueous) and nonpolar (oil soluble) substances.31,33 Two
of the main advantages of using microemulsification for sample preparation are associated with its simplicity and the possibility to use aqueous standards for preparing calibration solutions instead of using unstable organometallic
standards.3,24 From the environmental and toxicological
perspectives, the application of microemulsification as a sample preparation method for direct analysis of samples containing high lipid contents is attractive because it allows the direct analysis without requiring any dilution with
relatively toxic organic solvents.24
Therefore, this work proposes a novel routine analytical procedure for the determination of Fe at trace amounts in samples of various crude and refined (edible) vegetable oils, using a microemulsion-based sample preparation method and conventional FAAS as the measurement technique. To the best of our knowledge, this study is the first to propose a sample preparation procedure based on microemulsification for Fe determination
in crude and refined vegetable oil samples using the conventional FAAS technique. Moreover, the conventional FAAS technique is very inexpensive compared to both the modern high-resolution continuum source flame atomic absorption spectrometry (HR-CS FAAS), as
described by Nunes et al.,3 and GF AAS which is
necessary in recommended methods (IUPAC 2.631,34
ISO 8294: 1994,35 AOAC 990.0536 or AOCS Ca 18b-91)37
for Fe determination in vegetable oils.
The proposed method was evaluated in terms of microemulsions stability, precision (relative standard deviation (RSD), %), limits of detection (LOD) and quantification (LOQ), linear range and accuracy (through recovery tests and by determination of Fe in digested vegetable oil samples by ICP OES as comparative procedure). It can be considered very useful to be applied in routine analyses and during the oil refining process quality control, especially because of its low-cost, simplicity and little sample handling.
Experimental
Reagents, solutions and samples
Ultrapure water (obtained by a Milli-Q® water purification
system; Millipore, Billerica, MA, USA) and nitric acid of high purity (obtained by a sub-boiling distillation system; Milestone DuoPUR, Sorisole, Italy) were used throughout all the experiments. All glassware, pipette tips, PFA-Teflon digestion vessels, and polypropylene flasks were soaked in
a 10% (v v-1) nitric acid (65%, Sigma-Aldrich, Germany)
bath for at least 24 h, then, rinsed at least three times with ultrapure water and allowed to dry at room temperature before use.
Light mineral oil (Tedia, Rio de Janeiro, Brazil),
propan-1-ol (≥ 99.5%, Sigma-Aldrich, Germany) and Triton®
X-100 (Merck, Darmstadt, Germany) were used without further purification, for preparing the microemulsions. Inorganic aqueous reference Fe solutions for analytical calibration were prepared by appropriate dilutions of
1000 mg L-1 standard Fe stock solution (Specsol, São Paulo,
Brazil).
Crude and refined soybean, corn, sunflower and canola oils were obtained from Cocamar (vegetable oil factory; Maringá, Paraná, Brazil), and refined cottonseed oil was purchased from a local market (Maringá, Paraná, Brazil).
Flame atomic absorption spectrometry
measured in microemulsions by using an atomic absorption spectrometer (Varian 240FS, Mulgrave, Australia), equipped with a deuterium background correction system. This correction approach permitted to circumvent eventual spectral interferences caused mainly by scattering effects and incomplete atomization of the molecular carbon residues formed in the flame as a consequence of the relatively high carbon content of the vegetable oil microemulsions.
A multi-element Cu/Fe/Mn/Zn hollow cathode lamp (Varian, Mulgrave, Australia) was used as the radiation source, and an air/acetylene (99.7%, Linde, Brazil) flame was used for atomization. All atomic absorbance measurements were performed in triplicate, and their acquisitions were based on the peak height mode. The operational spectrometer parameters are: wavelength (248.3 nm), lamp current (10.0 mA), spectral
resolution (0.2 nm) and flame composition of air/C2H2
(13.5/2 L min-1).
Sample preparation, microemulsion stability and calibration method evaluation
The microemulsions were prepared based on
Amais et al.,24 by the sequential addition: approximately
0.25 g of sample (crude or refined vegetable oil), 4.40 mL
propan-1-ol (as cosolvent), 250.0 µL Triton® X-100
(as surfactant), and 100.0 µL of 50% (v v-1) nitric acid
(as aqueous phase) into a 15 mL graduated polypropylene
flask (Corning®, New York, USA). The mixture was
vortexed (IKA Vortex 1, Germany) for 2 min to obtain a homogeneous, stable and transparent microemulsion.
The stability of the microemulsion samples was checked by FAAS measurement of the absorbance signals for Fe (every 30 min for 8 h) of crude and refined soybean, corn, canola and sunflower microemulsions spiked with 0.5 and
1.0 mg L-1 of Fe.
A calibration method evaluation was performed in order to establish an appropriate strategy for Fe determination in the crude and refined vegetable oil microemulsions, taking into account the possible
existence of matrix effects, of the chemical (different constitutions of vegetable oils) or physical type (different viscosities of vegetable oil microemulsions that could affect their aspiration rate and, consequently, the amount of Fe introduced into the flame).
For that, three external calibration curves (using solutions A, B and C as calibration media) and four calibration curves using the standard addition method (for crude soybean, sunflower, canola and corn oils) were obtained in order to compare their slopes (sensitivities) and to select the optimum calibration media for Fe determination in crude and refined vegetable oil microemulsions. All comparisons were made considering the same range of concentrations
(0.1-1.0 mg L-1 Fe). The constitution of solutions A, B and
C are shown in Table 1.
Crude vegetable oils were chosen to perform the calibration method evaluation because their matrices could lead to more pronounced interferences than refined vegetable oil matrices.
Accuracy evaluation
Recovery test was performed in crude and refined vegetable oil microemulsions spiked with 0.1, 0.2 and
0.5 mg L-1 of Fe, in order to investigate the accuracy
of the proposed method. The additions of Fe were carried out together with the aqueous phase of the microemulsion.
Additionally, a comparative procedure was performed also for checking the accuracy of the results. For that, Fe concentrations were determined in digested vegetable oil samples by ICP OES.
Comparative procedure (sample preparation and ICP OES measurements)
The digestion of vegetable oil samples was performed in a microwave digestion system (CEM MARS Xpress, Matthews, USA), equipped with 55 mL perfluoroalkoxy
(PFA)-Teflon® digestion vessels, according to the
conditions shown in Table 2.
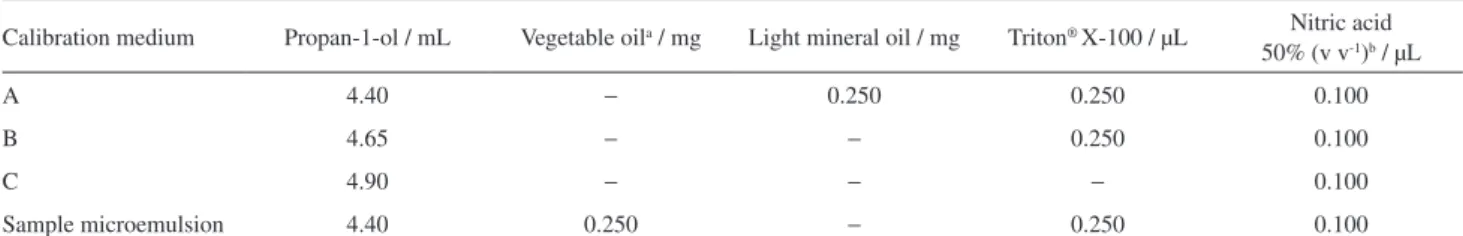
Table 1. Constitution of the solutions A, B and C (as calibration media), and sample microemulsion
Calibration medium Propan-1-ol / mL Vegetable oila / mg Light mineral oil / mg Triton® X-100 / µL Nitric acid
50% (v v-1)b / µL
A 4.40 − 0.250 0.250 0.100
B 4.65 − − 0.250 0.100
C 4.90 − − − 0.100
Sample microemulsion 4.40 0.250 − 0.250 0.100
For this, approximately 0.25 g of crude and refined vegetable oil samples was digested with nitric acid
(5.0 mL) and 30% (v v-1) hydrogen peroxide (3.0 mL)
(Merck, Darmstadt, Germany), in a 50 mL sealed PFA-Teflon vessel, using the conditions described above in the instrumentation section. After the cooling down step, digested sample solutions were carefully transferred to polypropylene flasks, and their final volumes were adjusted to 20.0 mL with ultrapure water. Finally, the total Fe contents of the digested sample solutions were determined by ICP OES.
A simultaneous dual view ICP OES (PerkinElmer Optima 8300, Shelton, USA), with two solid-state sulfur chemiluminescence detectors, was employed in the comparative procedure after the samples digestion. For the axially viewed plasma mode, the emission intensities of Fe were measured at 238.204 nm (ionic line), according to the manufacturer recommended operating conditions for plasma power (1.3 kW), with the nebulizer, plasma and
auxiliary argon flow rates at 0.65, 8.00 and 0.20 L min-1,
respectively.
Results and Discussion
Microemulsion stability
The stabilities of crude and refined vegetable oil microemulsions were checked to verify the maximum duration that the total added Fe concentrations in the microemulsions remained available for accurate analyte quantification. Furthermore, the microemulsions were also visually inspected for transparency and homogeneity. Crude and refined corn, canola, sunflower, and soybean oil microemulsion samples were spiked with 0.5 and
1.0 mg L-1 aqueous standard Fe solutions, and the stabilities
were then evaluated by measuring absorbance values for Fe at each predefined time interval (over 8 h). Stabilities for Fe in the microemulsions were considered analytically suitable when the RSD for the Fe absorbance signals measured at the predefined time periods did not exceed 10%, and the results are shown in Table 3.
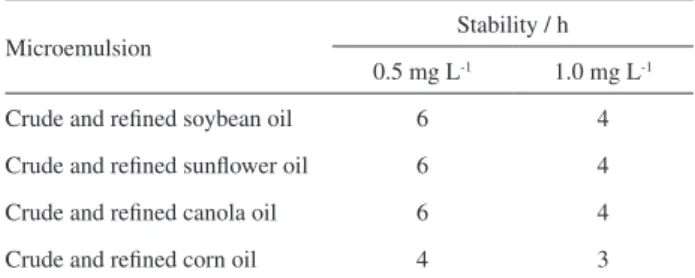
Based on the above consideration, it was observed (from Table 3) that the analytical signals for Fe in the crude and refined microemulsions fortified with 0.5 and
1.0 mg L-1 Fe,remained stable over 6 and 4 h, respectively,
for most samples, except for crude and refined corn oil microemulsions, which were stable only for 4 and 3 h, respectively. The loss of stability, observed by a decrease in the Fe absorbance signals monitored by FAAS for every fortified microemulsion can possibly be due to a minor increase of vegetable oil microemulsion viscosities or changes in oil constitution caused by the lipid oxidation
induced by autoxidation (catalyzed by Fe2+/Fe3+ cations)
and photo-oxidation. Notably, lower absorbance signals are obtained when viscous solutions are aspirated when using FAAS because the analyte mass that reaches the flame is
decreased due to the lower aspiration rates.38
Polyunsaturated fatty acids, such as those present in vegetable oils, undergo rapid lipid oxidation even at room
temperature.39 Therefore, the relatively low stabilities
observed for the vegetable oil microemulsions spiked with the higher Fe concentration can be attributed to
the increased presence of prooxidant Fe2+/Fe3+ cations.
Consequently, the 3 h duration, during which the analytical signals for Fe in the microemulsion samples remained stable, was assumed to be adequate to perform the Fe quantification by application of the proposed direct analysis method.
Both photo-oxidation and autoxidation can contribute
to the lipid oxidation of vegetable oils.7 The use of vortex
stirring for microemulsion homogenization probably contributed to an efficient incorporation of oxygen into the microemulsions, thereby increasing the polyunsaturated lipid oxidation rate. The increase in the rate of lipid oxidation can be explained due to the existence of a higher contact area between unsaturated lipids and oxygen in
microemulsions,31 together with their optical transparency,
which allows the light to interact directly with the
lipids present in the microemulsions.40 Additionally, the
relatively high oxygen solubility in vegetable oils at low
temperatures41,42 can also contribute to the lipid oxidation.
Table 2. Microwave assisted acid digestion conditions used for the crude and refined vegetable oil samples
Step Power / W Power / % Temperature / °C time / min Ramp Hold
1 960 100 170 10 −
2 960 100 170 − 15
3 0 0 25 15 −
Table 3. Stability time (h) of crude and refined soybean, sunflower, corn and canola microemulsions spiked with 0.5 and 1.0 mg L-1 of Fe
Microemulsion Stability / h
0.5 mg L-1 1.0 mg L-1
Crude and refined soybean oil 6 4
Crude and refined sunflower oil 6 4
Crude and refined canola oil 6 4
The rates of photo-oxidation catalyzed by visible light are
much higher than autoxidation rates,43 and depend on the
presence of metal ions in vegetable oils.7 In this context,
it is possible to assume that both autoxidation and photo-oxidation might have affected the stability of the crude and refined vegetable oil microemulsions. However, due to the several factors that interactively influence the oxidative stability of the vegetable oil microemulsions, it is challenging to differentiate the individual effects of these factors on the mentioned lipid oxidation processes. Thus, additional studies about the crude and refined vegetable oil microemulsion stabilizations will be investigated in future works.
Calibration method evaluation
Initially, it was evaluated the use of an external calibration approach by using three different media of calibration (A, B, and C; the composition of these media are shown in Table 1) in order to establish a suitable external calibration curve for compensating and/or minimizing possible matrix effects on the determination of Fe in vegetable oil sample microemulsions. The occurrence of matrix effects in FAAS measurements, based on the continuous aspiration system for sample introduction, depends strongly on the differences in viscosity between calibration and sample solutions, because the aspiration efficiency is markedly dependent upon the viscosity. Therefore, it is crucial that both sample and calibration solutions have similar aspiration efficiencies, in order to guarantee the same analyte mass transport efficiencies from these solutions to the flame. This evaluation was performed by comparing the slope of each external calibration curves (obtained in three different calibration media: A, B and C) with the slope of each standard addition calibration
curve (obtained by using the vegetable oil microemulsion samples), and the results are shown in Table 4.
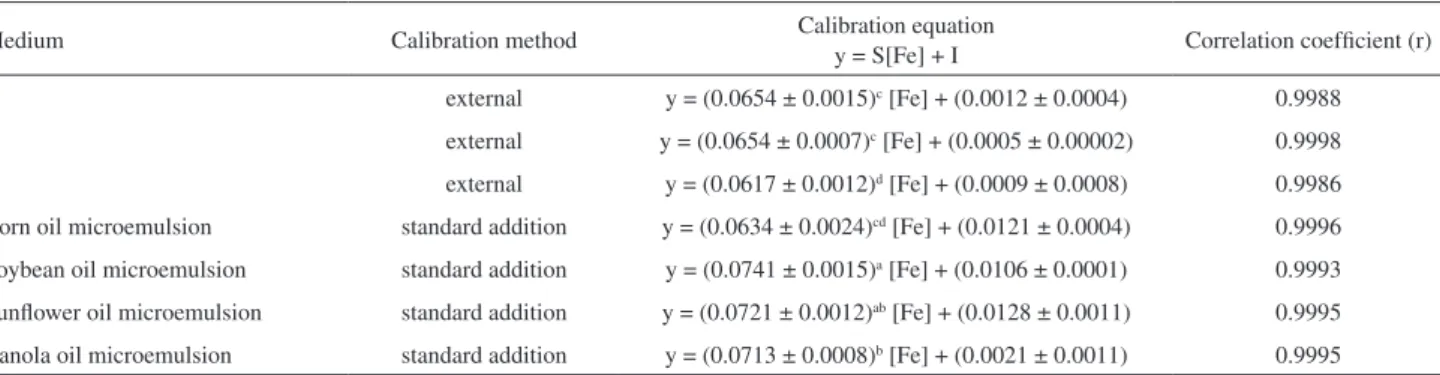
According to Table 4, the slopes of the calibration curve prepared by using A and B media were similar. Therefore, the ratios between the slopes of external calibration curves prepared with medium A or B, and the slope of each standard addition calibration curve prepared with the crude corn, canola, sunflower and soybean oil samples were obtained. The corresponding slope ratio values obtained were 1.03, 0.92, 0.91 and 0.88. For the same type of comparisons, calculations were carried out on the ratios between the slope of the external calibration curve prepared using medium C, and the slope of each standard addition calibration curve prepared with the crude corn, canola, sunflower and soybean oil samples. In this instance, the corresponding calculated slope ratios were 0.97, 0.87, 0.86 and 0.83.
Besides that, the coefficient of variations between the slopes of external calibration curves prepared with medium A or B, and the slope of each standard addition calibration curve prepared with the crude corn, canola, sunflower and soybean oil samples were 2.2, 6.1, 6.9 and 8.8%, respectively. And, the coefficient of variations between the slope of external calibration curve prepared with media C, and the slope of each standard addition calibration curve prepared with the crude corn, canola, sunflower and soybean oil samples were 1.9, 10.2, 11.0 and 12.9%, respectively.
From these results, it can be noted that the external calibration curve obtained with medium C, compared to the curves obtained with either A or B media, presented higher variations in the sensitivity values (compared to the sensitivities of the standard addition calibration curves). Therefore, it can be concluded that both A and B media can be properly used as blank solutions in an external calibration method.
Table 4. Calibration equations obtained with the external calibration method using A, B and C media as analytical blanks to prepare the Fe standard solutions, and with standard addition method using crude corn, canola, sunflower and soybean oil microemulsion samples
Medium Calibration method Calibration equation y = S[Fe] + I Correlation coefficient (r)
A external y = (0.0654 ± 0.0015)c [Fe] + (0.0012 ± 0.0004) 0.9988
B external y = (0.0654 ± 0.0007)c [Fe] + (0.0005 ± 0.00002) 0.9998
C external y = (0.0617 ± 0.0012)d [Fe] + (0.0009 ± 0.0008) 0.9986
Corn oil microemulsion standard addition y = (0.0634 ± 0.0024)cd [Fe] + (0.0121 ± 0.0004) 0.9996
Soybean oil microemulsion standard addition y = (0.0741 ± 0.0015)a [Fe] + (0.0106 ± 0.0001) 0.9993
Sunflower oil microemulsion standard addition y = (0.0721 ± 0.0012)ab [Fe] + (0.0128 ± 0.0011) 0.9995
Canola oil microemulsion standard addition y = (0.0713 ± 0.0008)b [Fe] + (0.0021 ± 0.0011) 0.9995
Calibration equation: y: absorbance signal; S and I: slope and intercept of the calibration curve, respectively; [Fe]: concentration of Fe (mg L-1); Fe calibration
solution concentrations ranging from 0.10 to 1.0 mg L-1; results expressed as mean ± standard deviation of three replicates. Values with different superscript
Thus, considering the application of the proposed analytical method in routine analyses, medium B was chosen as the calibration blank for the external calibration method, since its constitution dispenses the use of the light mineral oil (added to simulate the oil matrix sample), contributing to a reduction in the organic matter (as waste) and minimization of analytical costs. Also, the slope of the external calibration curve prepared with medium B had the highest repeatability, with RSD below 1%.
Accuracy evaluation
The accuracy of the proposed method was estimated by recovery test, through analysis of crude and refined canola, corn, soybean, and sunflower vegetable oil microemulsions spiked with Fe at three concentration levels. According to the Association of Analytical Chemists’ (AOAC) Guidelines
for Standard Method Performance Requirements,44 when
the analyte concentration in the sample ranges 1-10 ppm, the acceptable recovery range is 80-110%.
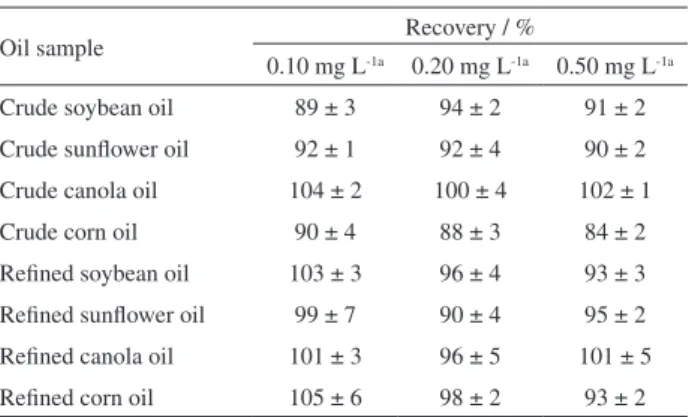
Considering that the recovery values (Table 5) ranged from 84-105%, the proposed method showed good accuracy. Accordingly, the results confirm the method applicability for trace Fe determination in vegetable oil samples with different matrix complexities and from various sources, like the vegetable oils samples analyzed in this work. Moreover, the good recovery values indicated that the proposed method was not affected by matrix effects caused by possible differences in viscosities between calibration solutions and microemulsion samples, and the high organic content of the microemulsions. The potential spectral interferences (background absorption) caused by the high organic content of microemulsions during the Fe atomization in the flame, may have been corrected and/or minimized by using the background corrector based on a deuterium lamp.
Furthermore, to perform an additional evaluation of the method accuracy, the Fe concentrations obtained from the analysis of some vegetable oil samples were compared with those detected using ICP OES after sample treatment by microwave assisted acid digestion. As shown in Table 6, the obtained Fe concentrations were in good agreement with the ICP OES results, considering that the paired
t-test conducted at the 95% confidence level did not show
significant differences.
Analytical performance and application
After verifying the applicability of the proposed method, and considering the importance of identifying the lowest Fe concentrations measurable by its application, the LOD and LOQ were estimated, based on the criteria established by the International Union of Pure and Applied Chemistry
(IUPAC).45 The LOD and LOQ were defined as 3s
blank/b,
and 10sblank/b, respectively, where sblank is the standard
deviation for absorbance measurements of 10 blank calibration solutions, and b is the slope of the external calibration curve. The method repeatability, expressed as RSD (%), was obtained from 10 independent replicates, at
three different Fe concentrations (0.1, 0.2 and 0.5 mg L-1)
in microemulsions. The LOD, LOQ, repeatability and linear range obtained by the proposed method are shown in Table 7.
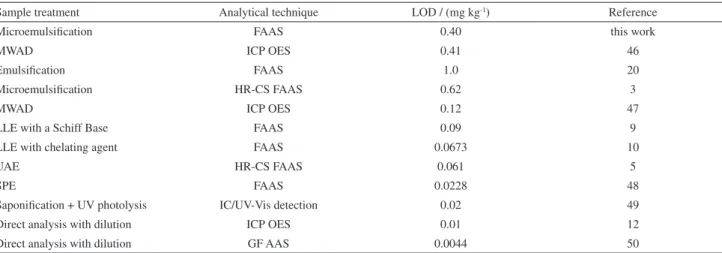
Table 8 shows the LODs found in the literature, for Fe determination in vegetable oils, by applying different analytical assays involved with the use of various procedures of sample preparation and types of instrumental techniques.
The LOD obtained in this work (0.40 mg kg-1) was
similar to the LOD found by Cindric et al.46 (0.41 mg kg-1),
and was lower than LODs found by Nunes et al.3
(0.62 mg kg-1)3 and by Ieggli et al.20 (1.0 mg kg-1); but
higher than those found in other researches presented in Table 6. However, the proposed method is advantageous
Table 5. Recoveries (%) for spiked vegetable oil samples (mean recovery ± standard deviation, n = 3)
Oil sample Recovery / %
0.10 mg L-1a 0.20 mg L-1a 0.50 mg L-1a
Crude soybean oil 89 ± 3 94 ± 2 91 ± 2 Crude sunflower oil 92 ± 1 92 ± 4 90 ± 2 Crude canola oil 104 ± 2 100 ± 4 102 ± 1
Crude corn oil 90 ± 4 88 ± 3 84 ± 2
Refined soybean oil 103 ± 3 96 ± 4 93 ± 3 Refined sunflower oil 99 ± 7 90 ± 4 95 ± 2 Refined canola oil 101 ± 3 96 ± 5 101 ± 5 Refined corn oil 105 ± 6 98 ± 2 93 ± 2
aSpiked Fe concentration in microemulsion.
Table 6. Determination of Fe in crude vegetable oil samples by using the proposed and comparative procedures based on the FAAS and ICP OES measurements, respectively (mean ± standard deviation, n = 3, at 95% confidence level)
Oil sample Fe concentration / (mg kg
-1)
FAAS ICP OES
Crude soybean oil 2.72 ± 0.05 2.83 ± 0.11 Crude corn oil 3.74 ± 0.11 3.41 ± 0.37
since no special apparatus is required in sample preparation procedure for Fe determination (such as centrifugal, ultrasonic bath, microwave digestion system or silica gel column) in addition to using the lower-cost and conventional FAAS technique. Moreover, it attends the
recommendation from Codex Alimentarius,8 maximums
of 1.5 and 5.0 mg kg-1 of Fe in refined and crude vegetable
oils, respectively.Thus, it can be inferred that the proposed method can be successfully applied in routine analysis for direct Fe determination, contributing to an adequate quality control of crude and refined vegetable oils.
The proposed method was applied to analyze crude and refined vegetable oils from various vegetable sources, and the Fe concentrations found in crude soybean, corn and sunflower oils were 2.72 ± 0.05, 3.74 ± 0.11 and
3.67 ± 0.19 mg kg-1, respectively (shown in Table 6). In
crude canola oil and refined soybean, corn, sunflower, canola and cottonseed oils the Fe concentrations found were below the LOQ.
The fact that all Fe concentrations in the analyzed refined vegetable oils were lower than the LOQ can be explained by considering that the oil refining process was
effective for removing Fe,51-53 contributing to reducing the
occurrence of adverse effects on the oxidative stability of
vegetable oils due to the presence of prooxidant Fe2+/Fe3+
cations.
Iron may be present in vegetable oils due to environmental factors and contaminations during the refining process. Hence, a wide range of Fe concentrations in these samples
exists in the literature. Pehlivan et al.18 determined
0.0107-0.0195 mg kg-1 of Fe in refined soybean, sunflower
and corn oils. He et al.13 found 0.019-0.177 mg kg-1 of Fe in
refined soybean, sunflower, corn and canola oils. However, comparatively higher Fe concentrations can be observed
in refined oils, such as 23.3 and 15.3 mg kg-1 for refined
soybean and sunflower, respectively,46 and 8.920, 8.398
and 8.004 mg kg-1 for refined sunflower, corn and canola
oils, respectively.2 Also, 2.80 mg kg-1 of Fe was reported
in crude soybean oil,51 which is close to the concentration
found in the current work (2.72 ± 0.05 mg kg-1) for the
same type of vegetable oil. Moreover, 8.37 mg kg-1 of Fe
in crude sunflower oil53 and 0.5-1.5 mg kg-1 of Fe in crude
canola oil52 have been previously reported.
Conclusions
The new method proposed in this work is a suitable alternative for Fe determination in crude or refined vegetable oils, mainly because of its rapidity and simplicity. The proposed method proved to be applicable and reliable, without the need to use any relatively high-cost instrumentation for
Table 7. Analytical parameters obtained for the Fe determination in crude and refined vegetable oil microemulsion samples by FAAS
Parameter Value
LODa / (mg kg-1) 0.40
LOQa / (mg kg-1) 1.3
Linear rangea / (mg kg-1) 1.3-160.0
Repeatability RSD / % 1.0-5.7
aData in mg kg-1 of oil samples were calculated taken into consideration the
sample dilution (amount of oil sample and total volume of microemulsion: 20-fold dilution); LOD: limit of detection, LOQ: limit of quantification; RSD: relative standard deviation.
Table 8. Limit of detection (LOD) reported in the literature for the determination of Fe in vegetable oils by different analytical procedures
Sample treatment Analytical technique LOD / (mg kg-1) Reference
Microemulsification FAAS 0.40 this work
MWAD ICP OES 0.41 46
Emulsification FAAS 1.0 20
Microemulsification HR-CS FAAS 0.62 3
MWAD ICP OES 0.12 47
LLE with a Schiff Base FAAS 0.09 9
LLE with chelating agent FAAS 0.0673 10
UAE HR-CS FAAS 0.061 5
SPE FAAS 0.0228 48
Saponification + UV photolysis IC/UV-Vis detection 0.02 49
Direct analysis with dilution ICP OES 0.01 12
Direct analysis with dilution GF AAS 0.0044 50
sample preparation, except by requiring the use of FAAS as the measurement technique. Moreover, this method provides a highly attractive alternative for quality control of edible oils, during their manufacturing processes, by quantifying Fe in crude or refined vegetable oils. It is highly likely that the concentrations of other metals can also be determined in vegetable oils by applying the respective proposed method.
Acknowledgments
The authors are grateful to: CAPES and CNPq for the financial support and research grants, Dr Adilson de Oliveira Junior (Embrapa Soja) for the use of the microwave digestion system and for the ICP OES analyses, and to COMCAP-UEM for the use of FAAS equipment.
References
1. Al-Abadleh, H. A.; RSC Adv. 2015, 5, 45785.
2. Bakircioglu, D.; Kurtulus, Y. B.; Yurtsever, S.; Food Chem.
2013, 138, 770.
3. Nunes, L. S.; Barbosa, J. T. P.; Fernandes, A. P.; Lemos, V. A.; Walter, N. L.; Graças, M.; Korn, A.; Teixeira, L. S. G.; Food Chem. 2011, 127, 780.
4. Ansari, R.; Kazi, T. G.; Jamali, M. K.; Arain, M. B.; Wagan, M. D.; Jalbani, N.; Afridi, H. I.; Shah, A. Q.; Food Chem. 2009,
115, 318.
5. Trindade, A. S. N.; Dantas, A. F.; Lima, D. C.; Ferreira, S. L. C.; Teixeira, L. S. G.; Food Chem. 2015, 185, 145.
6. Anwar, F.; Kazi, T. G.; Saleem, R.; Bhanger, M. I.; Grasas
Aceites 2004, 55, 160.
7. Choe, E.; Min, D. B.; Compr. Rev. Food Sci. Food Saf. 2006, 5, 169.
8. Codex Alimentarius Commission; Codex Standard for Named
Vegetable Oils, CODEX-STAN 210-1999. Available at http:// www.fao.org/docrep/004/y2774e/y2774e04.htm#TopOfPage, accessed on September 29, 2017.
9. Baran, E. K.; Yaşar, S. B.; Food Anal. Methods 2013, 6, 528. 10. Tokay, F.; Bağdat, S.; J. Am. Oil Chem. Soc. 2015, 92, 317. 11. De Leonardis, A.; Macciola, V.; De Felice, M.; Int. J. Food Sci.
Technol. 2000, 35, 371.
12. Chaves, E. S.; de Loos-Vollebregt, M. T. C.; Curtius, A. J.; Vanhaecke, F.; Spectrochim. Acta, Part B 2011, 66, 733. 13. He, Y. M.; Chen, J. J.; Zhou, Y.; Wang, X. J.; Liu, X. Y.; Anal.
Methods 2014, 6, 5105.
14. Carbonell, V.; Mauri, A. R.; Salvador, A.; de la Guardia, M.;
J. Anal. At. Spectrom. 1991, 6, 581.
15. Fischer, J. L.; Rademeyer, C. J.; J. Anal. At. Spectrom. 1994, 9, 623.
16. Matos Reyes, M. N.; Campos, R. C.; Talanta 2006, 70, 929.
17. Lepri, F. G.; Chaves, E. S.; Vieira, M. A.; Ribeiro, A. S.; Curtius, A. J.; DeOliveira, L. C. C.; DeCampos, R. C.; Appl. Spectrosc. Rev. 2011, 46, 175.
18. Pehlivan, E.; Arslan, G.; Gode, F.; Altun, T.; Musa Özcan, M.;
Grasas Aceites 2008, 59, 239.
19. Anthemidis, A. N.; Arvanitidis, V.; Stratis, J. A.; Anal. Chim. Acta 2005, 537, 271.
20. Ieggli, C. V. S.; Bohrer, D.; do Nascimento, P. C.; de Carvalho, L. M.; Food Addit. Contam., Part A 2011, 28, 640.
21. Aucélio, R. Q.; Doyle, A.; Pizzorno, B. S.; Tristão, M. L. B.; Campos, R. C.; Microchem. J. 2004, 78, 21.
22. de Jesus, A.; Silva, M. M.; Vale, M. G. R.; Talanta 2008, 74, 1378.
23. Lyra, F. H.; Carneiro, M. T. W. D.; Brandão, G. P.; Pessoa, H. M.; de Castro, E. V.; Microchem. J. 2010, 96, 180.
24. Amais, R. S.; Garcia, E. E.; Monteiro, M. R.; Nóbrega, J. A.;
Fuel 2012, 93, 167.
25. Lima, A. S.; Silva, D. G.; Teixeira, L. S. G.; Environ. Monit. Assess. 2015, 187, 1.
26. Zmozinski, A. V.; de Jesus, A.; Vale, M. G. R.; Silva, M. M.;
Talanta 2010, 83, 637.
27. Leite, C. C.; Zmozinski, A. V.; Vale, M. G. R.; Silva, M. M.;
Anal. Methods 2015, 7, 3363.
28. Cunha, F. A. S.; Sousa, R. A.; Harding, D. P.; Cadore, S.; Almeida, L. F.; Araújo, M. C. U.; Anal. Chim. Acta 2012, 727, 34. 29. Capek, I.; Adv. Colloid Interface Sci. 2004, 107, 125. 30. Salager, J.; J. Surfactants Deterg. 2005, 8, 3. 31. Burguera, J. L.; Burguera, M.; Talanta 2012, 96, 11.
32. Pereira, T. C.; Conceição, C. A. F.; Khan, A.; Fernandes, R. M. T.; Ferreira, M. S.; Marques, E. P.; Marques, A. L. B.;
Spectrochim. Acta, Part A 2016, 168, 60.
33. Chatzidaki, M. D.; Arik, N.; Monteil, J.; Papadimitriou, V.; Leal-Calderon, F.; Xenakis, A.; Colloids Surf., B 2016, 137, 146.
34. International Union of Pure and Applied Chemistry (IUPAC);
Standard Methods for the Analysis of Oils, Fats and Derivatives, Blackwell Scientific Publications: Oxford, 1991. Available at http://old.iupac.org/publications/books/ISBN0632033371_ compress.pdf, accessed on October 30, 2017.
35. International Organization for Standardization (ISO); ISO 8294:1994; Animal and Vegetable Fats and Oils - Determination
of Copper, Iron and Nickel Contents - Graphite Furnace Atomic
Absorption Method, ISO, 1994. Available at https://www.iso. org/standard/15414.html, accessed on October 30, 2017. 36. Association of Official Analytical Chemists (AOAC); AOAC
990.05; Copper, Iron, and Nickel in Edible Oils and Fats, AOAC, 1992. Available at http://www.aoacofficialmethod.org/index. php?main_page=product_info&cPath=1&products_id=257, accessed on October 30, 2017.
Atomic Absorption Spectrophotometry, AOCS, 1998. Available at https://aocs.personifycloud.com/PersonifyEBusiness/ Default.aspx?TabID=251&productId=114588, accessed on October 30, 2017.
38. Welz, B.; Sperling, M.; Atomic Absorption Spectrometry, 3rd ed.;
Wiley-VCH: Weinheim, Germany, 1999.
39. Kumarathasan, R.; Rajkumar, A. B.; Hunter, N. R.; Gesser, H. D.; Prog. Lipid Res. 1992, 31, 109.
40. Kittipongpittaya, K.; Salcedo, L.; McClements, D. J.; Decker, E. A. In Nanotechnology and Functional Foods: Effective Delivery of Bioactive Ingredients, 1st ed.; Sabliov, C. M.; Chen, H.; Yada,
R. Y., eds.; John Wiley & Sons, Ltd: Chichester, 2015, p. 138. 41. Ke, P. J.; Ackman, R. G.; J. Am. Oil Chem. Soc. 1973, 50, 429. 42. Chaix, E.; Guillaume, C.; Guillard, V.; Compr. Rev. Food Sci.
Food Saf. 2014, 13, 261.
43. Gunstone, F. D.; Fatty Acid and Lipid Chemistry; Chapman & Hall: New York, 1996.
44. Association of Official Analytical Chemists (AOAC);
Guidelines for Standard Method Performance Requirements; AOAC Official Methods of Analysis, 2016. Available at http:// www.eoma.aoac.org/app_f.pdf, accessed on October 30, 2017.
45. Thompson, M.; Ellison, S. L. R.; Wood, R.; Pure Appl. Chem.
2002, 74, 835.
46. Cindric, I. J.; Zeiner, M.; Steffan, I.; Microchem. J. 2007, 85, 136.
47. Gonzálvez, A.; Ghanjaoui, M. E.; El Rhazi, M.; de la Guardia, M.; Food Sci. Technol. Int. 2010, 16, 65.
48. Tokay, F.; Bağdat, S.; Int. J. Food Sci. Technol. 2015, 50, 2694. 49. Buldini, P. L.; Ferri, D.; Sharma, J. L.; J. Chromatogr. A 1997,
789, 549.
50. Martín-Polvillo, M.; Albi, T.; Guinda, A.; J. Am. Oil Chem. Soc.
1994, 71, 347.
51. Sleeter, R. T.; J. Am. Oil Chem. Soc. 1981, 58, 239.
52. Ghazani, S. M.; Marangoni, A. G.; J. Am. Oil Chem. Soc. 2013,
90, 923.
53. Lamas, D. L.; Crapiste, G. H.; Constenla, D. T.; Food Sci.
Technol. 2014, 58, 71.
Submitted: August 11, 2017
Published online: November 3, 2017