A Work Project, presented as part of the requirements for the Award of a Master’s Degree in Economics from NOVA – School of Business and Economics
Choosing the Gender and Skill of Politicians: List Composition and Electability
Across Brazilian Municipalities
Adriana Ferro, n. º 511
A Project carried out under the supervision of: Professor Doutor José Tavares
1
Choosing the Gender and Skill of Politicians: List Composition and Electability
Across Brazilian Municipalities
By FERRO, ADRIANA* Abstract
This work project studies the effect of variations in the proportion of female candidates
on the quality of politicians. This effect was divided between nominated and elected
body. Cross-sectional data was used for two elections, and an OLS as an IV approach.
Results show that the existence of female candidates on parties’ list increases the
quality of the nominated body. Moreover, contrary to what many advocate, increasing
the presence of female candidates either increases or has no effect on the quality of the
elected body. Results that were confirmed for the overall data and controlling for
region factors only.
Keywords: Women’s representation; Quality; City council elections; Brazil
I. Introduction
The growing pressure to increase women’s representation in the political arena, has led almost 100 countries to introduce gender quotas in their political systems, in the last two decades (Dahlerup, 2007). Specifically, between 1997 and 2007 the number of countries introducing gender quotas increased from 10 to 49. And, although the share of female elected politicians is below 50 percent in most countries, countries that introduced gender quotas present shares about 5 percentage points higher than no-quota countries (Júlio and Tavares, 2010). The adoption of gender quotas has been sustained by many, arguing that; it is an essential tool to achieve gender equality, which is of major important for democratic evolution (Jones, 2008; Dahlerup, 2007). Others suggest that quotas work as a mechanism that will change the male-dominated legislatures,
*
2 through the increase in competition between genders, which will break through cultural and social influences (Tripp and Kang, 2008; Dahlerup, 2007). Moreover, many believe
that women’s access into politics is constrained by voter and party bias, namely due to limited contact with female politicians in the past. This highlights the advantages of gender quotas as a way to improve the voter’s perception of the quality of female politicians, which may contribute to a reduction of gender bias in politics (Beaman et al, 2009; Maniquet et al, 2005). And finally,this policy may bring into the decision-making process an adequate set of policies that women are more likely to propose, such as education and health laws (Saint-Germain, 1989).
Those against, see it as a violation of the merit principle (Dahlerup, 2007); a mechanism that is perceived to reduce the value of a traditional male activity (Goldin, 1990), and that it also restricts voters’ choice (Thernstrom and Thernstrom, 1997). In addition, one of the main discussions revolves around the idea that the introduction of gender quotas may induce a potential sacrifice on the quality of the political body. The basic intuition behind this is that female under-representation is explained by individual choices. Therefore, the quota is a restriction that is imposed in the electoral system to the benefit of women, changing the initial political equilibrium, in a way independent of merit, and may generate an efficiency loss (Holzer and Neumark, 2000).
3 Existing literature has mainly focused on the impact of gender quotas on women representation (see Krook, 2006); however the relationship between the increase of women candidates and the quality of the elected body, outside the gender quotas context, has not been tested. Therefore, the purpose of this work is to assess: i) the effect of having women candidates, on the quality composition of parties’ list and ii) the impact of gender composition of parties’ list on the quality and gender composition of the elected body. It will focus on Brazilian city council elections, occurred in 2000 and 2004. Both elections occurred under the same quota legislation.
The dimension of Brazil, composed by 5562 municipalities, with a wide range of sizes1, the heterogeneity across municipalities, regarding cultural and socio-economic differences, and quite different results in terms of the gender and the quality of candidates and elected body, provided enough variance to give consistency to the study. Moreover, the type of party list employed for city council elections is the open list system, in which voters can choose whoever they want from the list. This system creates an interesting dynamics to the study of the allocation of candidates on parties’ list.
To analyze the effects of women candidates on the quality of nominated politicians, an OLS approach was used. As for the effects of women candidates on the gender and on the quality of elected politicians, both an OLS approach as an IV - correcting for endogeneity - were utilized. Quality of politicians was measure by the type (high-skill or not)2 of their former occupation. Given the assumption that there is a positive correlation between market skills and political skills (Galasso and Nannici, 2010; Casselli and Morelli, 2001; Mattozzi and Merlo, 2007; Baltrunaite et al, 2012). Results show that, women candidates are increasing, due to the increase in high and low-skill
1
São Paulo is the biggest municipality with 11 376 685 inhabitants in 2012, and Borá with 807 inhabitants, is the smallest (Instituto Brasileiro de Geografia e Estatísticas, 2012).
2
4 female candidates. Moreover, the effect of the presence of female candidates on the quality of the overall nominated politicians is positive, due to the increase in high-skill female candidates and the reduction on low-skill male candidates. Moving to the impact on the elected body, contrary to the argument that gender quotas imposes a cost on the quality of the elected body, increases in female candidates, actually increased the overall quality of the elected body in the OLS estimation, effect that is mostly driven not only by the increase in the proportion of high-skill females elected, but also by the reduction on the proportion of low-skill males elected. However, there is no effect on the overall quality of the elected body when the IV estimation is computed. Results that were confirmed when controlling for regional factors only, and for a series of municipal indicators.
In Brazil, since women outweigh men in all educational levels, the existing gender gaps in politics may represent a cost for both society and politics, because there is an unexploited potential role for women. Therefore, affirmative action programs that aim to increase women representation in politics may represent an effective mechanism that brings into the political arena more educated politicians. Hence, as long as it is expected that high-skill individuals perform better as politicians, increasing female representativeness may be beneficial for the society. Also, the increased contact with female politicians, provided by gender quotas, may also reduce voter’ and party’ bias and increase their ability to distinguish between good and bad female politicians. Which
may ultimately, facilitate women’ access into politics, challenging new women to get
involved in politics, contributing to democratic development.
5
II.Related Literature
This work compiles and integrates two strands of the literature already published; the introduction of gender quotas and the quality and selection of politicians.
1. Introduction of gender quotas
Most of the existing literature has been focused on the impact of gender quotas on women representation (see Krook, 2006). Some have emphasized, that this impact depends on the electoral system (Norris, 1985; Kenworthy and Malami, 1999). In Brazil, the proportional representation system is used in city council elections. This system is considered by many authors, to be the most effective in promoting women representation. It is argued that in such a system, district magnitude tends to be greater, therefore as the number of seats increases, so does the chances of a party winning
several seats in a district, facilitating women’s access into politics. Bigger districts tend
to be more heterogeneous, this may lead parties to consider a variety of interests, including the representation of women in their lists (Ballington and Matland, 2004; Matland and Studal, 1996; Tripp and Kang, 2008; Jones, 1998; Maniquet et al, 2005). The open list form is used in Brazilian city council elections. In this form, contrarily to the close list form, in which, the quota legislation, stipulates that from the winning seats, some of them will have to be allocated to women; in the open-list there is no such guarantee. Also, since there is no law regulating the party’s list construction, if discrimination against women occurs in the intraparty selection process, the disadvantage to women representation in the open-list system may be even bigger (Jones, 1998). Nonetheless, such disadvantage may be overcome, by a proper design of
the quota legislation like the “zipper quota” where men and women candidates need to
6 Besides, most forms of quota regimes, by changing the common de facto situation, of a traditional male activity, where men only compete with men, provide an equal opportunity, for both genders to compete for political positions, enabling voters to choose between male and female candidates (Dahlerup, 2007). Also, by bringing women into politics, quota regimes may affect gender stereotypes and the perception of the effectiveness of female leadership (Beaman et al, 2009).
2. Quality and selection of politicians
Potential candidates differ in terms of their quality and gender, creating a trade-off in the selection of candidates, especially in the Brazilian electoral system, in which party
ballot composition becomes of crucial importance for the party’s success. Higher
quality is a threat to the party’s leadership, since any leader is more likely to be
challenged internally by more able candidates. For the same reasoning, male politicians have a bias against female politicians (Besley, 2012)3. This is also explained, due to their differences in policy preferences (Saint-Germain, 1989; Thomas, 1984).
Regarding the quality factor it is supported that low quality citizens have a comparative advantage in holding office then in the private sector (Caselli and Morelli, 2001; Júlio and Tavares, 2010; Messner and Polborn, 2003). Thus, the existence of gender quotas will attract women that have a lower opportunity cost on the private sector to run as candidates, reducing the average quality of the elected body (Caselli and Morelli, 2001). However, this negative impact on the average quality of politicians is also influenced by the rewards from public office and the level of political discrimination that women face in the political arena. Therefore, if rewards from public office are low comparing to those in the private sector, low quality citizens, have indeed a comparative advantage in holding office, decreasing the overall quality. Also, if the
3
7 rewards are high but women face a significant discrimination in the political market, the overall quality of the elected body decreases (Júlio and Tavares, 2010). The selection of candidates will also determine the quality of the pool of politicians; therefore focus has
been put on the parties’ recruitment decisions. The parties’ decisions on the new recruit
may be closely affected by decisions in other sectors, as already mentioned. For instance, given the close relationship between the lobbying sector and the political sector, in which parties have better information about the new recruits than the lobbying
sector, the latter can only infer about the individuals’ political skills based on party’s
recruitment decisions. Therefore, a political party facing competition for political talent from lobbying firms, may intentionally decide to recruit only mediocre individuals, because politicians with relative higher skills makes party recruits more expensive (Matozzi and Merlo, 2007) 4.
Regarding the gender factor, there may also be an incentive for male incumbents to support a parity law, as a strategy to increase their likelihood of being elected. Under a single member district electoral system, if a parity law is approved, the number of new
female candidates’ increases and it also becomes more likely for a male incumbent to
face a woman challenger. Moreover, due to the existence of voter’ bias in favour of male candidates and because women are perceived to have, on average, a lower electoral support, these will weaken the pool of challengers and increase the incumbency male advantage. This mechanism is likely to emerge even when women’s quality is high, due to voter’ and political’ bias against women (Manique et al, 2005)5.
4
Matozzi and Merlo (2007) studied the initial recruitment of individuals in the political sector, through an equilibrium model of political recruitment by a party who faces political competition for political talent from the lobbying sector. The closed relationship between the two sectors, as they say, in the recruitment decisions is explained by the fact that lobbyists have to deal with politicians, therefore political skills are valued by the lobbying sector, and the wages is this sector will affect the recruitment decisions of a political party. Also, to deal with skilled
politicians requires skilled lobbyists, thus the party’s recruitment decisions affect the output of the lobbying sector,
and therefore the wages in the political sector.
5
8 Although Carmo (2012) found that in Brazilian city council elections, under a proportional representation system, the presence of female candidates is a win-win situation. Men’s electoral success can be optimized by having until 22.5 percent of females on the list. Women’s electoral success increases until approximately 75 percent of the list are women. And party’s electoral results are maximized by having 37,3 percent6 of women in the list.
Electoral competition also plays a role in determining the selection of politicians. Regarding the quality of politicians, electoral competition has beneficial effects, since politicians with higher quality are more likely to run in contestable districts (Galasso and Nannicini, 2010)7. Regarding the politicians’ gender, as competition increases, so does the quality of the party leaders. This makes them less constrained on the selection of their followers, leading to a political body more able and diverse (Besley, 2012).
Finally, as Baltrunaite et al (2012)8 empirically showed, gender quotas, by increasing the number of elected women, who are on average more educated than men, and by decreasing the number of low-educated men, may contribute to increase the overall quality of politicians. Furthermore, gender quotas can push party leaders to re-think about their own preferences and those of the electorate, causing an increase in gender diversity and competence (Besley et al, 2012). In what follows the intention is to move away from the effects of gender quotas and focus on the effects of increases in women representation on the quality of politicians. Specifically on its effects on the quality
(2007) continued the same studied, for 2002 and 2007 French National Assembly elections, and the effect described above persisted (see also Fréchette and Maniquet, 2006).
6
Percentage that is higher than the one required by quota legislation (30%).
7
They addressed the impact of electoral competition in the process of political selection, taking into account the different degrees of contestability in electoral districts in Italy. Quality was measured by years of schooling, previous market income, and local government experience.
8
9
composition of parties’ listand the relationship between gender composition of parties’
list and the gender and quality composition of the elected body.
III.Brazilian City Council Elections and Electoral System
The Brazilian city council elections use the open list type and the proportional representation electoral system. The former translates in an unordered list of candidates presented to the voters. At the election stage, each voter may decide to vote for an individual candidate or for a party. Then, through the totality of votes for the party and
for the party’s candidates, seats are allocated between parties, and are given to those within a party with the highest number of votes (coalition)9. District magnitude varies according to population, ranging from 9 to 55 seats. Parties are allowed to present a
candidate’s list that corresponds to 150% of the seats10. The parties’ choice regarding their candidates list is defined by each party’s internal bylaws. Though, the candidate must be affiliated to a party in the municipality where he is running for at least a year (Nicolau, 2007). Gender quota legislation, dated from 1995, requires that at least 30 percent of the places on the list should be filled by each gender. However, since it was established there is nothing that makes it enforceable.
IV.Data and Methodology
The empirical strategy follows three steps: first, the percentage of high and low-skill candidates is regressed on the percentage of female candidates, and on a set of political, regional, cultural and socio-economic controls; second, the gender and the quality composition of the elected politicians is regressed on the percentage of female candidates (plus the previous controls); and third, an instrumental variable is used to account for endogeneity.
9
The Brazilian electoral system rules due to the rules of distribution of seats in coalitions, creates considerable disproportionality. Moreover, the way the blank ballot is accounted and the lack of perfect relation between proportion of seats and proportion of citizens, further contributes to the high observed disproportionality (Tafner, 1996; Nicolau and Schmitt, 1995).
10
10 For this analysis data from 2000 and 2004 Brazilian city council elections were utilized as well as data from municipality and party characteristics for those years. The notation used assigns an observation to party in municipality at time (138 633 observations11). As controls; district magnitude, religion and socio-economic variables were used. However, due to differences among regions (e.g. culture) and parties’ practices12 and characteristics13; year, region and party’s ideology dummies are included to control for these unobservable effects. Taking into account this specification, enables the usage of OLS and then IV. A detailed description of the variables’ sources can be found in Appendix B. Summary statistics for all the considered variables can be found in Appendix C. The baseline OLS estimator is of the form:
,
where is the outcome of interest; is the percentage of female candidates on party list , from municipality , at time ; are the set of controls in municipality at time ; and is an error term.
As a proxy for quality, the type (high-skill or not) of the former occupation of the candidates was used. Motivated by the assumption of a positive correlation between market skills and political skills, a scenario in which one finds a higher share of politicians with a previous high-skill occupation, is interpreted as an indicator of a higher quality political body (Galasso and Nannici, 2010; Casselli and Morelli, 2001; Mattozzi and Merlo, 2007; Baltrunaite et al, 2012).
District magnitude represents the total number of seats available per district. On one hand, there is evidence that a higher number of seats are an advantage for female
11
There are missing values regarding municipality and city council elections characteristics.
12Caul (2001) includes elites’ power, women hierarchy in the party, support given to women on campaigns and the
recruitment process.
13
11 representation (Jones, 1998; Rule, 1987; Matland and Brown, 1992). On the other hand, if campaign costs increase with district magnitude, and given that there is an unequal income distribution and lack of public financing for campaign costs in Brazil, women are at a disadvantage (Carmo, 2012)14. Also, higher district magnitude usually increases party delegations15 and therefore, the competition among parties, and because women are perceived to have a lower electoral support16 it may be harmful for women.17
To account for religion, we use the percentage of Catholics and Protestants in the municipality, because they are the first and second most important religions respectively in Brazil (Census, 2010), and because there is previous evidence that Catholics are less prone to female representation (Davidson-Schimit, 2006; Tripp and Kang, 2008; Schwindt-Bayer, 2005).
Concerning socio-economic variables, the following were included; GDP per capita (since higher economic status increases female political representation (Reynolds, 1999; Tripp and Kang, 2008)); percentage of women in the municipality, (since it can either
influence the supply of potential female candidates, or the parties’ strategic decision on
the number of women included on the lists, under the populist idea that women will be less averse to vote for candidates that have the same gender as them (Beaman et al, 2009))18. Average schooling per gender was also included, under the hypothesis that education and gender affect attitudes towards female representation (Inglehart and
14
The disproportional distribution of income across gender in Brazil is also identified in Araújo and Alves (2007).
15
This variable is related with district magnitude, but is also affected by other factors such as distribution of the vote and rules for allocating seats among the parties (Schmidt, 2003).
16
Maniquet et al (2005) empirically showed that the existence of voters’ bias against female candidates, will increase the incumbency male advantage.
17
Davidson-Schimit (2006) empirically showed the negative relation between adherence of the party to quota legislation and the number of voters per direct mandate, highlighting the idea that women may be negatively affected in larger districts. Moreover, Schmidt (2003) exploited the fact that larger districts usually imply larger party delegations, which in turn decreases competition within the party for scarce list positions. Moreover, these larger party delegations will have a greater influence in the recruitment process. Reinforcing the idea, that larger districts that usually contribute to larger parties, will bring changes to the selection of candidates, which may be prejudicial to women.
18But some authors have not found any significant relationship between women’s position in the social structure and
12 Norris, 2003; Schwindt-Bayer, 2005; Reynolds, 1999)19. And finally, health and education indicators, firstly because better socio-economic indicators are usually associated with higher female representation, as previously discussed. And secondly, because women are perceived to be more likely to invest in and promote laws regarding health and education (Beaman et al, 2009; Saint-Germain, 1989).
A. Impact of female candidates on the quality composition of parties’ list
To start with, it is assumed that parties are not supply constrained for female candidates20. Therefore the decision concerned with the number of female candidates on
parties’ list and the choice of the type (high-skill or low-skill) of female candidates is not simultaneous. With this it can be plausibly assumed that the percentage of female candidates is exogenous. Consequently, the OLS estimator takes the form of:
,
where measures the percentage of high-skill female candidates; the percentage of low-skill female candidates; the percentage of high-skill male candidates; the percentage of low-skill male candidates; the percentage of total high-skill candidates; and the percentage of total low-skill candidates, on party list , from municipality , at time . The rest of the variables are defined in the same way as before. Here, the goal is to assess the effects of increases in female candidates on the quality composition of
parties’ list, therefore the dependent variables were constructed as the following:
, the ratio of the type of candidate over the total list of party , in municipality , at time to measure the list composition effects. The following regressions were estimated with controls, for the overall data and
19
Inglehart and Norris (2003), found a positive relation between wealthier postindustrial societies and women representativeness.
20
13 with regional controls only, results for this specification can be found in Table 1C in Appendix D.
TABLE 1–OLSREGRESSION RESULTS (2)
Independent Variables High-Skill Female Candidates Low-Skill Female Candidates 2000 2004 2000
2004 2000 2004
2000 2004 Percentage of Female Candidates 0,301*** 0,319*** 0,535*** 0,699*** 0,702*** 0,701*** North 0,007*** -0,003 0,006 -0,007*** 0,003 -0,003**
South -0,001 -0,002 0,000 0,002 0,003 0,001
Northeast 0,011*** 0,005 0,006* -0,011*** -0,006** -0,010*** Southeast -0,002 -0,013*** 0,007** 0,002 0,013*** 0,005*** GDPpc 0,000 0,000 0,000 -0,000 -0,000 -0,000 District Magnitude 0,001*** 0,001*** 0,001*** -0,001*** -0,001*** -0,001*** Percentage of Women 0,005 0,093 0,017 -0,006 -0,193*** -0,008** Average Schooling (F) 0,011*** 0,010 0,018** -0,012*** -0,006 -0,012*** Average Schooling (M) -0,007* -0,011 -0,028*** 0,007** 0,006 0,008** Percentage of Catholics 0,010* 0,001 0,010 -0,007 0,008 -0,002 Percentage of Protestants 0,002 -0,031 0,035 -0,000 0,027 0,010 Student per Teacher -0,000*** -0,000** -0,001*** 0,000*** 0,000 0,000*** Infant Mortality pc 2,730** 0,745 4,188 -2,571** -0,906 -1,704 Vaccine pc 0,000 0,001 -0,003 -0,000 -0,003 -0,001 Center 0,007*** 0,009*** 0,038*** -0,007*** -0,007*** -0,006*** Left 0,012*** 0,012*** 0,023*** -0,012*** -0,011*** -0,011*** Right 0,004*** 0,003 0,027*** -0,004*** -0,003 -0,003***
Year=2004 - - -0,138*** - - -0,001
Constant -0,037*** -0,057* 0,058*** 0,040*** 0,106*** 0,033*** Number of Observations 80.211 35.184 115.395 79.508 38.338 117.846 Adjusted R-Squared 0,250 0,265 0,173 0,639 0,646 0,643
Independent Variables High-Skill Male Candidates Low-Skill Male Candidates 2000 2004 2000
2004 2000 2004
2000 2004 Percentage of Female Candidates -0,142*** -0,182*** -0,289*** -0,855*** -0,822*** -0,841*** North 0,028*** 0,007 0,045*** -0,028*** -0,009* -0,022*** South -0,010*** -0,032*** -0,011** 0,009*** 0,033*** 0,009*** Northeast 0,024*** 0,000 0,043*** -0,025*** 0,000 -0,030*** Southeast -0,021*** -0,040*** -0,016*** 0,021*** 0,039*** 0,021*** GDPpc 0,001*** 0,001*** 0,001*** -0,001*** -0,001*** -0,001*** District Magnitude 0,008*** 0,005*** 0,018*** -0,007*** -0,004*** -0,007*** Percentage of Women -0,013* 1,802*** -0,018 0,012* -1,873*** -0,004 Average Schooling (F) 0,009 -0,034** 0,003 -0,008 0,033** -0,004 Average Schooling (M) 0,023*** 0,057*** 0,064*** -0,022*** -0,056*** -0,031*** Percentage of Catholics -0,025** -0,025 -0,046** 0,024** 0,041** 0,032*** Percentage of Protestants -0,087*** -0,052 -0,094*** 0,083*** 0,062* 0,086*** Student per Teacher 0,000*** 0,000 0,002*** -0,000*** -0,000 -0,001*** Infant Mortality pc 5,241** -15,541*** 16,092*** -3,926* 16,774*** 2,331 Vaccine pc -0,001 0,009* -0,010*** 0,001 -0,009* -0,002 Center 0,018*** 0,012*** 0,083*** -0,018*** -0,010*** -0,013*** Left 0,043*** 0,034*** 0,073*** -0,042*** -0,033*** -0,037*** Right 0,009*** 0,002 0,055*** -0,009*** -0,001 -0,004*
Year=2004 - - -0,246*** - - -0,033***
Constant -0,009 -0,781*** 0,059** 1,006*** 1,807*** 1,014*** Number of Observations 80.437 37.539 117.976 80.437 38.338 118.775 Adjusted R-Squared 0,070 0,064 0,169 0,463 0,456 0,461
Independent Variables Total High-Skill Candidates Total Low-Skill Candidates 2000 2004 2000
2004 2000 2004
14 Vaccine pc -0,003 0,012** 0,000 0,003 -0,012** -0,000
Center -0,026*** 0,018*** -0,008*** 0,026*** -0,018*** 0,008*** Left 0,003 0,045*** 0,021*** -0,003 -0,045*** -0,021*** Right -0,038*** 0,004 -0,021*** 0,038*** -0,004 0,021***
Year=2004 - - 0,030*** - - -0,030***
Constant 0,010 -0,890*** -0,015 0,990*** 1,890*** 1,015*** Number of Observations 80.437 37.972 118.409 80.437 37.972 118.409 Adjusted R-Squared 0,069 0,044 0,056 0,069 0,044 0,056
Main Variables: Average Schooling for individuals with age above 18 years in the municipality; Percentage of Women, Catholics and Protestants in the municipality; GDP pc, Infant Mortality pc and Vaccine pc ratios in which the denominator is the population in the municipality; Center, Left and Right stand for party’s ideology dummies in which the omitted variable is the Indifferent party ideology; North, South, Northeast and Southeast stand for region dummies in the omitted variable is Midwest
Notes: Results with the standard errors can be found in Appendix D, Table 1B and Table 1B-1
Source: Sources of the variables used can be found in Appendix B
***Significant at 1 percent level, **Significant at 5 percent level, *Significant at 10 percent level
As the results show, controlling for political, cultural, regional and socio-economic factors, increases in the proportion of female candidates have a positive impact both on the proportion of high-skill and low-skill female candidates. Although the latter effect is higher, the impact on the proportion of high-skill female candidates is higher than the actual average of the proportion of high-skill female candidates on parties’ list, so that the female skill mix improved. Furthermore, increases in the proportion of nominated
women on parties’ list, reduces the proportion of low-skill male candidates more than the proportion of high-skill male candidates.
Consequently, since the increased proportion of high-skill female candidates is higher than the decreased proportion of high-skill male candidates, and because the decreased proportion of low-skill male candidates is higher than the increased proportion of low-skill female candidates; it follows that increases in the proportion of female candidates seems to lead to an increase on the overall quality of the list composition. This effect is mostly driven by the increase in high-skill female candidates and also the decrease in low-skill male candidates.
What is more, looking at the results from 2000 to 2004, the allocation of women on
15 decreasing at a faster speed than the low-skill male candidates, it follows that the positive impact on total high-skill candidates decreases from 2000 to 2004.
These results are consistent with those found for the overall data and when controlling for region specific effects only (Table 1C in Appendix D).
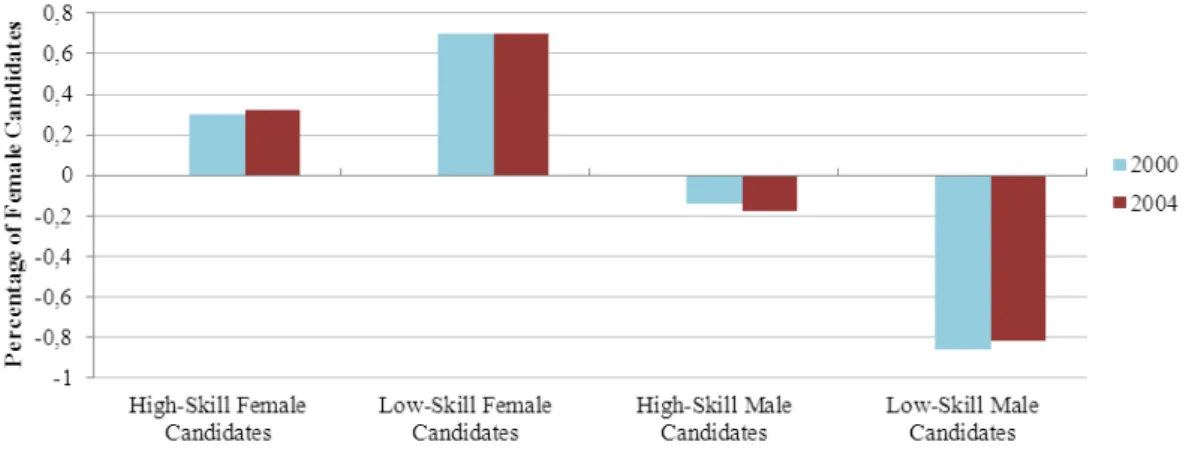
FIGURE 1–Female Candidates' Impact on the Quality of the List Composition
Figure 1 allows a better understanding of the marginal effects of changes in the supply of women candidates on the quality of the list composition. Therefore, regarding 2000 elections, the marginal effect of an increase by 1 percentage points in women candidates, would lead to 0,3 percentage points increase of high-skill female candidates and to a 0,7 percentage points increase of low-skill female candidates; high-skill male candidates would decrease by 0,2 percentage points and the low-skilled would diminish, around, 0,83 percentage points. The latter being the ones that suffer the most. Results that are roughly stable across the two elections.
B. Impact of candidate’s gender on gender and quality composition of electoral results -
Relative electability
To study the electorate reaction - regarding gender and quality of elected candidates -
to female candidates on parties’ lists, the OLS estimator takes the form of:
16 where measures the percentage of high-skill females elected; the percentage of low-skill females elected; the percentage of elected females; the percentage of high-skill males elected; the percentage of low-skill males elected; the percentage of elected males; the percentage of total high-skill elected; the percentage of total low-skill elected and the percentage of total elected, on party list , from municipality , at time . The rest of the variables are defined in the same way as before. As before the goal is to study the effects of increases in female candidates on the quality composition of parties’ list, but also to study its effects on the candidates’ electability, therefore the dependent variables were constructed in the following manner:
, the first ratio measures the list composition effects, the second accounts for the type of elected politicians over the respective type of candidate of party , in municipality , at time - measuring the electability effects; their product translates into the relative electability of the candidates of each party , in municipality , at time .
The following regressions were estimated with controls, for the overall data and with regional controls only, results for this specification can be found in Table 2C and Table 2C-1 in Appendix D.
TABLE 2–OLSREGRESSION RESULTS (3)
Independent Variables High-Skill Females Elected Low-Skill Females Elected 2000 2004 2000
2004 2000 2004
2000 2004 Percentage of Female Candidates 0,055*** 0,049*** 0,052*** 0,081*** 0,087*** 0,084***
North 0,000 -0,002 -0,001 -0,002 0,002 -0,000
17 Right 0,000 0,005*** 0,002*** 0,008*** 0,006*** 0,007***
Year=2004 - - -0,005*** - - -0,002***
Constant -0,000 0,037*** -0,001 -0,010** 0,103*** -0,006 Number of Observations 65.978 35.184 101.162 79.508 38.106 117.614 Adjusted R-Squared 0,036 0,045 0,039 0,080 0,080 0,079
Independent Variables High-Skill Males Elected Low-Skill Males Elected 2000 2004 2000
2004 2000 2004
2000 2004 Percentage of Female Candidates -0,032*** -0,041*** -0,036*** -0,167*** -0,167*** -0,169*** North 0,001 -0,001 0,000 0,049*** -0,006 -0,009*** South -0,000 -0,002 -0,000 -0,002*** 0,018*** 0,003 Northeast 0,008*** 0,003 0,007*** -5,591*** 0,027*** 0,013*** Southeast -0,008*** -0,009*** -0,008*** -0,005*** -0,004 -0,016*** GDPpc 0,000 -0,000 -0,000 -0,001*** -0,000*** -0,000*** District Magnitude 0,000** -0,000** 0,000 -0,006*** -0,001** -0,005*** Percentage of Women -0,005 0,188*** -0,003 -0,047*** -1,385*** -0,061*** Average Schooling (F) 0,005 0,018** 0,009*** 0,021*** 0,013 0,014** Average Schooling (M) 0,002 -0,013* -0,002 -0,001*** -0,018 -0,019*** Percentage of Catholics 0,030*** 0,032*** 0,031*** -0,006*** 0,133*** 0,160*** Percentage of Protestants -0,015* -0,002 -0,011 -0,047*** -0,046 0,030** Student per Teacher -0,000*** -0,000*** -0,000*** 0,021*** -0,003*** -0,002*** Infant Mortality pc 2,361** -0,300 1,679* -0,017*** 27,215*** 4,007** Vaccine pc -0,003*** -0,006** -0,003*** 0,163*** -0,007 -0,007*** Center 0,022*** 0,019*** 0,021*** 0,091*** 0,084*** 0,090*** Left 0,011*** 0,011*** 0,011*** 0,016*** 0,014*** 0,016*** Right 0,013*** 0,011*** 0,012*** 0,065*** 0,061*** 0,065***
Year=2004 - - 0,003*** - - -0,012***
Constant -0,011* -0,083*** -0,010* 0,107*** 0,765*** 0,141*** Number of Observations 77.222 37.539 114.761 80.437 38.338 118.775 Adjusted R-Squared 0,021 0,018 0,019 0,153 0,112 0,134
Independent Variables Elected Females Elected Males 2000 2004 2000
2004 2000 2004
2000 2004 Percentage of Female Candidates 0,131*** 0,133*** 0,131*** -0,197*** -0,207*** -0,203*** North -0,001 0,001 -0,001 -0,010*** -0,007 -0,009***
South -0,001 0,004* -0,001 0,003 0,016*** 0,002
Northeast 0,007*** 0,009*** 0,005*** 0,030*** 0,030*** 0,020*** Southeast -0,005*** -0,002 -0,005*** -0,023*** -0,013*** -0,025*** GDPpc -0,000*** -0,000 -0,000*** -0,000*** -0,000*** -0,000*** District Magnitude -0,001*** -0,000 -0,001*** -0,006*** -0,002*** -0,005*** Percentage of Women 0,002 -0,325*** -0,001 -0,052*** -1,173*** -0,063*** Average Schooling (F) 0,005** 0,027*** 0,010*** 0,025*** 0,031** 0,022*** Average Schooling (M) -0,006** -0,029*** -0,012*** -0,013* -0,031** -0,019*** Percentage of Catholics 0,032*** 0,040*** 0,037*** 0,189*** 0,160*** 0,187*** Percentage of Protestants 0,002 -0,008 0,002 0,034* -0,051 0,018 Student per Teacher -0,000*** -0,000*** -0,000*** -0,002*** -0,003*** -0,003*** Infant Mortality pc -1,049 5,625*** 0,818 -3,145 26,393*** 5,667*** Vaccine pc 0,000 -0,006*** -0,001 -0,008*** -0,012** -0,010*** Center 0,017*** 0,016*** 0,017*** 0,111*** 0,102*** 0,109*** Left 0,005*** 0,002 0,004*** 0,027*** 0,024*** 0,026*** Right 0,012*** 0,010*** 0,012*** 0,078*** 0,071*** 0,077***
Year=2004 - - -0,003*** - - -0,009***
Constant -0,022*** 0,128*** -0,019*** 0,094*** 0,673*** 0,129*** Number of Observations 80.211 38.338 118.549 80.437 38.338 118.775 Adjusted R-Squared 0,125 0,122 0,122 0,166 0,125 0,148
Independent Variables Total High-Skill Elected Total Low-Skill Elected 2000 2004 2000
2004 2000 2004
2000 2004 Percentage of Female Candidates 0,020*** 0,006** 0,014*** -0,020*** -0,006** -0,014***
North 0,001 -0,002 0,000 -0,001 0,002 -0,000
South -0,000 0,001 0,000 0,000 -0,001 -0,000
Northeast 0,011*** 0,007** 0,011*** -0,011*** -0,007** -0,011*** Southeast -0,009*** -0,010*** -0,009*** 0,009*** 0,010*** 0,009***
GDPpc -0,000 -0,000 -0,000 0,000 0,000 0,000
18 Vaccine pc -0,003*** -0,005* -0,003*** 0,003*** 0,005* 0,003*** Center 0,026*** 0,024*** 0,025*** -0,026*** -0,024*** -0,025*** Left 0,014*** 0,013*** 0,013*** -0,014*** -0,013*** -0,013*** Right 0,017*** 0,015*** 0,016*** -0,017*** -0,015*** -0,016***
Year=2004 - - 0,003*** - - -0,003***
Constant -0,025*** -0,059** -0,025*** 1,025*** 1,059*** 1,025*** Number of Observations 80.389 37.972 118.361 80.389 37.972 118.361 Adjusted R-Squared 0,020 0,014 0,017 0,020 0,014 0,017
Independent Variables Total Elected
2000 2004 2000 2004 Percentage of Female Candidates -0,004 -0,010*** -0,007***
North 0,007** 0,002 0,005**
South 0,005* 0,010*** 0,004**
Northeast 0,022*** 0,013*** 0,015*** Southeast -0,010*** -0,005* -0,010*** GDPpc -0,000** -0,000** -0,000*** District Magnitude -0,006*** -0,001*** -0,005*** Percentage of Women -0,037*** -0,453*** -0,043*** Average Schooling (F) 0,016*** 0,019** 0,015*** Average Schooling (M) -0,003 -0,014 -0,005 Percentage of Catholics 0,122*** 0,076*** 0,108*** Percentage of Protestants 0,042*** -0,010 0,026** Student per Teacher -0,002*** -0,001*** -0,002*** Infant Mortality pc 8,144*** 14,749*** 8,661*** Vaccine pc -0,007*** -0,013*** -0,008*** Center 0,141*** 0,125*** 0,136***
Left 0,028*** 0,032*** 0,029***
Right 0,091*** 0,074*** 0,085***
Year=2004 - - -0,036***
Constant 0,050*** 0,241*** 0,072*** Number of Observations 80.437 38.338 118.775 Adjusted R-Squared 0,163 0,123 0,161
Main Variables: Average Schooling for individuals with age above 18 years in the municipality; Percentage of Women, Catholics and Protestants in the municipality; GDP pc, Infant Mortality pc and Vaccine pc ratios in which the denominator is the population in the municipality; Center, Left and Right stand for party’s ideology dummies in which the omitted variable is the Indifferent party ideology; North, South, Northeast and Southeast stand for region dummies in the omitted variable is Midwest
Notes: Results with the standard errors can be found in Appendix D, Table 2B, Table 2B-1 and Table 2B-2
Source: Sources of the variables used can be found in Appendix B
***Significant at 1 percent level, **Significant at 5 percent level, *Significant at 10 percent level
Controlling for political, cultural, regional and socio-economic factors, results show that increases in the proportion of female candidates, increases both the proportion of high-skill females elected and low-skill females elected, having the highest impact on the latter. Therefore, its impact on the proportion of elected females is positive, which goes in line with the results in Carmo (2012) and Beaman et al (2009). This impact is mostly driven by the increase in low-skill females elected, following the theoretical findings of Caselli and Morelli (2001).
19 negative and mostly motivated by the decrease in low-skill males elected, which goes in line with the results found by Baltrunaite et al (2012).
Hence, because the increased proportion of high-skill females elected is higher than the decreased proportion of high-skill males elected, and since the decreased proportion of low-skill males elected is higher than the decreased proportion of high-skill males elected, the impact on the quality of the elected body seems to be positive. This effect is driven by the increase in the proportion of high-skill females elected and also the reduction in low-skill males elected, a result that is consistent with those found by, Baltrunaite et al (2012) and Júlio and Tavares (2010).
In addition, looking at the results from 2000 to 2004, there is a slight decrease in the proportion of high-skill females elected and an increase in the proportion of low-skill females elected. Moreover, regarding the impact on the type of elected males, there is a small decrease in the proportion of high-skill males elected, meanwhile the proportion of low-skill males elected remains constant. As a consequence, the proportion of total high-skill elected from 2000 to 2004, decreases, mostly due to the increase in the proportion of low-skill females elected and the decrease in the proportion of high-skill males elected.
These results are consistent with those found controlling for regional factors only (Table 2C and Table 2C-1 in Appendix D), for the overall data and follow the same path as those described for the candidates’ list composition (Table 1).
C. Accounting for Endogeneity
20 candidates in 2000 was used as an instrumental variable for the percentage of female candidates in the 2004 elections. The basic intuition is that the decision to be a candidate for two consecutive elections is strongly correlated, since from the first to the second election, candidates gain experience and become well-known by the voters, making being elected easier and causing a higher likelihood of running again for election. Moreover, the instrumental variable and the dependent variables will be correlated, but only through the indirect path of the percentage of female candidates in 2000 being correlated with the percentage of female candidates in 2004, which in turn determines the dependent variables. With this it can be plausibly assumed that the instrument is exogenous.
Hence, the following equation was estimated: ,
where all the variables are defined in the same way as before, but only for the 2004 elections; and is the instrumental variable, the percentage of female candidates, on party list , from municipality , in 2000. These regressions were also estimated with regional controls only, results that can be found in Table 3C in Appendix D.
TABLE 3 – IV REGRESSION RESULTS (4)
Independent Variables High-Skill Females Elected Low-Skill Females Elected Elected Females High-Skill Males Elected Low-Skill Males Elected Elected Males
Percentage of Female Candidates 0,078*** 0,127*** 0,197*** -0,080*** -0,297*** -0,371***
North -0,001 0,004* 0,003 -0,000 -0,010* -0,010
South 0,004** 0,002 0,005** -0,002 0,021*** 0,019*** Northeast 0,005*** 0,007*** 0,011*** -0,001 0,029*** 0,028*** Southeast -0,002 -0,002 -0,004 -0,010*** -0,001 -0,011** GDPpc -0,000 -0,000* -0,000* -0,000 -0,000 -0,000 District Magnitude 0,000 0,000 0,000 -0,001*** -0,001** -0,002*** Percentage of Women -0,134*** -0,235*** -0,335*** 0,305*** -1,451*** -1,120*** Average Schooling (F) 0,014*** 0,014** 0,026*** 0,019** 0,008 0,027* Average Schooling (M) -0,014*** -0,015** -0,026*** -0,013 -0,016 -0,030* Percentage of Catholics 0,020*** 0,030*** 0,046*** 0,029** 0,165*** 0,189*** Percentage of Protestants -0,002 -0,008 -0,009 -0,014 0,005 -0,011 Student per Teacher -0,000** -0,000*** -0,000*** -0,000* -0,003*** -0,003*** Infant Mortality pc 0,167 4,094** 4,164* -0,514 25,553*** 24,556*** Vaccine pc 0,000 -0,004* -0,003 -0,000 -0,007 -0,007 Center 0,006*** 0,011*** 0,017*** 0,021*** 0,074*** 0,094***
Left 0,003* 0,001 0,004* 0,015*** 0,009* 0,024***
21 Stock-Yogo weak ID test (10%
maximal IV size) 16,38 16,38 16,38 16,38 16,38 16,38 Underidentification Test (P-Value) 0,000 0,000 0,000 0,000 0,000 0,000
Independent Variables Total High-Skill Elected Total Low-Skill Elected Total Elected Percentage of Female Candidates -0,004 0,004 0,001
North -0,001 0,001 0,002
South 0,001 -0,001 0,014***
Northeast 0,004 -0,004 0,018***
Southeast -0,012*** 0,012*** -0,005
GDPpc -0,000 0,000 -0,000*
District Magnitude -0,001** 0,001** -0,002***
Percentage of Women 0,210*** -0,210*** -0,526***
Average Schooling (F) 0,031*** -0,031*** 0,021*
Average Schooling (M) -0,025** 0,025** -0,015
Percentage of Catholics 0,044*** -0,044*** 0,104***
Percentage of Protestants -0,016 0,016 -0,000
Student per Teacher -0,000** 0,000** -0,002***
Infant Mortality pc -0,849 0,849 18,448***
Vaccine pc 0,000 -0,000 -0,012***
Center 0,026*** -0,026*** 0,121***
Left 0,018*** -0,018*** 0,040***
Right 0,017*** -0,017*** 0,082***
Constant -0,114*** 1,114*** 0,265***
Number of Observations 24.844 24.844 25.070
Adjusted R-Squared 0,014 0,014 0,108
Weak Identification Test (F Statistic) 597, 942 597, 942 643, 843 Stock-Yogo weak ID test (10%
maximal IV size) 16,38 16,38 16,38
Underidentification Test (P-Value) 0,000 0,000 0,000
Main Variables: Average Schooling for individuals with age above 18 years in the municipality; Percentage of Women, Catholics and Protestants in the municipality; GDP pc, Infant Mortality pc and Vaccine pc ratios in which the denominator is the population in the municipality; Center, Left and Right stand for party’s ideology dummies in which the omitted variable is the Indifferent party ideology; North, South, Northeast and Southeast stand for region dummies in the omitted variable is Midwest
Notes: Results with the standard errors can be found in Appendix D
Source: Sources of the variables used can be found in Appendix B, Table 3B
***Significant at 1 percent level, **Significant at 5 percent level, *Significant at 10 percent level The bias level considered, to infer the strength of the instrument is at 10%
Testing for the power of the instrument, the results show that for all the regressions, the instrument in use is strong. Moreover, there is evidence of a well-specified model that is adequately identified, and, therefore, further evidence that the instrument is valid.
Controlling for political, cultural, regional and socio-economic factors, contrary to what was observed in the previous OLS results; there is no effect of increases in the percentage of female candidates on the quality of the total elected body, or on the total elected body itself. Also, the impact of increases in the percentage of female candidates on all the other dependent variables is amplified comparing to those found previously.
22 on the reduction on high-skill males elected. Results that are similar to those found for the OLS estimation. However, in the instrumental variable estimation, although the reduction on the proportion of low-skill males elected is higher than the increased proportion of low-skill females elected, the reduction on the high-skill males elected is higher than the increased proportion of high-skill females elected.
These results are consistent with those found controlling for regional factors only (Table 3C in Appendix D).
V.Conclusion
The effect of the increase on the proportion of female candidates, driven by the quota legislation, on the quality of politicians, was investigated. This effect was divided between nominated body and elected body. Results show that contrary to what many advocate, increasing the presence of female candidates either increases or has no effect on the quality of politicians. Both in the nominated body and the elected body, being the effect justified, by the increase on the proportion of high-skill female politicians and the reduction on the proportion of low-skill male politicians, under the OLS estimation. But when correcting for endogeneity, there is no effect on the quality of the elected body. Results that were consistent for the overall data and when controlling for regional factors only. Therefore, as this work suggests, the potential sacrifice on the quality of the political body should not be an argument against policies that aim to increase women representation.
23 these questions, since it was only considered female candidates. However, results show the same effect mechanism for the overall quality of both nominated and elected body.
In Brazil, since women outweigh men in all educational levels, the existing gender gaps in politics may represent a cost for both society and politics, because there is an unexploited potential role for women. Therefore, affirmative action programs that aim to increase women representation in politics may represent an effective mechanism that brings into the political arena more educated politicians. Hence, as long as it is expected that high-skill individuals perform better as politicians, increasing female representativeness may be beneficial for the society. Also, the increased contact with female politicians, provided by gender quotas, may also reduce voter’ and party’ bias and increase their ability to distinguish between good and bad female politicians. Which
may ultimately, facilitate women’ access into politics, challenging new women to get
involved in politics, contributing to democratic development.
References
Alves, José. 2010. “As Cotas e a Paridade de Gênero na Política”. Centro Feminista de Estudos e Assessoria Jornal Fémea, 166
Araújo, Clara, and José Alves. 2007. “Impactos de Indicadores Sociais e do Sistema Eleitoral sobre as Chances das Mulheres nas Eleições e suas Interações com as Cotas.” DADOS –Revista de Ciências Sociais, 50(3): 535-577
Ballington, Julie, and Richard Matland. 2004. “Political Parties and Special Measures:
Enhancing Women’s Participation in Electoral Processes”. OSAGI and Department of Political
Affairs Expert Group Meeting
Baltrunaite, Audinga, Piera Bello, Alessandra Casarico, and Paola Profeta. 2012. “Gender
Quotas and the Quality of Politicians.” CESIFO Working Paper 3734
Baum, Christopher, Mark Schaffer, and Steven Stillman. 2007. “Enhanced Routines for
Instrumental Variables/Generalized Method of Moments Estimation and Testing”. The Stata Journal, 7(4): 465-506
Beaman, Lori, Raghabendra Chattopadhyay, Esther Duflo, Rohini Pande, and Petia Topalova. 2009. “Powerful Women: Does Exposure Reduce Bias?”. Quarterly Journal of Economics, 124(4): 1497-1540
Besley, Timothy, Olle Folke, Torsten Persson, and Johanna Rickne. 2012. “Gender Quotas and the Crisis of the Mediocre Man: Theory and Evidence from Sweden”. Stockholms Universitet Department of Economics Working Paper 121126
Carmo, Mafalda. 2012. “Nominations across Gender: An Empirical Investigation of Brazilian
24 Caselli, Francesco and Massimo Morelli. 2001. “Bad Politicians”. NBER Working Paper 8532
Caul, Miki. 1999. “Women’s Representation in Parliament – The Role of Political Parties”. Party Politics, 5(1): 79-98
Caul, Miki. 2001. “Political Parties and the Adoption of Candidate Gender Quotas: a Cross -National Analysis”. The Journal of Politics, 63(4): 1214-1229
Dahlerup, Drupe. 2007. “Electoral Gender Quotas: Between Equality of Opportunity and
Equality of Result”. Representation, 43(2): 73-92
Darcy, R. and Sarah Schramm. 1997. “When Women Run Against Men.” The Public Opinion Quarterly, 41(1): 1-12
Fréchette, Guillaume, and François Maniquet. 2006. “Incumbents’ Interest, Voters’ Bias and
Gender Quotas”. Département des Sciences Économiques de l'Université catholique de Louvain Discussion Paper 42
Fréchette, Guillaume, François Maniquet, and Massimo Morelli. 2005. “Endogenous
Affirmative Action: Gender Bias Leads to Gender Quotas”. Institute for Advanced Study, School of Social Science Economics Working Paper 51
Fréchette, Guillaume, François Maniquet, and Massimo Morelli. 2007. “Incumbents’
Interests and Gender Quotas”. Columbia University Department of Economics Discussion Paper 0708-06
Freidenvall, Lenita. 2004. “Women’s Political Representation and Gender Quotas – the
Swedish Case”. Department of Political Science, Stockholm University Working Paper Series 2003:2
Galasso, Vincenzo, Tommaso Nannicini. 2009. “Competing on Good Politicians.” IZA Discussion Paper 4282
Goldin, Claudia. 2002. “A Pollution Theory of Discrimination: Male and Female Differences in Occupations and Earnings”. NBER Working Paper 8985
Holzer, Harry, and David Neumark. 2000. "What Does Affirmative Action Do?". Industrial and Labor Relations Review, 53(2). 240-271
Inglehart, Ronald and Pippa Norris. 2003. Rising Tide: Gender Equality and Cultural Change Around the World. Cambridge, UK: Cambridge University press
Instituto Brasileiro de Geografia e Estatísticas. 2010. Census 2010
Instituto Brasileiro de Geografia e Estatísticas. 2012. 2012 Population Forecasts
Jones, Mark. 1998. “Gender quotas, Electoral laws, and the Election of Women: Lessons From
the Argentine Provinces”. Comparative Political Studies, 31(1): 3-21
Júlio, Paulo, and José Tavares. 2010. “The Good, the Bad, and the Different: Can Gender Quotas Raise the Quality of Politicians”. CEPR Discussion Paper 7917
Kenworthy, Lane, and Melissa Malami. 1999. “Gender Inequality in Political Representation:
a Worldwide Comparative Analysis”. Social Forces, 78(1), 235-269
Krook, Mona. 2006. “Reforming Representation: The Diffusion of Candidate Gender Quotas
Worldwide”. Politics and Gender, 2: 303-327
Matland, Richard, and Deborah Brown. 1992. “District Magnitude’s Effect on Female
Representation in U.S. State Legislatures”. Legislative Studies Quarterly, 17(4): 469-492 Mattozi, Andrea and Antonio Merlo. 2007. “Mediocracy”. NBER Working Paper 1292
Messner, Matthias, and Mattias Polborn. 2003. “Paying Politicians”. IGIER Università Commerciale Luigi Bocconi Working Paper 246.
25 Nicolau, Jairro. 2003. “The open-list Electoral System in Brazil”. DADOS – Revista de Ciências Sociais, 49(4): 689-720
Norris, Pippa. 1985. “Women’s Legislative Participation in Western Europe”. Western European politics, 8:90-101
Paxton, Pamela. 1997. “Women in National Legislatures: A Cross-National Analysis”. Social Science Research, 26(4): 442-464
Reynolds, Andrew. 1999. “Women in the Legislatures and Executives of the World: Knocking
at the Highest Glass Ceiling”. World Politics, 51(4): 547-572
Rule, Wilma. 1987. “Electoral Systems, Contextual Factors and Women’s Opportunity for Election to Parliament in Twenty-Three Democracies”. Western Political Quarterly, 40(3): 477-498
Saint-Germain, Michelle. 1989. “Does their Difference Make a Difference? The Impact of
Women on Public Policy in Arizona Legislature”. Social Science Quarterly, 70(4): 956-968 Schmidt, Gregory. 2003. “Unanticipated Successes: Lessons from Peru’s Experiences with
Gender Quotas in Majoritarian Closed List and Open List PR Systems”. Presented at the
international IDEA workshop, Lima, Peru.
Schwindt-Bayer, Lesli. 2005. “The incumbency Disadvantage and Women’s Election to
Legislative Office”. Electoral Studies, 24: 227-24
Sigelman, Lee, and Susan Welch. 1984. “Race, gender, and opinion toward black and female
presidential candidates”. Public Opinion Quarterly, 48(2): 467-475
Tafner, Paulo. 1996. “Proporcionalidades e Exclusão no Sistema Politico-Eleitoral Brasileiro”. Instituto de Pesquisa Econômica Aplicada Discussion Paper 450
Thernstrom, Stephen, and Abigail Thernstrom. 1997. America in Black and White: One Nation, Indivisible. New York: Simon and Schuster.
Tripp, Aili, and Alice Kang. 2008. “The Global Impact of Quotas: On the Fast Track to