Rainer Friedrich
Holger Foysi
Joern Sesterhenn
FG Stroemungsmechanik Technical University Muenchen Boltzmannstr. 15 D-85748 Garching, Germany
Turbulent Momentum and Passive
Scalar Transport in Supersonic
Channel Flow
Direct numerical simulations of compressible turbulent channel flow including passive scalar transport have been performed at five Mach numbers, M, ranging from 0.3 to 3.5 and Reynolds numbers, Reτ
, ranging from 181 to 1030. The Prandtl and Schmidt numbers are 0.7 and 1.0, respectively, in all cases. The passive scalar is added to the flow through one channel wall and removed through the other, leading to an S-shaped mean scalar profile with non-zero gradient in the channel centre. The paper describes the set of compressible flow equations, which is integrated using high-order numerical schemes in space and time. Statistical equations are presented for fully developed flow, including budgets for the Reynolds stresses, the turbulent scalar fluxes and the scalar variance. Results are presented for second order moments and the terms in the mentioned balance equations. Outer scalings are found suitable to collapse incompressible and compressible data. The reduction in the near-wall pressure-strain and pressure-scalar gradient correlations due to compressibility is explained using a Green-function-based analysis of the fluctuating pressure field.
Keywords: Direct numerical simulation, compressible channel flow, passive scalar transport, outer scaling, pressure-strain correlation, pressure-scalar gradient correlation
Introduction
Supersonic channel flow is a prototypical example of a high-speed flow which allows for a systematic study of compressibility effects in wall-bounded turbulence without other important but distinct features such as streamwise development, shocks, and flow separation. Coleman et al. (1995) were the first to perform direct numerical simulations (DNS) of channel flow between cold isothermal walls with Mach numbers up to M = 3. They found that Morkovin’s hypothesis, “the flow follows an incompressible pattern”, holds for the most part, and that the Van-Driest log-law is valid. In a companion paper, Huang et al. (1995) observed that the turbulent stresses, ρRij, scale with the wall shear stress, τw, and semi-local scaling is useful. Lechner et al. (2001), in their study of M = 1.5 channel flow, reported that the anisotropy of the Reynolds stresses was changed relative to corresponding incompressible values, but no explanation was given. Morinishi et al. (2003) simulated supersonic channel flow at M = 1.5 with one wall isothermal and the other wall adiabatic, finding that the resulting differences of the flow between the two halves of the channel are significant.1
The influence of compressibility on passive scalar transport has not yet been studied so far in wall-bounded turbulent flows. Kim et al. (1989) performed the first direct simulations of passive scalar transport in incompressible fully developed turbulent channel flow at a Reynolds number Reτ, based on friction velocity, uτ, and channel half width, h, of 180. They used two types of boundary conditions. In one case, the scalar (temperature) was internally generated and isothermal walls of the same temperature served as boundary conditions. In the other case, a different temperature was imposed at each of the isothermal walls. The Prandtl numbers were varied between 0.1 and 2. Recently, Johansson et al. (1999) performed a similar DNS of incompressible channel flow, imposing a mean scalar (temperature) gradient at a Reynolds number of Reτ = 265 and a Prandtl number of 0.7.
Presented at ETT 2004 – 4th Spring School on Transition and Turbulence September 27th
- October 1st
, 2004, Porto Alegre, RS, Brazil. Paper accepted: May, 2005. Technical Editor: Aristeu da Silveira Neto.
In which way compressibility affects passive scalar transport is important to know, before active scalar transport is investigated, the understanding of which is prerequisite to the understanding of combustion processes. Based on the above literature survey it appears that, although the behaviour of the mean velocity profile is well understood in supersonic channel flow, there are open issues regarding the behaviour of the turbulent stresses and turbulent scalar fluxes. In the case of incompressible channel flow, the fluctuating velocity scale is uτ= τw/ρ, while there are two length scales, the
inner length scale, ν/uτ, and the outer length scale, h (the channel half width), leading to well-established inner and outer scalings of the turbulence. Corresponding scalings apply to the turbulent scalar fluxes. The applicability of these scalings to the turbulent momentum and scalar fluxes and their transport equations in the context of compressible flow will be evaluated. At the same time an explanation will be given why the turbulence structure is modified due to compressibility.
Nomenclature
c = speed of sound, m/s
cp, cv = specific heats at constant pressure and volume, J/(kg K)
D = Diffusion coefficient, m2/s
fi = component of body force in i-direction, kg/(m2 s2)
h = channel half width, m H = total enthalpy, J/kg
Lx1 = length of computational domain in x1-direction, m
M = Mach number, dimensionless Nx1 = Number of grid points in x1-direction
p = pressure, Pa
Pr = Prandtl number, dimensionless
qi = component of heat flux in i-direction, J/(m3 s)
R = specific gas constant, J/(kg K) Re = Reynolds number, dimensionless s = specific entropy, J/(kg K) Sc = Schmidt number, dimensionless sij = deformation tensor, 1/s
t = time, s T = temperature, K
ui = component of velocity in i-direction, m/s
uav = streamwise velocity, averaged over cross-section, m/s
Xi+ = wave component in positive i-direction
Numerical Method and Computational Details
In this section, we describe the basic equations for compressible flow of an ideal gas including passive scalar transport, how these equations are integrated numerically and which initial and boundary conditions are used to predict fully developed turbulent channel flow.
Equations of Motion
Turbulent flow of a compressible ideal gas (air) including passive scalar transport is governed by the following set of transport equations in Cartesian tensor notation:
, ) q ( ) 1 ( u p p u
p j j j j j j
t =− ∂ −γ ∂ + γ− Φ−∂
∂ (1)
, ) f p ( u u
ui j j i 1 i j ij 1 i1 t =− ∂ −ρ ∂ −∂τ − δ
∂ − (2)
∂ts=−uj∂js+(R/p)(Φ−∂jqj), (3)
, ) D ( uj j 1 j j tξ=− ∂ξ+ρ ∂ ρ ∂ξ
∂ − (4)
where p,ui,s,ρ,ξ represent pressure, Cartesian velocity components, entropy, density and concentration of a passive scalar, respectively and ∂t,∂i denote temporal and spatial derivatives. This special set of variables has been chosen, in order to compute the relevant modes of compressible turbulence, namely ‘pressure, entropy and vorticity’ as ‘directly’ as possible. A vorticity transport equation has been avoided here, since two of the vorticity boundary conditions cannot be formulated exactly. The body force f1
δ
i1 in equation (2) will be specified later in such a way that it
replaces the mean streamwise pressure gradient. In equations (1-3) the components of the heat flux vector qj, the viscous stress tensor
, ij
τ and the dissipation rate Φ, read:
, s 3 / 2 s 2 ,
T
qj=−λ∂j τij= µ ij− µ kkδij (5)
Φ=τijsij, sij=1/2(∂jui+∂iuj). (6)
The thermal equation of state
, c c R , T R
p=ρ = p− v (7)
and the following laws for dynamic viscosity µ, heat conductivity λ and diffusivity D close the set of equations:
. 7 . 0 n , c S / D , r P / c , ) T / T (
/µref = ref n λ=µ p =µ ρ =
µ (8)
The Prandtl number Pr, the Schmidt number Sc and the ratio of specific heats γ are kept at constant values in the temperature and concentration ranges considered, namely Pr = 0.7, Sc = 1.0, γ = cp / cv = 1.4.
Numerical Method and Computational Details
The equations of motion (1-4) are cast in a characteristic non-conservative form, following Sesterhenn (2001), which allows to formulate wall and free boundary conditions consistently with the
field equations. A 5th-order compact upwind scheme of Adams and Shariff (1996) is used to discretize the hyperbolic (Euler) terms in the equations of motion. The molecular transport terms are discretized with a compact 6th-order scheme of Lele (1992). The solution is advanced in time with a 3rd-order ‘low-storage’
Runge-Kutta scheme, proposed by Williamson (1980).
The body force term f1δi1 in the momentum equation is introduced in order to replace the mean pressure gradient in streamwise direction. It is uniform in 3D space and allows to handle fully developed turbulent flow using periodic boundary conditions for all variables in stream- and spanwise directions. A mean scalar gradient is imposed on the flow, using an initial profile of the form (Johansson, 1999):
. 007 . 1 y
, 1 y
1 y og l x y
x y og l ) 0 , x , x , x (
0
0 0 10 2 0
2 0 10 3
2 1
=
− +
− + =
ξ
(9)
At the walls the velocity components satisfy no-slip and impermeability boundary conditions. The passive scalar is injected at the lower wall ( x2 = 0 ) with vanishing momentum and removed
through the upper wall. Its boundary conditions, hence, read:
. 1 ) t , x , h 2 , x ( , 1 ) t , x , 0 , x
( 1 3 = ξ 1 3 =−
ξ (10)
For a solid isothermal and stationary wall the pressure and entropy boundary conditions have the form:
, ) X X ( ) c 2 ( / p
p 2 2
t =− ++ −
∂ (11)
. ) X X ( ) c 2 ( / R
s 2 2
t = ++ −
∂ (12)
They follow from Gibbs’ fundamental relation and the momentum balance in the wall normal direction, which reads in characteristic form:
, j 2 j 2
2 X (2/ )
X+= −+ ρ ∂τ (13)
using ‘waves’ defined by:
) u p ) c ( ( ) c u (
X2±= 2± ρ −1∂2 ± ∂2 2 (14)
2 / 1 ) / p (
c= γ ρ is the speed of sound. The boundary conditions (11) and (12) show explicitely that pressure and entropy evolve in time at the wall. A possible way of initializing compressible turbulent channel flow, is as follows: A mean streamwise velocity profile is specified according to a linear law between the wall and
10 / u x
The numerical algorithm has been previously validated by Lechner et al. (2001) whose results for a Mach number M = 1.5 case are in excellent agreement with those of Coleman et al. (1995). The present paper reports on five direct numerical simulations for different Reynolds and Mach numbers. The global Mach and Reynolds numbers for fully developed turbulent channel flow are defined as
w av m w
av/c , Re u h/
u
M= =ρ µ (15)
The speed of sound and the dynamic viscosity are evaluated at a wall temperature which has the constant value Tw = 500 K in all
cases. The bulk-averaged density and velocity read
dx /h, u u dx2/h
1
01 av 2
1
0
m=
∫
ρ =∫
ρ (16)
The overbar denotes Reynolds averaged quantities to be defined below. Table 1 summarizes the flow parameters, box sizes and numbers of grid points used in the different direct simulations. Equidistant grids are chosen in the (x1, x3)-, i.e. the streamwise and
spanwise directions of the channel. In the wall-normal x2 –
direction, points are clustered using tanh-functions (Lechner et al., 2001). The friction Reynolds number Reτ =
ρ
w uτ h / ✂ w , with uτ = (τ
w /
ρ
w)1/2 , is a result of the computation. Note, that for spatial and
velocity coordinates the following notations are used alternately, (x1,
x2, x3)↔ (x, y, z), (u1, u2, u3)↔ (u, v, w).
Table 1. Flow and computational parameters.
Case M Re Reτ Lx1/h Lx2/h Lx3/h
M0.3 0.3 2820 181 9.6 2 9.6
M0.4 0.36 10121 550 6.4 2 2
M1.5 1.5 3000 221 4π
2 4π
/3
M3.0 3.0 6000 556 4π
2 4π
/3
M3.5 3.5 11310 1030 6π
2 4π
/3
Nx1 Nx2 Nx3 ✝ x1+ ✝ x2min+ ✝ x2max+ ✝ x3+
192 129 160 9.12 1.02 4.21 6.84
512 192 462 6.75 0.675 3.96 5.65
192 151 128 14.46 0.84 5.02 7.23
512 221 256 13.65 0.89 9.38 8.91
512 301 256 37.89 1.27 13.35 16.85
Statistical Equations for Fully Developed Channel Flow In this section we define statistical and fluctuating quantities and present the statistically averaged equations of motion for fully developed channel flow as well as transport equations for the Reynolds stresses and the turbulent scalar fluxes. It is common practice to work with Reynolds- and Favre-averaged, i.e. mass-weighted averaged quantities simultaneously. Velocity components and temperature are decomposed in the following way:
, / u u ~ , u u ~ u u
ui= i+ ′i= i+ i′′ i=ρ i ρ (17)
. / T T ~ , T T~ T T
T= + ′= + ′′ =ρ ρ (18)
Density, pressure, entropy (and the molecular transport coeffi-cients) follow Reynolds’ decomposition:
T T
T ( ,p,s) ( ,p,s) )
s , p ,
(ρ = ρ + ρ′ ′ ′ (19)
The statistical operation, represented by the overbar, is achieved by averaging in the streamwise and spanwise directions, i.e. over 512*256 mesh points (case M3.5) and in time. A typical number of statistically independent time samples is 103 for basic quantities,
like mean velocity, pressure, density, and 104 for correlations like the Reynolds stresses.
Mean Balance Equations
Considering the above decompositions and the fact that fully developed channel flow leads to the following balance equations for mean streamwise momentum and scalar
, 0 ) ... ( x ) ... ( x , 0 u ~ u ~ , ) x ( u ~ u ~
3 1
3 2 2 1
1 ∂ =
∂ = ∂
∂ = =
= (20)
(
uu)
f ,x
0 12 1 2 1
2
+ ′′ ′′ ρ − τ ∂
∂
= (21)
. u x Sc x
0 2
2
2
′′ ξ′′ ρ − ∂
ξ ∂ µ ∂
∂
= (22)
In equation (21) the mean body force, f , replaces the mean 1 pressure gradient and is related to the wall shear stress in the following way:
. h x
p
f w
1 1
τ = ∂
∂ −
= (23)
Integrating equations (21-22) from the wall (x2 = 0) to a position
in between the wall and the centreline, taking care of the fact that the solid wall inhibits all turbulence fluctuations and that correlations involving fluctuations of viscosity and diffusivity are negligibly small, provides the following balances for the shear stresses and scalar fluxes:
, h x 1 u u
x d
u
d 2
w 2 1
2 1
w
− = τ
′′ ′′ ρ − µ
µ
+ +
(24)
1 u x
d d Sc
1
w 2
2 w
= χ
′′ ξ′′ ρ − ξ µ
µ
− ++ (25)
The ‘+’ indicates normalization with wall units, namely the friction velocity, uτ , the viscosity at the wall,
ν w , and the scalar fluctuation, ξ
τ, defined via the scalar flux at the wall, χ w, as
. u x
Sc 2 w w
w ∂ =−ρ τξτ
ξ ∂ µ =
χ (26)
From (24) we conclude that the sum of the viscous and Reynolds shear stresses varies linearly in the channel, decreasing from its wall value to zero at the centreline. (25) indicates that the sum of molecular and turbulent scalar fluxes is constant. Unlike the viscous stress, the molecular scalar flux is non-zero at the centreline, which leads to considerable production of scalar fluctuations in the channel core. The mean balance of the total enthalpy, ρ H = ρ e + p +
ρ u
(
u q)
.x H u x H u
x1 1 2 2 ∂ 2 iτi2− 2 ∂ = ρ ∂ ∂ + ρ ∂ ∂ (27)
The first term on the l.h.s. is non-zero since it contains the mean pressure gradient. Obviously,
. x p u H u x 1 1 1 1 ∂ ∂ = ρ ∂ ∂ (28)
All the other streamwise gradients of mean quantities and correlations vanish. Now, integrating equation (27) from the wall to the centreline and using symmetry conditions for flow variables and correlations, provides the interesting relation
, u x d x p u
q 2 w av
h
0 1
1
w ∂ =−τ
∂
=
∫
(29)which states that the work done by the mean pressure gradient in one half of the channel corresponds to the heat that leaves the channel through the isothermal wall. In other words, in order to achieve supersonic velocities in a channel, the walls have to be cooled. Adiabatic walls do not allow for supersonic flow and lead to choking.
Budgets of the Reynolds Stresses, the Scalar Fluxes and the Scalar Variance
In order to analyze effects of compressibility on second-order moments of turbulent fluctuations, one has to study their transport equations. These equations contain higher-order correlations and are, hence, unclosed. It is a real challenge for turbulence modellers to develop proper models which relate unknown higher-order correlations to known correlations and variables. DNS helps to test these models and to improve them. The transport equations for the streamwise and spanwise components, ρR11/2, ρR33/2, and the
Reynolds shear stress, ρR12 read:
, x u x u p x p dx d u u 2 / u u dx d dx u ~ d u u 0 j 1 j 1 1 1 1 2 12 1 12 1 2 2 1 2 2 1 2 1 ∂ ′ ∂ τ′ − ∂ ′ ∂ ′ + ∂ ∂ − τ ′′ +
ρ ′′ ′′ − ′τ′
− ′′ ′′ ρ − = (30) , x u x u p dx d u u 2 / u u dx d 0 j 3 j 3 3 3 2 32 3 32 3 2 2 3 2 ∂ ′ ∂ τ′ − ∂ ′ ∂ ′ + τ ′′ +
ρ ′′ ′′ − ′τ′
− = (31) . x u x u x u x u p x p dx d u x p dx d u u u p u u u dx d dx u ~ d u 0 j 2 j 1 j 1 j 2 1 2 2 1 1 2 12 2 2 2 22 1 12 2 22 1 1 1 2 2 2 2 1 2 2 ∂ ′ ∂ τ′ − ∂ ′ ∂ τ′ − ∂ ′ ∂ + ∂ ′ ∂ ′ + ∂ ∂ − τ ′′ + ∂ ∂ − τ ′′ +
ρ ′′ ′′+ ′ ′− ′τ′ − ′τ′
− ′′ ρ − = (32)
They state that there is no mean convective transport of the Reynolds stresses in fully developed flow. The r.h.s. of eq. (30) contains production of the streamwise Reynolds stress by the action of the shear stress (first term), turbulent and viscous transport
(second term), intrinsic compressibility by streamwise turbulent mass-flux, , / u / u
u1′′=−ρ 1′ ρ=−ρ′ 1′ ρ (33)
energy loss by redistribution (fourth term) and dissipation (last term). The spanwise Reynolds stress (eq. (31)) is modified by turbulent and viscous transport as well (first term on the r.h.s.), by streamwise turbulent mass flux which is, however, weak. It is not directly produced, but receives energy from the streamwise component by redistribution (third term) and looses energy by dissipation (last term). The Reynolds shear stress balance (eq. (32)) contains corresponding terms. The most important ones are production, redistribution and turbulent transport. Viscous diffusion and dissipation nearly balance in the wall layer.
The derivation of transport equations for the scalar fluxes and the scalar variance proceeds similarly to that of the Reynolds stresses. Again there is no mean convective transport in fully developed channel flow. The equations for the streamwise and wall-normal turbulent scalar fluxes are:
, x u x Sc x x p x u Sc dx d u u x d d dx u ~ d u dx ~ d u u 0 j 1 j j j 1 1 12 2 1 2 2 1 2 2 1 2 2 2 1 ∂ ′′ ∂ ∂ ξ ∂ µ − ∂ ξ′′ ∂ τ′ − ∂ ∂ ξ′′ − τ ξ′′ + ∂ ξ ∂ ′′ µ + ξ′′ ′′ ′′ ρ − ′′ ξ′′ ρ − ξ ′′ ′′ ρ − = (34) . x u x Sc x x p x u Sc dx d u x d d dx ~ d u 0 j 2 j j j 2 2 22 2 2 2 2 2 2 2 2 2 ∂ ′′ ∂ ∂ ξ ∂ µ − ∂ ξ′′ ∂ τ − ∂ ∂ ξ′′ − τ ξ′′ + ∂ ξ ∂ ′′ µ + ξ′′ ′′ ρ − ξ ′′ ρ − = (35)
Both fluxes are primarily produced by mean scalar gradients, the streamwise scalar flux in addition by the mean velocity gradient. Both balances contain turbulent and viscous transport terms, scalar gradient correlations (the analogues of velocity pressure-gradient terms in the Reynolds stress transport equations) and, finally, destruction terms due to viscous and diffusion effects. The
transport equation for the scalar variance, ρξ′′2/2, reads:
. x x Sc dx ~ d x Sc dx ~ d Sc x 2 / Sc dx d 2 / u x d d dx ~ d u 0 j j 2 2 2 2 2 2 2 2 2 2 2 ∂ ξ′′ ∂ ∂ ξ′′ ∂ µ − ξ ∂ ξ′′ ∂ µ − ξ ξ′′ µ + ∂ ξ′′ ∂ µ + ξ′′ ′′ ρ − ξ ′′ ξ′′ ρ − = (36)
Scalar fluctuations are produced by the mean scalar gradient alone. If the mean flow were accelerated or retarded, there would be a production term by mean dilatation as well. We further note that turbulent transport of scalar fluctuations and viscous diffusion as well as dissipation contribute to the dynamics of scalar fluctuations. Diffusion and dissipation consist of two terms, respectively, where the terms involving correlations between ‘viscosity’ and scalar fluctuations are generally small.
DNS Results
pressure-strain and pressure-scalar-gradient correlations. Wherever possible, we use comparisons with DNS data of incompressible channel flow for a better understanding of the high-speed physical mechanisms.
Mean Flow Properties
Compressibility effects in fully developed channel flow originate mainly from the large changes in fluid properties, ρ and µ, caused by viscous heating. Figure 1 shows profiles of these quantities for four Mach number cases listed in Table 1. The increase in mean temperature in the channel core as a result of mean and turbulent dissipation, leads to a steep rise in viscosity and entails a simular decrease in mean density. Given the fact that the mean wall-normal pressure gradient is negligibly small, corresponding density and temperature gradients are equal in magnitude, but opposite in sign. From the averaged ideal gas law, we obtain, neglecting the contribution from the density-temperature correlation:
2
2 dx
d 1 x d
T d T
1 ρ
ρ ≅
− (37)
Equation (37) also contains the assumption that the wall-normal mean pressure gradient resulting from the wall-normal momentum balance
−ρ ′′ −τ
∂ ∂ −
= 22 22
2 u p x
0 (38)
is small. In (38), τ22≈4/3µdu2/dx2.
Figure 1. Variation of mean density (symbols) and mean viscosity (lines), both normalized with wall values.
Figure 2 contains profiles of the Van Driest transformed mean velocity
1 u
0 w
VD ,
1 du
u
∫
1+
ρ ρ =
+ (39)
in a semi-logarithmic plot. This transformation provides a reasonable collapse of the various cases in the outer region alone and there seems to be no way of finding a single transformation which does a good job in the inner as well as the outer layer. Neglecting the turbulent fluxes in equations (24) and (25), we get for the viscous sublayer:
µ µ = µ
µ = ξ
− ++ ++ w
2 1 w
2 dx
u d , Sc x
d d
(40)
and after integration
. u Sc 1
w + +
+ −ξ =
ξ (41)
Equation (40) suggests the following transformed velocity and scalar in the viscous sublayer:
. d
Sc 1 x u d
u v
w 2
1 u
0 w
v , 1
w
1 ξ + +
ξ +
+
+ ξ =ξ
µ µ −
= = µ
µ
=
∫
∫
+ + +
(42)
Figure 3 shows both, the Van Driest- and the viscosity-transformed mean velocities.
Figures 4 and 5 present profiles of the local Mach number,
w 1/c u
M= , and the mean scalar, normalized by ξ
w. From
equation (41) we conclude that ξvaries linearly in the viscous sublayer, when plotted against the variable
. dx
x 2
x
0 w 2
2 +
+
µ
∫
+
µ µ
= (43)
In the core region, where µ µw and ρξ′′u2′′ χw both reach a plateau, i.e. nearly constant values, we note that
(
1 u)
h(
1 x h)
Sc µw +ρξ′′ 2′′ χw − 2 µ
≈
ξ+ + (44)
varies linearly with x2.
The Turbulent Stress Tensor
At sufficiently large distances from the wall, where the viscous stress is small at high Reynolds numbers, the shear stress balance, eq. (24), allows to conclude that the quantity ρR12 τwis
Figure 3. Profiles of the Van Driest- and viscosity-transformed mean velocity, eq. (42).
Figure 4. Profiles of the local Mach number M=u1/cw.
a linear function of x2 h, independent of Mach and Reynolds number. In other words, τw, is the proper outer scaling parameter which collapses compressible and incompressible cases on to a universal profile, see Figure 6. Incompressible channel flow data of Moser et al. (1999) at Reτ=180,395,and590, denoted by cases I1,
I2, and I3, respectively, have been used for comparison. Note that the
Reτ values are similar between cases M0.3, M1.5 and I1, and between cases M3.0 and I3.
Figure 5. Profile of the mean scalar ξ
normalized by w
ξ
. □ shows data of
Johansson et al. (1999).
In Figure 6, cases M0.3 and I1 are practically indistinguishable.
Given the fact that cases M3.0 and I3 have similar Reynolds
numbers, Re , the differences between their τ
Figure 6. Outer scaling of the Reynolds shear stress, ρ R12 .
Figure 7. Outer scaling of the turbulent streamwise stress, ρ R11 .
profiles in the wall layer are due to mean property variations. The linear behaviour of ρR12
(
M3.0)
starts at x2 h〉0.3 only, while that of ρR12( )
I3 starts at x2 h〉0.1 already, because temperature and hence viscosity µ increase with increasing x2, extending theimportance of the viscous stress to larger distances x2. Another
observation which is not demonstrated here, is the independence of
the correlation coefficient of ρu1′′u2′′ from Mach and Reynolds numbers for x2 h〉0.3. From this additional fact we are allowed to conclude that ρR11 τw and ρR22 τw, finally all Reynolds stresses, tend to a universal dependence on x2 h sufficiently far
from the wall, see Figure 7.
The Turbulent Scalar Fluxes and the Scalar Variance
The molecular scalar flux, being non-zero everywhere in the channel, makes χ
w not an ideal, but a reasonable outer scale of the
turbulent scalar flux in wall-normal direction. Figures 8 and 9 demonstrate that this is true in the range of x2 h〉0.6 for the
streamwise scalar flux as well, irrespective of Mach and Reynolds numbers.
There is a striking similarity in the behaviour of the streamwise
( )
(
)
term viscous x
p
u u x d
d u u x x d
u ~ d u u Dt
D
2 1 2 j 1 j 2 1 2 1
+ ∂
′ ∂ −
= ′′ ′′ ρ − ′′ ′′ ρ ∂
∂ + ′′ ρ + ′′ ρ
(45)
( )
( )
term . diff
u x d
d u x x d
~ d u Dt
D
2 2 j j 2
2 ∂ ρξ′′ ′′ − ρξ′′ ′′ = ∂
+ ξ ′′ ρ + ξ′′ ρ
(46)
where D Dt=∂ ∂t+~u1∂ ∂x denotes the substantial derivative based on mean convective transport. The viscous and diffusion terms have not been written out, because we intend to discuss the large scale turbulent effects.
Figure 8. Profiles of the wall-normal scalar flux u2ξ
ρ
′′
′′ , normalized by w
χ
.
In both equations there are very similar production and turbulent transport terms (2nd and 3rd terms on the l.h.s.) and effects by mean
turbulent transport. The only difference between both equations is the fluctuating streamwise pressure gradient. As will be shown later, the importance of this term is substantially reduced due to compressibility. The same is true for the production terms in the wall layer. Hence, the higher the Mach number, the stronger is the similarity between u1′′ and ξ′′.
Figure 9. Profiles of the streamwise scalar flux u1ξ
ρ
′′
′′ , normalized by w
χ
.
Figure 10. Profiles of the r.m.s. scalar fluctuations ξ 2
′′ , normalized by w
ξ
= ξ
d.
In Figure 10 we present profiles of the r.m.s. scalar fluctuations, normalized by ξw. These profiles reveal peaks in the wall layer and maxima at the channel centreline which are due to non-zero gradients of the mean scalar, cf. Figure 5. Effects similar to those for the streamwise Reynolds stress (and the turbulent kinetic energy, not shown here) can be observed, namely: an increase in Reynolds number intensifies the near-wall peak. A simultaneous increase in Mach number lowers it again, so that eventually these effects compensate each other.
Budgets of Second-Order Moments
Reynolds stresses: Terms in the transport equations for the
Reynolds stresses, ρRij, when normalized with ρwu4τ νwand
plotted as functions of x , which is customary for incompressible +2 flow, do not show a tendency to collapse incompressible and compressible data. Hence, an alternate inner scaling is required. This is obtained by considering the kinetic energy production term, P11 of the ρR11-balance. Away from the viscous layer, the Reynolds shear stress scales as −ρR12=τw
(
1−x2 h)
, while themean shear is du~1 dx2≅uτ∗
(
κx2)
(where u∗τ= τw ρ), so that. u x x , h
1 x
1
P 2 2
2 2
w = ν
− κ µ τ
= ∗ ∗ ∗ ∗τ (47)
Equation (47) implies that the Reynolds stress budgets should be
normalized with τ2w µand plotted against the semi-local
coordinate,
x
∗2. Figure 11 shows profiles of the terms in the11 R
ρ -balance, normalized accordingly. The dominant terms in the near-wall region, namely, production, dissipation and viscous diffusion do not change significantly between cases M3.0 and I3.
However, as shown in Figure 11 (bottom), the pressure-strain correlation,
), u u ( p s p
2 ij j i i j ij= ′ ′ = ′ ∂ ′+∂ ′
Π (48)
quantitative explanation of this behaviour is given below, based on an analysis of the Poisson equation for the pressure fluctuations.
Figure 11. Budget of the ρ R11
-stress, normalized by ✁
2 w
τ
and plotted against the semi-local coordinate x . Symbols represent the ∗2 incompressible case I3 and lines the compressible case M3.0. Top: Production, dissipation and diffusion. Bottom: Pressure-strain, turbulent diffusion and mass flux variation.
In Figure 12 we demonstrate for Π11andΠ33that τwuav h are outer scaling parameters, which collapse compressible onto incompressible pressure-strain correlation data.
Figure 12. Pressure-strain correlation: Streamwise 11-component (top), Spanwise 33-component (bottom).
Figure 12. (Continued).
Scalar fluxes and scalar variance: A suitable normalization of the streamwise and spanwise scalar flux balances must be found. The streamwise scalar flux balance e.g. has two production terms, see eq. (34). They scale outside the viscous layer as:
, u 1 h x 1 u
x d
d u u x d
~ d u u
w 2 2
2 w
2 2 1 2 2 1
χ ′′ ξ′′ ρ +
− ξ µ τ −
= ξ ′′ ′′ ρ − ≅ ξ ′′ ′′ ρ −
∗ ∗
τ τ
(49)
. u
x 1 Sc
1 u u x u x d
u ~ d u
w 2
2 2
w 2 2 2 1
2 χ
′′ ξ′′ ρ κ ξ µ τ = ′′ ξ′′ ρ κ − ≅ ′′ ξ′′ ρ
− ∗
τ τ ∗
τ (50)
As long as the Schmidt number is 1 or O(1), the streamwise
scalar flux budget has to be normalized with τ2w µ
(
ξτ uτ)
. This scaling again underlines the similarity between u1- and ξ -fluctuations. The production term for the wall-normal scalar flux in eq. (35) scales as shown in eq. (49). Finally, we obtain for the scalar variance production:. u 1 u Sc
1 u x
d ~ d u
w 2
w 2 2
2 w
2
2
χ ′′ ξ′′ ρ + χ
′′ ξ′′ ρ
ξ
µ τ − ≅ ξ ′′ ξ′′ ρ −
τ
τ (51)
Obviously, the scaling parameters differ from those for the wall-normal scalar flux only by the factor ξτ u . τ
Upper bounds of production rates: It is interesting to compute the high Reynolds number limits of the peak production rates of the streamwise Reynolds stress (respectively the turbulent kinetic energy) and the scalar flux and to compare them with their incompressible counterparts. In the limit of high Reynolds number,
τ
+=Re
h , the shear stress balance (24) takes the form:
. x d
u d 1 u u
2 1
w w
2 1
+ +
µ µ − = τ
′′ ′′ ρ
− (52)
The spatial extremum of P11 is obtained from
, 0 x d
u d u u x d
d x d
u ~ d u u x d
d
2 1
w 2 1
2 2 1
w 2 1
2
=
τ ′′ ′′ ρ − ≅
τ ′′ ′′ ρ
− ++ + ++
which becomes, using (52):
. x d
u d
dx d
x d
u d 1 2 1
x d
u d
2 2
1 2
2 w 2
2 1
2 1
w
µ µ
− = µ
µ
+ + +
+ + +
+
(54)
For channel flow with wall-cooling, the term in the bracket again adds to a quantitiy larger than 1, since the derivative of µ,is
positive and the second derivative of u is negative. Hence, 1+
. 2 1 x d
u d
2 1
w
〉
µ µ
+ +
(55)
The corresponding relations for incompressible channel flow are:
. 2 1
u u u
x d
u d
2 2 1
2
1 =− ′ ′ =
τ + +
(56)
We therefore conclude that in compressible (isothermal) channel flow between cooled walls, the Reynolds shear stress, ρR12, and
the peak production of ,ρR11, are reduced with respect to incompressible isothermal flow as a result of viscous heating. The upper bound (Reτ→∞) for the peak production rate of ρR11 is:
.
4 1
x d
u d u u
Re 2 1
w 2
1 ≤
τ ′′ ′′ ρ −
∞ → + +
τ
(57)
The equal sign is valid for incompressible flow. In a similar way, we obtain the upper bound for the production rate of the scalar variance from:
0,
x d d u
x d
d
2 w
2
2
=
ξ
χ ′′ ξ′′ ρ
− ++
+ (58)
using the approximation, ~ξ≅ξ. Substituting eq. (25) into condition (58), we get:
. x d d dx d x d d Sc
1 1 2 1 x d d Sc
1
2 2 2
2 w 2
2 2
w
ξ µ µ
ξ
+ = ξ µ
µ
− ++ ++ + ++ (59)
Obviously, the molecular scalar flux is increased due to viscous heating in compressible flow, as compared to incompressible flow. Since the term in the brackets is greater than one, we have
2 1
x d d Sc
1
2 w
〉
ξ µ
µ
− ++ (60)
while in incompressible isothermal flow
.
2 1 x d d Sc
1
2 = ξ
− ++ (61)
The upper bound (Reτ→∞) for the peak production rate of the scalar variance therefore reads:
. Sc 4 1 x
d d u
Re 2 w
2 ≤
ξ
χ ′′ ξ′′ ρ −
∞ → + +
τ
(62)
Again, the equal sign holds for incompressible isothermal flow. Viscous heating in compressible flow consequently reduces the production rate of the scalar variance in a similar way as it reduces the streamwise Reynolds stress production.
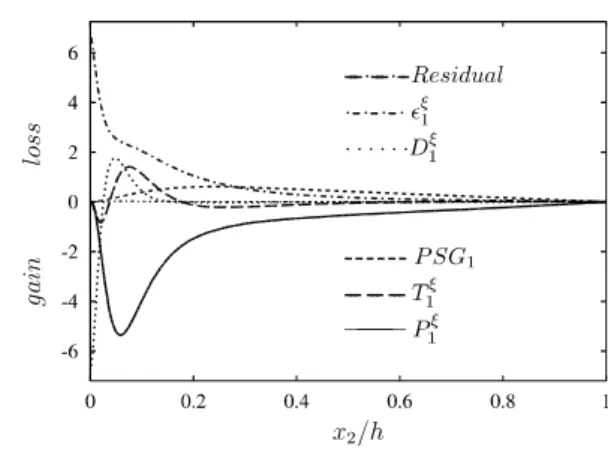
Figures 13-15 show budgets of ρξ′′u1′′,ρξ′′u2′′ and ρξ′′2 2 as functions of x2 h for case M3.0. It is obvious that production and
dissipation play an important role in the budgets of ρξ′′u1′′ and
2 2 ξ′′
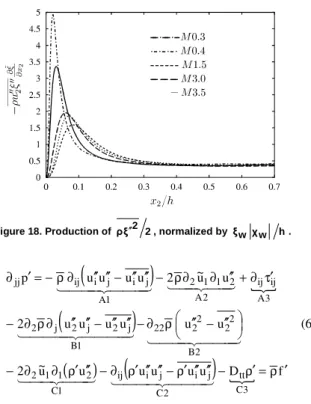
ρ . Dissipation is less important in the wall-normal scalar flux budget. Instead, the pressure-scalar gradient correlation balances the production term there. It also plays a remarkable role in the streamwise scalar flux. As we will see, it is strongly damped in compressible flow, very much like the pressure-strain correlation or velocity-pressure-gradient correlation. Figures 16-18 demonstrate the effect of Mach number on the production rates of
2 1, u u′′ ρξ ′′ ′′ ξ ′′
ρ and ρξ′′2 2. There is a clear decrease of the peak values as M increases and an increase with Reτ.
Finally, we demonstrate the outer scaling of the scalar-pressure
gradient correlations ξ′′∂p ∂x1, ξ′′∂p∂x2 in Figures 19, 20, using
h
uav χw for normalization.
Figure 13. ξ u1
ρ ′′ ′′
-budget, normalized by χ w h av
u . Case M3.0.
Figure 14. ξ u2
ρ
′′
′′ -budget, normalized by χ w h av
Figure 15. Scalar variance budget, normalized by χ w h w
ξ
. Case M3.0.
Figure 16. Production of ξ u1
ρ ′′ ′′
, normalized by χ w h av
u . Case M3.0.
Figure 17. Production of ξ u2
ρ
′′
′′ , normalized by χ w h av
u . Case M3.0.
Correlations Involving Pressure Fluctuations
A quantitative explanation for the reduction of pressure-strain correlations and scalar pressure-gradient correlations due to compressibility starts from an equation for the pressure fluctuations. It is derived from the momentum equation, by taking its divergence and incorporating mass conservation. Splitting flow variables into mean and fluctuating variables, we get the following relation (see Foysi et al. (2004)), valid for fully developed channel flow:
Figure 18. Production of ξ 2 2
ρ ′′
, normalized by χ w h w
ξ
.
(
)
(
)
(
u)
(
uu uu)
D fu ~ 2
u u u
u u u 2
u u ~ 2 u u u u p
3 C
tt 2
C j i j i ij 1
C 2 1 1 2
2 B
2 2 2 2 22 1
B
j 2 j 2 j 2
3 A
ij ij 2
A 2 1 1 2 1
A j i j i ij jj
′ ρ = ρ′ − ′′ ′′ ρ′ − ′′ ′′ ρ′ ∂ − ′′ ρ′ ∂ ∂ −
′′ − ′′
ρ ∂ − ′′ ′′ − ′′ ′′ ∂ ρ ∂ −
τ′ ∂ + ′′ ∂ ∂ ρ − ′′ ′′ − ′′ ′′ ∂ ρ − = ′ ∂
(63)
Note that the operator Dtt=∂tt+2~uj∂jt+~ui~uj∂ijis Galilean
invariant. In incompressible isothermal flow, the first term on the r.h.s. of eq. (63), labelled A1 (nonlinear fluctuation), and the second, A2 (mean shear), survive. In compressible flow, there are additional terms, A3 (viscous stress, third term), B1 (density gradient), B2 (density second-gradient), and the last three terms involving density fluctuations, C1, C2 and C3. From the DNS data base we conclude that all terms involving density fluctuations can be neglected in the above equation. This allows us to interpret eq. (63) as a Poisson equation for the pressure fluctuation.
A Green’s-function based analysis of the Poisson equation for p′ will now be performed. In incompressible flow the exact wall boundary condition for p′ is ∂p′ ∂x2=µ∂2u′2 ∂x22. In compressible channel flow the dilatation fluctuation is small and, hence, the wall boundary condition is given by
2 2 2 2 w
2 u x
x
p′ ∂ ≅µ ∂ ′ ∂
∂ . Let us denote the r.h.s. of eq. (63) by
f′
ρ and Fourier-transform the whole equation in the homo-geneous −
3 1,x
x directions, e.g. p′
(
x1,x2,x3)
→pˆ(
k1,x2,k3)
. Then, the transformed Poisson equation, after normalizing length scales with the channel half width, becomes,(
)
1 x 2 2 2 2 w 1 x 2
2 3 2 1 2 2 2
2
2 x
uˆ x
pˆ with
fˆ pˆ k k x
pˆ
± = ±
= ∂
∂ µ = ∂
∂
ρ = + − ∂
∂
(64)
If we replace ρfˆ in this equation by the point source, δ
(
x2−x′2)
,then the Green function, Gˆ
(
k,x2;x′2)
with k= k12+k23 is thesolution of eq. (64). Gˆ
(
k,x2;x2′)
can be derived for the homo-geneous boundary condition,(
∂pˆ ∂x2)
w=0, using standard(
)
[
(
)
]
[
(
)
]
(
)
[
(
)
]
[
(
)
]
,x x .k 2 sinh k
1 x k cosh 1 x k cosh x
; x , k Gˆ
, x x , k
2 sinh k
1 x k cosh 1 x k cosh x
; x , k Gˆ
2 2 2 2
2 2
2 2 2 2
2 2
′
〉
− +
′ −
= ′
′
〈
+ −
′ −
= ′
(65)
The solution of eq. (64) including the non-homogeneous boundary condition is:
(
)
(
) ( ) (
)
(
k,x)
, Bˆx d k , x , k fˆ x x , x , k Gˆ k
, x , k pˆ
2
2 3 2 1 2 1
1 2 2
3 2 1
+
′ ′ ′
ρ ′
=
∫
− (66)
with Bˆ given by
(
)
(
)
(
(
)
)
. k
2 sinh k
x 1 k cosh x
pˆ x 1 k cosh x
pˆ
Bˆ
2 1
x 2 2 1
x 2
2 2
− ∂
∂ − + ∂
∂
= = =− (67)
The inverse Fourier transform of (66) provides the pressure fluctu-ation in physical space,
(
)
( )
(
)
(
x,x ,x)
, Bx d x ; x , x , x f G x x
, x , x p
3 2 1
2 2 3 2 1 1
1 2
3 2 1 ′ +
′ ′ ′
∗ ′ ρ =
′
∫
− (68)
where the convolution G∗f′is the inverse Fourier transform of
fˆ
Gˆ . From eq. (68) all correlations involving pressure fluctuations can be constructed. The pressure-strain correlation, e.g., is given by
( )
x 2( )
x G f(
x1,x2,x3;x2)
sijdx2 2Bsij, 11 2
2
ij = ρ ′ ∗ ′ ′ ′ ′ + ′ ′
Π
∫
− (69)
and the pressure-scalar-gradient correlation reads
( )
( )
(
)
. x B
x d x x
; x , x , x f G x x
i
2 i 2 3 2 1 1
1 2
2 i
∂ ξ′′ ∂ ′ +
′ ∂ ξ′′ ∂ ′ ′
∗ ′ ρ =
Π
∫
− ξ
(70)
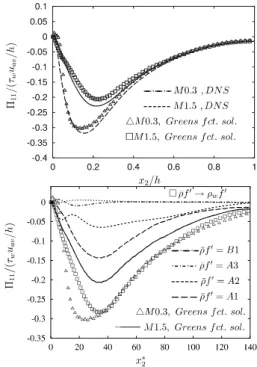
The upper parts of Figures 21 and 22 show a comparison of the analytical solutions, eqs.(69) and (70), and the DNS data for cases M0.3 and M1.5. On the lower parts of these figures we use the various source terms in the pressure Poisson equation and investigate their contributions to the convolution terms in (69, 70). The proof that the changes in the correlations are mainly due to the variation in the mean density is given by replacing ρ by ρw and taking the DNS velocity field of case M1.5 to compute the r.h.s. of equations (69) and (70). The fact that the results (squares in the figures) compare well with the quasi-incompressible case (triangles) in the region x2+〉30, confirms the hypothesis that the variable-density extension of the Poisson equation is sufficient for obtaining the pressure-strain and pressure-scalar-gradient term.
The main result of the Green function analysis, hence, is to underline the non-local effect of ρ on correlations involving pressure fluctuations and to explain the observed reduction of these correlations compared to their incompressible counterparts. The fluid in the interior of a supersonic channel is hotter than that at the cooled isothermal walls so that ρ
( )
x′2 is smaller than the wallvalue and, according to equations (69, 70) are the correlations smaller than the corresponding incompressible ones.
Figure 21. Comparison between DNS data and equation (69) for the pressure-strain correlation (top). In the figure below, symbols illustrate the effect of mean density on Π 11
. Contributions of different source terms, ρ f,
′ to equation (69) are shown by lines for case M1.5.
Figure 22. Comparison between DNS data and equation (70) for the pressure-scalar-gradient correlation (top). In the figure below, symbols illustrate the effect of mean density on
ξ
1
Π
. Contributions of different source terms, ρ f′,
Conclusions
Direct numerical simulations of compressible turbulent channel flow including passive scalar transport have been performed in order to investigate in which way compressibility affects the mean flow quantities and the turbulence structure in wall-bounded flows. The following findings are reported:
- Supersonic, turbulent channel flow exists only when the heat generated by dissipation within the flow field is removed through the walls. This needs wall cooling and entails strong near-wall mean temperature, viscosity and density gradients. - There is no similarity transformation which collapses velocity
profiles for various Mach and Reynolds numbers onto one profile in the whole domain. It is observed that viscosity-transformed mean velocities work well in the near-wall region and density-transformed ‘Van Driest’ velocities are suited for the log layer.
- All the Reynolds stress components scale with the wall shear stress, τ w, in the channel core region, independent of Mach and Reynolds number. In the wall layer, semi-local coordinate scaling at least provides a proper collapse of the positions where most of the turbulence is produced, but not of the amplitudes themselves.
- Other than the mean streamwise velocity, the mean scalar (introduced on one side and removed from the other) has a non-zero gradient on the channel centreline, which leads to a non-zero mean molecular flux and destroys the analogy between the Reynolds shear stress and the wall-normal scalar flux. The mean scalar gradient in turn produces a peak in the scalar fluctuations on the channel centreline.
- The streamwise scalar flux on the other hand scales properly in the core region of the channel with the molecular scalar flux at the wall, χ w.
- The ratio of the wall shear stress squared and the local mean viscosity (τ2w µ) provides a proper scaling for all terms in the Reynolds stress budgets, except the pressure-strain correlation terms. Similarly, the ratio, χwuav h, is unsuited to properly collapse all scalar pressure-gradient correlations. - The reduction in pressure fluctuations observed in the wall
layer of compressible turbulent channel flow that is responsible for the dramatic reduction of pressure-strain and scalar pressure-gradient correlations could be related to the
variation of the mean density normal to the wall. This is demonstrated by a Green’s function approach of the Poisson equation for the pressure fluctuations. These findings should have an impact on the modeling of correlations involving pressure fluctuations.
Acknowledgment
One of the authors (HF) gratefully acknowledges the financial support of the German Research Association (DFG) under grant number FR 478/21-1.
References
Adams, N. A., Shariff, K., 1996, “A high-resolution hybrid compact-ENO scheme for shock-turbulence interaction problems”. J. Comput. Phys. Vol.127, pp. 27.
Coleman, G., Kim, J. and Moser, R., 1995, “Turbulent supersonic isothermal-wall channel flow”. J. Fluid Mech., Vol. 305, pp. 159-183.
Foysi, H., Sarkar, S. and Friedrich, R., 2004, “Compressibility effects and turbulence scalings in supersonic channel flow”. J. Fluid Mech., Vol. 509, pp. 207-216.
Huang, P., Coleman, G. and Bradshaw, P., 1995, “Compressible turbulent channel flows: DNS results and modelling”. J. Fluid Mech., Vol. 305, pp. 185-218.
Johansson, A. V., Wikström, P. M., 1999, “DNS and modelling of passive scalar transport in turbulent channel flow with focus on scalar dissipation rate modelling”. Flow, Turbulence and Combustion, Vol. 63, pp. 223-245.
Kim, J., 1989, “On the structure of pressure fluctuations in simulated turbulent channel flow”. J. Fluid Mech., Vol. 205, 421-451.
Kim, J. and Moin, P., 1989, “Transport of passive scalars in a turbulent channel flow”. Turbulent Shear Flows, Vol. 6. Springer, pp. 85-96.
Lechner, R., Sesterhenn, J. and Friedrich, R., 2001, “Turbulent supersonic channel flow”. J. Turbulence, Vol. 2, pp. 1-25.
Lele, S. K., 1992, “Compact finite difference schemes with spectral-like resolution”. J. Comput. Phys., Vol. 103, pp. 16-42.
Morinishi, Y., Tamano, S. and Nakabayashi, K., 2003, “A DNS algorithm using a B-spine collocation method for compressible turbulent channel flow”. Computers & Fluids, Vol. 32, pp. 751-776.
Moser, R., Kim, J. and Mansour, N. N., 1999, “Direct numerical simulation of turbulent channel flow up to Reτ = 590”. Phys. Fluids, Vol. 9,
pp. 943-945.
Sesterhenn, J., 2001, “A characteristic-type formulation of the Navier-Stokes equations for high order upwind schemes”. Comput. Fluids, Vol. 30, pp. 37.