Cátia Vanessa Maio
Gonçalves
Contribuição da combustão de biomassa na emissão
de poluentes
Contribution of biomass combustion to air pollutant
emissions
Cátia Vanessa Maio
Gonçalves
Contribuição da combustão de biomassa na emissão
de poluentes
Contribution of biomass combustion to air pollutant
emissions
Dissertação apresentada à Universidade de Aveiro para cumprimento dos requisitos necessários à obtenção do grau de Doutor em Ciências e Engenharia do Ambiente, realizada sob a orientação científica da Doutora Célia dos Anjos Alves, Investigadora Auxiliar do Centro de Estudos do Ambiente e do Mar da Universidade de Aveiro e co-orientação do Doutor Casimiro Adrião Pio, Professor Catedrático do Departamento de Ambiente e Ordenamento da Universidade de Aveiro.
Este trabalho foi financiado pela Fundação para a Ciência e Tecnologia através da Bolsa de Doutoramento SFRH/BD/36540/2007 e do Projecto PTDC/AMB/65706/2006.
This work was funded by the FCT
through the PhD grant
SFRH/BD/36540/2007 and the BIOEMI project PTDC/AMB/65706/2006.
o júri / the jury
presidente / president Doutor Jorge Ribeiro Frade
Professor Catedrático da Universidade de Aveiro
vogais / examiner committee Doutor Casimiro Adrião Pio
Professor Catedrático da Universidade de Aveiro (Co-Orientador)
Doutora Maria da Conceição Machado Alvim Ferraz
Professora Auxiliar com Agregação Aposentada da Faculdade de Engenharia da Universidade do Porto
Doutor Luís António da Cruz Tarelho Professor Auxiliar da Universidade de Aveiro
Doutora Maria do Carmo Moreira de Freitas
Investigadora Principal com Agregação Aposentada da Unidade de Reactores e Segurança Nuclear do Instituto Tecnológico e Nuclear (ITN)
Doutor Pedro Salvador Martínez
Investigador do Centro de Investigaciones Energéticas, Medioambientales y Tecnológicas (CIEMAT)
Doutora Célia dos Anjos Alves
Investigadora Auxiliar do Centro de Estudos do Ambiente e do Mar da Universidade de Aveiro (CESAM) (Orientadora)
agradecimentos
A realização deste trabalho não teria sido possível sem a colaboração de algumas pessoas, a quem gostaria de agradecer.
À minha orientadora, Doutora Célia dos Anjos Alves, pela partilha de conhecimentos, inteira disponibilidade, acompanhamento e dinâmica.
Ao Prof. Doutor Casimiro Adrião Pio, meu co-orientador, pela revisão crítica dos artigos que constituem este trabalho e pelas excelentes condições de trabalho proporcionadas.
Ao Doutor Luís Tarelho, à Doutora Teresa Nunes e à Doutora Margarita Evtyuguina por toda a disponibilidade e ajuda ao nível da execução experimental e de laboratório.
Ao Doutor Hans Puxbaum pela oportunidade que foi integrar o seu grupo de trabalho na TU Wien; ao Christoph Schmidl e à Magdalena Rzaca pelos conhecimentos e apoio que me deram ao nível do trabalho laboratorial.
À Dona Manuela Marques e ao Nuno Costa pela disponibilidade para resolver todas as “pequenas questões práticas” que foram surgindo ao longo deste tempo.
À Ana Vicente, à Cristina e Ana Patrícia por todas as horas que passamos a “queimar” e a “injectar” e por todos os momentos bem passados. À Fátima, à Priscilla, à Ana Calvo (que chegou há pouco tempo, mas parece que esteve sempre cá), à Elisabete, ao Alexandre e a todos os outros colegas pelo companheirismo, amizade e boa disposição ao longo destes 4 anos.
A todos os meus amigos pelo interesse e amizade demonstrados ao longo deste percurso.
Aos meus pais e irmão por apoiarem sempre as minhas decisões e estarem sempre presentes em todas as etapas da minha vida.
acknowledgements
The accomplishment of this thesis wouldn’t be possible without the collaboration of some people to whom I would like to acknowledge.
I thank my supervisor, Dr. Célia dos Anjos Alves, for sharing her knowledge, total availability, attendance and dynamism.
I also thank my co-supervisor, Dr. Casimiro Adrião Pio, for reviewing the papers of this thesis and excellent work conditions.
To Dr. Luís Tarelho, Dr. Teresa Nunes and Dr. Margarita Evtyuguina, for their availability and support in the experimental and laboratory procedures.
My acknowledge goes also to Dr. Hans Puxbaum, for the opportunity to be part of his research group at the TU Wien, and to my colleagues Christoph Schmidl and Magdalena Rzaca for their support in the laboratory work at TU Wien. To Mrs. Manuela Marques and Nuno Costa, for solving all the “small practical problems” in the last 4 years.
I also thank my colleagues Ana Vicente, Cristina and Ana Patrícia, for all the “burning and injecting” hours and for all the good moments shared together. To Fátima, Priscilla, Ana Calvo, Elisabete, Alexandre and other colleagues, for their friendship and support during these years.
To all my friends, for showing their interest and friendship during this journey. To my parents and brother, for supporting all my decisions and for being always present in the special moments of my life.
palavras-chave Queima doméstica, Queima de resíduos agrícolas e de jardim, Fogos florestais controlados, Partículas atmosféricas, Gases de combustão, Caracterização química, Traçadores orgânicos, Inquérito ao consumo de biomassa
resumo Em Portugal, estima-se que 1.95 Mton/ano de lenha sejam utilizadas na
queima doméstica para aquecimento e confecção de alimentos. Em simultâneo, nas últimas décadas, a área de floresta ardida também tem vindo a aumentar. Estes tipos de combustão contribuem para a libertação de quantidades elevadas de poluentes tóxicos que perturbam a química da atmosfera, interferem com o clima e possuem efeitos nefastos na saúde. A quantificação rigorosa, à escala regional e global, das emissões de gases e matéria particulada associada à queima doméstica, queima de resíduos agrícolas e fogos florestais é fundamental para vários fins, nomeadamente na investigação dos diversos processos atmosféricos, na elaboração de relatórios de emissões de gases de estufa, e na quantificação de fontes de poluição atmosférica que afectam a saúde humana. No sul da Europa, as bases de dados com factores de emissão detalhados são praticamente inexistentes. Os modelos climáticos, a modelização fotoquímica, os inventários de emissões e os estudos de identificação de fontes emissoras utilizam valores típicos obtidos para biomassa norte-americana ou do norte da Europa. Assim, é conveniente utilizar valores mais específicos obtidos localmente. Este estudo teve como principal objectivo a caracterização e quantificação dos gases e aerossóis emitidos por fontes de queima de biomassa, englobando as espécies lenhosas mais representativas da realidade nacional. Foram realizadas experiências de amostragem em laboratório (queima doméstica) e no campo (queima de resíduos agrícolas/jardim e fogos florestais controlados). Em laboratório, após selecção das espécies de biomassa e dos equipamentos de queima mais representativos em Portugal, estabeleceu-se um programa de amostragem para determinar os factores de emissão de poluentes gasosos e particulados, incluindo a composição orgânica e inorgânica dos aerossóis. Ao nível do campo, efectuou-se a amostragem das plumas de fumo resultantes da queima de resíduos agrícolas/jardim e de fogos controlados numa área dominada por espécies arbustivas. Os resultados deste estudo mostram que o tipo de equipamento de combustão e o tipo de biomassa utilizados têm um papel importante nos níveis e composição dos poluentes emitidos. Diferenças significativas entre o uso de equipamentos de combustão tradicionais versus equipamentos modernos foram observadas. Estas diferenças devem-se à maior eficiência de combustão dos equipamentos modernos, reflectindo-se na menor quantidade de matéria particulada, carbono orgânico e monóxido de carbono libertados. No que diz respeito ao fogo controlado em áreas dominadas por espécies arbustivas observou-se que a fracção orgânica estudada nas amostras de fumo é composta essencialmente por produtos resultantes da pirólise da vegetação.
Estes produtos são constituídos na sua maioria por esteredienos e derivados de esteróis, hidratos de carbono resultantes da quebra das moléculas de celulose, produtos alifáticos provenientes de ceras vegetais e metoxifenóis resultantes da degradação térmica da lenhina. A queima de resíduos agrícolas e de jardim, apesar de ser uma prática proibida no nosso país, é uma realidade bastante frequente. Para avaliar a composição das emissões de alguns tipos de resíduos foram recolhidas amostras de três tamanhos diferentes (PM2.5,
PM2.5-10 and PM>10). Apesar de se poder observar uma grande variabilidade em
termos de compostos orgânicos dependendo do tipo de resíduo queimado, os compostos fenólicos (derivados do polifenol e guaiacil) e os ácidos orgânicos foram sempre predominantes em relação à restante fracção orgânica. O levoglucosano, o β-sitosterol e o fitol foram os traçadores de queima de biomassa detectados em quantidades mais apreciáveis na generalidade dos resíduos agrícolas e de jardim. O inositol pode ser considerado um bom traçador para as emissões resultantes da queima de rama de batata. Observou-se que as condições ambientais (tais como valores elevados de humidade relativa na atmosfera) provavelmente contribuíram para processos de coagulação e de crescimento higroscópico que influenciaram as características dos traçadores de biomassa, mudando sua distribuição para diâmetros maiores. Foi também feita a avaliação do consumo doméstico de biomassa na forma de um inquérito aplicado à escala nacional. Os resultados obtidos, conjugados com as bases de dados sobre factores de emissão obtidas nos ensaios de queima laboratoriais, permitiram estimar as quantidades emitidas de vários poluentes em cada distrito de Portugal continental.
Além de contribuir significativamente para o aperfeiçoamento dos inventários de emissões, os factores de emissão obtidos para vários compostos traçadores poderão ser aplicados em modelos no receptor de forma a avaliar a contribuição da queima de biomassa para os níveis de aerossóis atmosféricas e seus constituintes obtidos em campanhas de monitorização na Europa mediterrânea.
keywords Residential wood burning, Agriculture and garden wastes burning, Experimental wildland fires, Atmospheric particles, Combustion gases, Chemical Characterisation, Organic tracers, Biomass consumption survey.
abstract In Portugal, it was estimated that around 1.95 Mton/year of wood is used in
residential wood burning for heating and cooking. Additionally, in the last decades, burnt forest area has also been increasing. These combustions result in high levels of toxic air pollutants and a large perturbation of atmospheric chemistry, interfere with climate and have adverse effects on health. Accurate quantification of the amounts of trace gases and particulate matter emitted from residential wood burning, agriculture and garden waste burning and forest fires on a regional and global basis is essential for various purposes, including: the investigation of several atmospheric processes, the reporting of greenhouse gas emissions, and quantification of the air pollution sources that affect human health at regional scales. In Southern Europe, data on detailed emission factors from biomass burning are rather inexistent. Emission inventories and source apportionment, photochemical and climate change models use default values obtained for US and Northern Europe biofuels. Thus, it is desirable to use more specific locally available data. The objective of this study is to characterise and quantify the contribution of biomass combustion sources to atmospheric trace gases and aerosol concentrations more representative of the national reality. Laboratory (residential wood combustion) and field (agriculture/garden waste burning and experimental wildland fires) sampling experiments were carried out. In the laboratory, after the selection of the most representative wood species and combustion equipment in Portugal, a sampling program to determine gaseous and particulate matter emission rates was set up, including organic and inorganic aerosol composition. In the field, the smoke plumes from agriculture/garden waste and experimental wildland fires were sampled. The results of this study show that the combustion equipment and biofuel type used have an important role in the emission levels and composition. Significant differences between the use of traditional combustion equipment versus modern equipments were also observed. These differences are due to higher combustion efficiency of modern equipment, reflecting the smallest amount of particulate matter, organic carbon and carbon monoxide released. With regard to experimental wildland fires in shrub dominated areas, it was observed that the largest organic fraction in the samples studied was mainly composed by vegetation pyrolysis products. The major organic components in the smoke samples were pyrolysates of vegetation cuticles, mainly comprising steradienes and sterol derivatives, carbohydrates from the breakdown of cellulose, aliphatic lipids from vegetation waxes and methoxyphenols from the lignin thermal degradation.
Despite being a banned practice in our country, agriculture/garden waste burning is actually quite common. To assess the particulate matter composition, the smoke from three different agriculture/garden residues have been sampled into 3 different size fractions (PM2.5, PM2.5-10 and PM>10). Despite
distribution patterns of organic compounds in particulate matter varied among residues, the amounts of phenolics (polyphenol and guaiacyl derivatives) and organic acids were always predominant over other organic compounds in the organosoluble fraction of smoke. Among biomarkers, levoglucosan, β-sitosterol and phytol were detected in appreciable amounts in the smoke of all agriculture/garden residues. In addition, inositol may be considered as an eventual tracer for the smoke from potato haulm burning. It was shown that the prevailing ambient conditions (such as high humidity in the atmosphere) likely contributed to atmospheric processes (e.g. coagulation and hygroscopic growth), which influenced the particle size characteristics of the smoke tracers, shifting their distribution to larger diameters. An assessment of household biomass consumption was also made through a national scale survey. The information obtained with the survey combined with the databases on emission factors from the laboratory and field tests allowed us to estimate the pollutant amounts emitted in each Portuguese district. In addition to a likely contribution to the improvement of emission inventories, emission factors obtained for tracer compounds in this study can be applied in receptor models to assess the contribution of biomass burning to the levels of atmospheric aerosols and their constituents obtained in monitoring campaigns in Mediterranean Europe.
Table of contents
Chapter 1. General Introduction ... 3
1.1 The atmospheric aerosol ... 4
1.1.1 Biomass burning: Background ... 4
1.1.1.1 Biomass ... 5
1.1.1.2 Burning or Combustion process ... 5
1.1.1.3 Biomass burning process... 6
1.1.2 Biomass burning: Emissions... 6
1.1.2.1 Volatile organic compounds ... 7
1.1.2.2 Particulate organic material ... 8
1.1.2.3 Trace inorganic species ... 9
1.1.2.4 Black carbon or soot ... 10
1.2 Objectives ... 10
1.3 Experimental work ... 11
1.3.1 Biomass selection ... 11
1.3.2 Laboratory and field facilities ... 13
1.3.2.1 Laboratory facilities: Combustion equipments ... 13
1.3.2.2 Field facilities ... 21
1.3.3 Filters treatment ... 22
1.3.4 Organic carbon and elemental carbon measurement ... 23
1.3.5 Anhydrosugars ... 23
1.3.6 Cellulose ... 24
1.3.7 Humic-like substances (HULIS) ... 25
1.3.8 Soluble inorganic ions ... 25
1.3.9 Metals ... 25
1.3.10 Radionuclides ... 25
1.3.11 Organic speciation ... 26
1.3.11.1 Particulate matter extraction ... 26
1.3.11.2 Fractionation ... 27
1.3.11.3 Derivatisation ... 28
1.3.11.4 GC-MS analysis ... 29
1.3.12 Gaseous compounds ... 30
References ... 31
Chapter 2. Characterisation of PM10 emissions from woodstove combustion of common woods grown in Portugal ... 43
Abstract ... 43 2.1 Introduction ... 45 2.2 Experimental ... 45 2.2.1 Wood selection ... 45 2.2.2 Sampling details ... 46 2.2.3 Analytical methods ... 47
2.3 Results and Discussion ... 49
2.3.1 Particulate emissions and carbonaceous content ... 49
2.3.2 Inorganic speciation ... 51
2.3.3 Organic speciation ... 54
2.3.4 Mass balance ... 58
2.4 Conclusions ... 59
References ... 60
Chapter 3. Organic compounds in PM2.5 emitted from fireplace and woodstove combustion of typical Portuguese wood species ... 67
3.2.1 Biomass fuel selection ... 70
3.2.2 Sampling details ... 71
3.2.3 Analytical methods ... 73
3.3 Results and Discussion ... 74
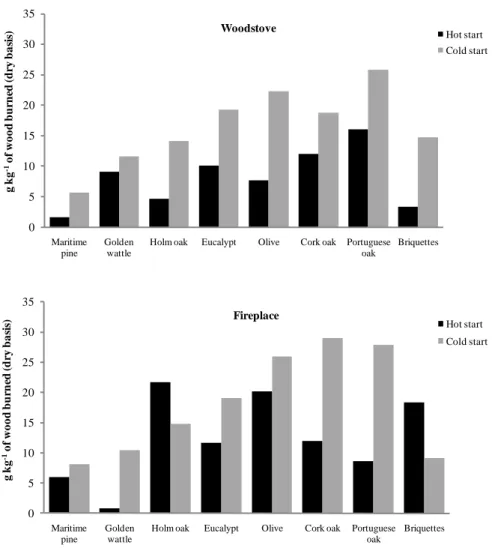
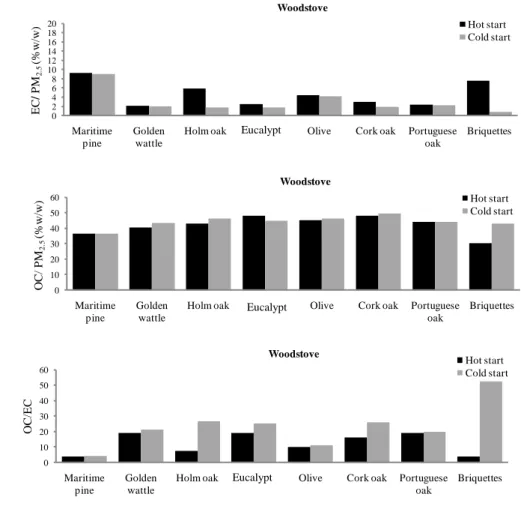
3.3.1 PM2.5 emission factors and carbonaceous content ... 74
3.3.2 Organic speciation ... 80
3.3.2.1 Homologous compound series ... 80
3.3.2.2 Polycyclic aromatic hydrocarbons ... 84
3.3.2.3 Phenolic compounds ... 88
3.3.2.4 Other biomarkers ... 90
3.4 Conclusions ... 95
References ... 97
Chapter 4. Fireplace and woodstove fine particle emissions from combustion of western Mediterranean wood types ... 105
Abstract ... 105
4.1 Introduction ... 107
4.2 Methodology ... 108
4.3 Results and Discussion ... 111
4.3.1 Chemical composition of particle emissions ... 111
4.3.2 Cluster analysis ... 121
4.4 Conclusions ... 123
References ... 124
Chapter 5. Organic particulate emissions from field burning of garden and agriculture residues ... 133
Abstract ... 133
5.1 Introduction ... 135
5.2 Experimental ... 136
5.3 Results and discussion ... 141
5.3.1 Emission factors and carbonaceous content of PM ... 141
5.3.2 PM organic components ... 145
5.3.2.1 Homologous compound series ... 145
5.3.2.2 Polycyclic aromatic hydrocarbons (PAHs) ... 152
5.3.2.3 Phenolic compounds ... 153
5.3.2.4 Biomarkers and other products ... 155
5.3.2.5 Saccharides and polyols ... 156
5.4 Conclusions ... 157
References ... 159
Chapter 6. Particulate organic compounds emitted from experimental wildland fires in a Mediterranean ecosystem ... 169
Abstract ... 169
6.1 Introduction ... 170
6.2 Experimental ... 171
6.3 Results and Discussion ... 172
6.3.1 Carbonaceous content of particles and distribution of major compound groups ... 172
6.3.2 Homologous series and polyaromatic hydrocarbons ... 174
6.3.3 Biomarkers and other pyrolysis products ... 179
6.4 Conclusions ... 187
Chapter 7. Smoke emissions from biomass burning in a Mediterranean shrubland ... 197 Abstract ... 197 7.1 Introduction ... 199 7.2 Experimental ... 200 7.2.1 Sampling details ... 200 7.2.2 Chemical analysis ... 202 7.2.3 Calculations ... 203
7.3 Results and Discussion ... 204
7.3.1 Gaseous species ... 204
7.3.2 Particulate matter ... 210
7.4 Conclusions ... 218
References ... 220
Chapter 8. Inventory of fine particulate organic compound emissions from residential wood combustion in Portugal ... 227
Abstract ... 227
8.1 Introduction ... 228
8.2 Material and Methods ... 229
8.2.1 Survey questionnaire ... 229
8.2.2 Emission factors ... 230
8.2.3 Calculation of emissions ... 236
8.3 Results and Discussion ... 238
8.3.1 Wood consumption ... 238
8.3.2 Estimates of emissions ... 241
8.4 Conclusions ... 249
References ... 250
Chapter 9. General Conclusions ... 257
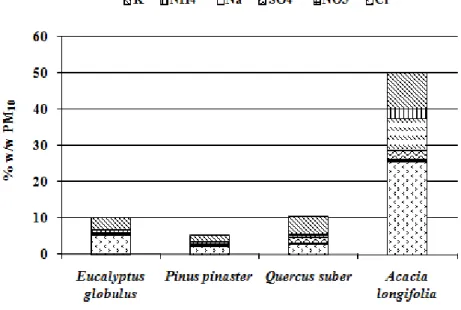
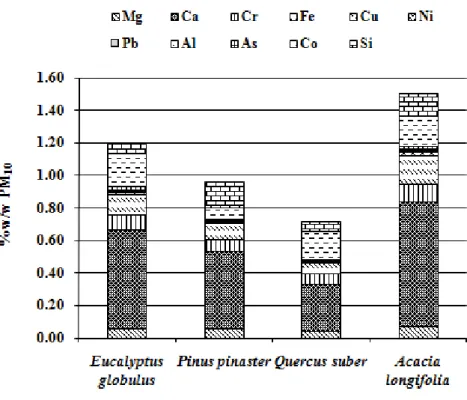
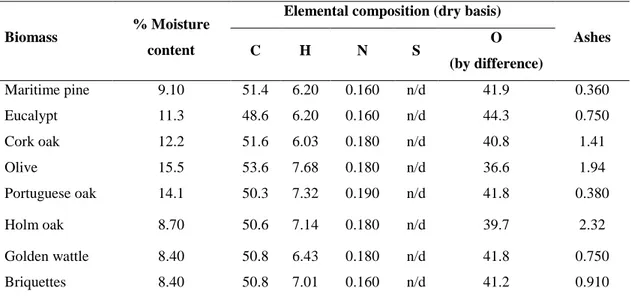
Table 2.1 Portuguese tree species selected for wood stove combustion tests. ... 46 Table 2.2 Elemental composition, ash and moisture content of biofuels (%w/w). ... 46 Table 2.3 Carbonaceous components in wood smoke (%w/w PM10). ... 50
Table 2.4 Radionuclides in wood smoke (Bq kg-1 PM10). ... 53
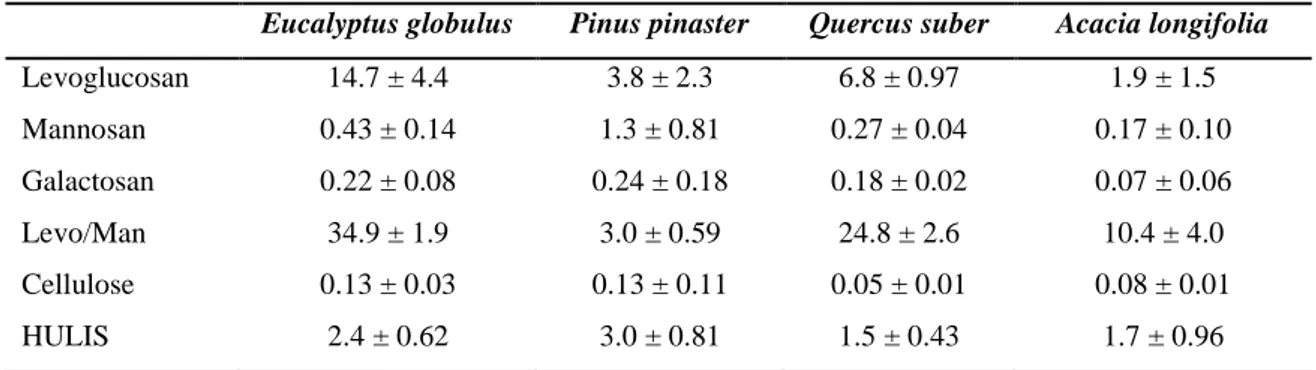
Table 2.5 Anhydrosugars, cellulose and HULIS in wood smoke (%w/w PM10). ... 55
Table 3.1 Elemental composition, ash and moisture content of biofuels (%w/w). ... 71 Table 3.2 Carbonaceous content in smoke particles (minimum and maximum values). ... 77 Table 3.3 PAH diagnostic parameters. ... 87 Table 3.4 OC-normalised concentrations of the most abundant phenolic compounds in the
emissions from the various biomass fuels (mg g-1OC). ... 89 Table 3.5 OC-normalised concentrations of resin acids in the emissions from the various
biomass fuels (mg g-1OC). ... 91 Table 3.6 OC-normalised concentrations of sugars in the emissions from the various biomass
fuels (mg g-1OC). ... 93 Table 4.1 Biomass characteristics. ... 109 Table 4.2 Fine particulate emission factors and chemical composition of selected Portuguese
biomass fuel types. ... 112 Table 4.3 Particle emission factors for different types of combustion appliances. Values are
reported as mg particles emitted per MJ of fuel burnt. ... 113 Table 4.4 Comparison between PM2.5 emission factors and EC mass fractions from this study
and those obtained for an eco-labelled “chimney type” stove burning the same Portuguese wood species. ... 114 Table 4.5 Water-soluble ions in the smoke samples. Values are given in µg mg-1 PM2.5. ... 116
Table 4.6 Major trace elements present in the smoke samples. Values are given in µg g-1 PM2.5. ... 117
Table 5.1 Type of agriculture/garden residues burned. ... 137 Table 5.2 Emission factors, particulate matter concentrations and carbonaceous fractions in
the smoke from the agriculture/garden residue burning. ... 142 Table 5.3 Homologous compound series found in the smoke (µg OC g-1) and diagnostic
parameters. ... 147 Table 6.1 Comparisons of major PAH diagnostic ratios for different sources. ... 177
Table 6.2 Ratios of anhydrosugars in emissions from biomass burning (L – levoglucosan, M – mannosan, G – galactosan). ... 186 Table 7.1 Comparison of carbon measurements of fresh biomass burning smoke (flaming
phase). Values for this study are expressed as mean ± standard deviation. ... 211 Table 7.2 Water-soluble ions (expressed as wt % of particle mass, mean ± standard
deviation) obtained in samples from Lousã Mountain and values from the literature. ... 213 Table 7.3 Potassium and chlorine to elemental carbon mass ratios obtained in different
studies. ... 215 Table 7.4Trace elements (expressed as wt % of particle mass) obtained in samples from
Lousã Mountain and values from the literature. ... 216 Table 8.1 PM2.5, carbonaceous constituents, CO and CO2 emission factors (g kg
-1
biomass burned, dry basis). ... 231 Table 8.2 Phenolic compounds emission factors (g kg-1 biomass burned, dry basis). ... 233 Table 8.3 Resin acids emission factors (g kg-1 biomass burned, dry basis). ... 233 Table 8.4 Anhydrosugars emission factors (g kg-1 biomass burned, dry basis). ... 234 Table 8.5 Phytosterols emission factors (g kg-1 biomass burned, dry basis). ... 234 Table 8.6 PAH emission factors (µg kg-1 biomass burned, dry basis). ... 235 Table 8.7 Wood consumption in mainland Portugal districts. ... 238 Table 8.8 Appliance distribution (%) and wood consumption by appliance (based on survey
responses). ... 239 Table 8.9 PAH emissions by district (t y-1). ... 248
Figure 1.1 Forest distribution in Portugal (%)... 11 Figure 1.2 Biofuels used for the characterisation of combustion emissions in this study. ... 12 Figure 1.3 Schematic representation of the combustion facility, including the modern
woodstove, of Vienna University of Technology. ... 15 Figure 1.4 Schematic representation of the traditional woodstove of University of Aveiro
(Fernandes, 2009). ... 19 Figure 1.5 Schematic representation of the traditional brick fireplace of University of Aveiro
(Fernandes, 2009) ... 20 Figure 1.6 Schematic diagram of the experimental setup. ... 22 Figure 1.7 Extraction process by refluxing dichloromethane... 26 Figure 1.8 Filtration and concentration of the extracts. ... 27 Figure 1.9 Flash chromatography with silica gel and five separate fractions. ... 28 Figure 2.1 PM10 emission factors. ... 50
Figure 2.2 Mass concentration of water soluble ions in wood smoke (%w/w PM10). ... 52
Figure 2.3 Mass concentration of metals in wood smoke (%w/w PM10). ... 53
Figure 3.1 PM2.5 emission factors (dry fuel basis). ... 75
Figure 3.2 Carbonaceous components: elemental carbon (EC), organic carbon (OC) and OC/EC in PM2.5. ... 79
Figure 3.3 OC-normalised concentrations of Σ alkanes in the PM2.5 from the various biomass
fuels. ... 82 Figure 3.4 OC-normalised concentrations of Σ alkenes in the PM2.5 from the various biomass
fuels. ... 82 Figure 3.5 OC-normalised concentrations of Σ alcohols in the PM2.5 from the various
biomass fuels. ... 83 Figure 3.6 OC-normalised concentrations of Σ alkanoic acids in the PM2.5 from the various
biomass fuels. ... 83 Figure 3.7 OC-normalised concentrations of Σ PAHs in the PM2.5 from the various biomass
fuels. ... 85 Figure 3.8 OC-normalised concentrations of PAHs in the PM2.5 from Maritime pine. ... 86
Figure 4.1 Hierarchical clustering (Ward‟s method) of wood combustion source samples (F – fireplace, WS – woodstove). ... 122 Figure 5.1 Schematic diagram of the experimental setup. ... 139
Figure 5.2 Contribution of chromatographically resolved organic compounds to OC in size-segregated particulate matter emissions. ... 146 Figure 5.3 Chromatograms of the aliphatic fraction in PM>10 from burning the same residue
type with and without addition of lubricant oil. ... 149 Figure 5.4 Contribution of organic acids to OC (left panels) and their relative distribution
(right panels). ... 150 Figure 5.5 Contribution of phenolic compounds to OC (left panels) and their relative
distribution (right panels)... 154 Figure 6.1 Contribution of chromatographically resolved organic compounds to OC in the
fine and coarse particle emissions. ... 174 Figure 6.2 Normalised particulate OC emissions of PAH species (Based on the EPA 610
PAH calibration mix). ... 176 Figure 6.3 Contribution of pyrolysis products and biomarkers to OC in smoke particles
(Mannosan and galactosan were quantified using the RRF of levoglucosan; the remaining individual compounds were calibrated using the respective authentic standards). ... 180 Figure 6.4 Mass spectra of sterol derivatives and triterpenic compounds found in smoke
particles. ... 183 Figure 7.1 Comparison of emission factors (given in gram species per kilogram dry matter
burned, mean ± standard deviation) for pyrogenic species. Data source for savannah and tropical forest is Andreae and Merlet (2001). ... 205 Figure 7.2 Correlation between EF (g kg-1, dry basis) of some gaseous species and MCE. ... 206 Figure 7.3 Ion balance and correlation between the excess of positive ions and calcium. ... 214 Figure 8.1 Percentages by district of wood species burned by open appliances (left map) and
closed appliances (right map). ... 240 Figure 8.2 Total PM2.5 emissions by district (t y
-1
). ... 242 Figure 8.3 EC and OC emissions by district (t y-1). ... 244 Figure 8.4 Annual emissions of CO and CO2 by district (t y
-1
List of publications
This thesis is based on the work contained in the following papers:
I. Cátia Gonçalves, Célia Alves, Margarita Evtyugina, Fátima Mirante, Casimiro Pio, Alexandre Caseiro, Christoph Schmidl, Heidi Bauer and Fernando Carvalho, 2010. Characterisation of PM10 emissions from woodstove combustion of common woods
grown in Portugal. Atmospheric Environment 44, 4474-4480.
II. Cátia Gonçalves, Célia Alves, Ana Patrícia Fernandes, Cristina Monteiro, Luís Tarelho, Margarita Evtyugina and Casimiro Pio, 2011. Organic compounds in PM2.5 emitted from fireplace and woodstove combustion of typical Portuguese
wood species. Atmospheric Environment 45, 4533-4545.
III. Célia Alves, Cátia Gonçalves, Ana Patrícia Fernandes, Luís Tarelho and Casimiro Pio, 2011. Fireplace and woodstove fine particle emissions from combustion of western Mediterranean wood types. Atmospheric Research 101, 692-700.
IV. Cátia Gonçalves, Margarita Evtyugina, Célia Alves, Cristina Monteiro, Casimiro Pio and Mário Tomé, 2011. Organic particulate emissions from field burning of garden and agriculture residues. Atmospheric Research 101, 666-680.
V. Célia Alves, Cátia Gonçalves, Margarita Evtyugina, Casimiro Pio, Fátima Mirante and Hans Puxbaum, 2010. Particulate organic compounds emitted from experimental wildland fires in a Mediterranean ecosystem. Atmospheric Environment 44, 2750-2759.
VI. Célia Alves, Cátia Gonçalves, Casimiro Pio, Fátima Mirante, Alexandre Caseiro, Luís Tarelho, Maria Carmo Freitas and Domingos Xavier Viegas, 2010. Smoke emissions from biomass burning in a Mediterranean shrubland. Atmospheric Environment 44, 3024-3033.
VII. Cátia Gonçalves, Célia Alves and Casimiro Pio, 2011. Inventory of fine particulate organic compound emissions from residential wood combustion in Portugal. Atmospheric Environment. Revised manuscript.
BC Black Carbon
BSTFA N,O-bis(trimethylsilyl)-trifluoroacetamide
CCN Cloud Condensation Nuclei
CO Carbon Monoxide
CO2 Carbon Dioxide
CPI Carbon Preference Indices
DCM Dichloromethane
EC Elemental Carbon
EF Emission Factor
EI Electron Impact
GC-MS Gas Chromatography Mass Spectrometry HEPA High Efficiency Particulate Air
HPLC High Performance Liquid Chromatography HULIS Humic-like substances
ICP-MS Inductive Coupled Plasma with Mass Spectrometry
ICP-OES Inductive Coupled Plasma with optical emission spectrometry MCE Modified Combustion Efficiency
MFC Mass Flow Controller
MP Methoxyphenols
ND Not Detected
NMHC Non Methane Hydrocarbons
NOx Nitrogen Oxides
O2 Oxygen
OC Organic Carbon
OM Organic Matter
PAH Polycyclic Aromatic Hydrocarbons
PC Pyrolysed Carbon
PHC Phenolic Compounds
PM Particulate Matter
PM10 Particulate Matter <10µm
PM2.5 Particulate Matter <2.5µm
POM Particulate Organic Matter
RWC Residential Wood Combustion
SO2 Sulphur Dioxide
SPE Solid phase extraction
T Temperature
TC Total Carbon
TMCS Trimethylchlorosilane
TOC Total Organic Carbon
TOE Total Organic Extract
UCM Unresolved Complex Mixture
UV Ultra Violet
VOC Volatile Organic Compounds
3
1
Chapter 1. General Introduction
Planet resources are used by all societies in order to improve their standard of living, a process commonly known as development. However, maintaining the success of this process compels society to ensure that the planet will continue to provide these resources, a practice better known as conservation. The search for a balance between these two concepts is in fact one of the greatest challenges facing Humanity at the present. If the planet is to be more productive and remain agreeable in terms of living conditions and housing, a detailed knowledge is necessary, about the natural and anthropogenic mechanisms and feedbacks with regard to human activities, as well as the processes in which food, water, air quality and many other resources essential to survival, are a direct result.
The anthropogenic activities are so extensively developed that the composition of reservoirs such as the atmosphere has undergone through irreversible changes. In fact, one of the consequences of these changes is the presence of very high concentrations of several pollutants in the atmosphere.
Directing attention to this problem, new goals with respect to renewable energy sources were set by different pieces of legislation. Until 2020, Europe will attempt to employ renewable energy sources in 20% of the total consumption of energy (EREC). The use of biomass for energy production is being promoted to decrease dependence on fossil fuels. However, biomass burning is one of the major sources of atmospheric particulate matter (PM). Additionally, in the last decades, in Portugal, the burnt forest area has also being increasing. It is well known that forest fires are one of the major sources of air pollutants (Ikegami et al., 2001; Lee et al., 2005; Pio et al., 2008; von Hoyningen-Huene et al., 1998). These combustions result in high levels of toxic air pollutants and a large perturbation on atmospheric chemistry, which has significant impacts on human health (Bowman and Johnston, 2005; Lighty et al., 2000; Naeher et al., 2007; Vedal and Dutton, 2006), regional to global air quality (Caseiro et al., 2009; Duck et al., 2007; Favez et al., 2009; Jaffe et al., 2008; Jeong et al., 2008; Legrand and Puxbaum, 2007; Liu et al., 2009; Wang et al., 2007) and climate (Chen et al., 2010; Hobbs et al., 1997; Langmann et al., 2009; Penner et al., 1990; Randerson et al., 2006).
4
1.1 The atmospheric aerosol
An aerosol is generally defined as a suspension of liquid or solid particles in a gas, with particle diameters in the range of 0.001 – 100 µm (Seinfeld and Pandis, 1998). In atmospheric sciences, the term aerosol traditionally refers to suspended particles that contain a large proportion of condensed matter other than water, whereas clouds are considered as separate phenomena (Pruppacher and Klett, 1997).
Atmospheric aerosol particles result from a mixing of natural and anthropogenic sources. Primary particles are directly emitted into the atmosphere from sources such as mineral dust, biomass burning, biological materials, incomplete combustion of fossil fuels and sea salt, among other sources. These particles retain much of the chemical properties of their sources. Secondary particles, on the other hand, are formed by gas-to-particle conversion in the atmosphere, through chemical reactions (nucleation and further coagulation and condensation processes). These particles may undergo great chemical changes. In this study, emphasis will be placed on primary particles, focusing mainly on the identification and quantification of compounds directly emitted from biomass burning.
1.1.1 Biomass burning: Background
Biomass burning emissions have a great expression on the planet. Since pre-historic times (Carboniferous) records of charcoal horizons in sedimentary rocks from forest fires are observed (Simoneit, 2002). Scientific interest in this topic grew when biomass burning began to rival fossil fuel use as a source of atmospheric pollution (Crutzen and Andreae, 1990; Seiler and Crutzen, 1980) and when it became evident that these emissions could affect large areas of the world as a consequence of long-range transport (Kirchhoff and Nobre, 1986; Reichle et al., 1986). Today, biomass burning has become a global problem, due to its broad range of uses: clearing of forests and brushlands for agricultural use, control of pests and weeds, production of charcoal, waste disposal, control of agriculture and garden wastes, energy production, cooking and heating, among others (Bond et al., 2004; Gelencsér, 2004; Simoneit, 2002).
Emissions from the combustion of any type of fuel depend directly on its chemical composition and the combustion conditions.
5
1.1.1.1 Biomass
The most used fuel in combustion processes is the wood. Burned wood comes from different tree species, but is essentially formed by three main components, apart from water (up to 60%). Cellulose is usually the major compound containing linear polymers of 7000-12000 D-glucose units. Cellulose constitutes about 41-43% of the plant (Jenkins et al., 1996a; Milne et al., 1990). Next in abundance is hemicellulose, which is around 20% in deciduous trees, but near 30% in conifers. This polysaccharide is formed by 100-200 monomers of glucose, mannose, galatose, xylose and arabinose (Parham and Gray, 1984; Simoneit, 2002). Lignin is the third component at around 27% in coniferous wood vs 23% in deciduous trees. It is a complex biopolymer with the main units derived from p-coumaryl, coniferyl and sinapyl alcohols (Rogge et al., 1998; Schultz and Taylor, 1989; Simoneit, 1993). These three components play an important role in emission production from biomass burning. Biofuels may also be composed, in lower proportions, of lipids, proteins, hydrocarbon components, simple sugars, starches, ash and other compounds (Jenkins et al., 1998; Sjöström, 1993).
1.1.1.2 Burning or Combustion process
Combustion of the individual fuel elements goes through a sequence of stages, each with different chemical and physical processes that result in different emissions. According to Jenkins et al. (1998) burning is a combination of reactants such as fuels, water, and air; reacting globally to produce some products of burning or emissions. The combustion or burning characteristics may show wide variation due to the type of fuel, the characteristics of combustion facility, dilution techniques used, sampling procedures, burning rate and the moisture content of the fuel (Fine et al., 2004b; Kowalczk et al., 1981; Lipsky and Robinson, 2006; Wardoyo et al., 2006).
The wood combustion process can be summarised as follows. With increasing temperature, the wood constituents begin to hydrolyse, oxidise, dehydrate and finally end up by pyrolysis (Simoneit, 2002). On the other hand, the process can be divided into three different phases: ignition, flaming and smouldering. Ignition is the heat absorbing phase of combustion where heat is applied to fuel, resulting in vaporisation of water and volatile combustible substances providing the gases that sustain flames in the next phase of combustion. Flaming is a phase of combustion where heat is released. This phase is the most efficient phase of combustion, producing the least amount of smoke per unit of fuel
6
consumed. The products of flaming combustion are primarily carbon dioxide and water vapour. Finally smouldering is the least efficient phase of combustion and produces more smoke. This phase does not present flame, and is associated with conditions where oxygen is limited, either by charing of fuels (particularly those with large surface to volume ratios) or by tightly packed fuels like duff and organic soils or in wet fuels.
1.1.1.3 Biomass burning process
Thermal degradation begins with a distillation step, in other words, with the release of water and volatiles species. The next step is pyrolysis, when thermal cracking of the fuel molecules occurs. This results in the formation of char with high carbon content, tar with intermediate molecular weight and volatile compounds in the form of a flammable white smoke. Above 180ºC, the process becomes exothermic, and at 530ºC, glowing combustion releases a complex mixture of tar and gaseous products, which form a flammable mixture when diluted with an oxydising atmosphere. This mixture ignites, forming a flaming combustion. This process converts the complex mixture of substances emitted during pyrolysis to simple molecules, particularly CO2, H2O, NO, N2O, N2, and SO2 (Lobert and
Warnatz, 1996; Yokelson et al., 1996, 1997). Depending on the interaction between chemical kinetics and physical dynamics in the flame, intermediate products, such as CO, CH4, H2, C2H4, C2H2, PAH, and soot particles, are also released during this stage.
Smouldering phase begins after flaming combustion ends and when most volatiles have been released from the near-surface region of the fuel. At this lower-temperature (<580ºC) a large amounts of incompletely oxidised pyrolysis products are emitted (Lobert et al., 1991; Yokelson et al., 1997). The amount of substances emitted from a given fire and their relative proportions are thus determined, to a large extent, by the ratio of flaming to smouldering combustion. It is this proportion, often expressed as „„combustion efficiency‟‟ (i.e., the ratio between CO2 and the sum of all carbon species emitted), which has been
used as an effective predictor for the composition of smoke gas emissions resulting from biomass fires (Ward et al., 1992).
1.1.2 Biomass burning: Emissions
Biomass burning emissions consist of a wide range of gaseous compounds and particulate matter. Biomass burning is known to be a source of carbon dioxide (CO2),
7 methane (CH4) and nitrous oxide (N2O). Beyond that, it is a considerable source of
chemically active gases such as nitric oxide (NO), carbon monoxide (CO) and volatile organic compounds (VOC).
It is well demonstrated that independently of fuel type, approximately 90% of the carbon released during biomass burning is oxidised to CO2 or CO, and less than 5% of the
carbon is released as particulate matter (e.g., Alves et al., 2011a; Andreae et al., 1998; Ferek et al., 1998; Ward et al., 1992).
The particles generated by biomass burning have three main components: particulate organic matter (POM) (~80%), trace inorganic species (~12–15%) and black carbon (i.e., soot) (~5–9%) (Reid et al., 2005).
1.1.2.1 Volatile organic compounds
Gaseous compounds can be separated in primary and secondary emissions products. During a low temperature phase (˂ 100ºC) the polyssaccharides and functional groups of hemicelluloses and lignin decompose. In this fire stage, methanol, light aldehydes, formic and acetic acid are the dominant emissions (Marutzky, 1991 cited by Kopmann et al., 2005). Above 220ºC the polymer structure of the wood is decomposed. In this stage, about 80% of the material is thermally decomposed and a large amount of gaseous compounds is emitted. The organic composition of the emissions is determined by the temperature and the rate of temperature increase. At temperatures of 250–500ºC methane, aldehydes, methanol, furanes and aromatic compounds such as benzene, toluene, ethyl benzene and phenol are emitted. The duration of this phase increases with the raise of the moisture content and the increasing amount of fuel material. The emitted gases, mostly oxygenated compounds, will be burnt more or less completely in the presence of oxygen leading to the formation of stable volatile organic compounds. During the flaming phase of a fire, the gaseous compounds are oxidised further in radical reaction chains that are, to some extent, similar to the VOC chemistry in the troposphere. In flames with oxygen excess the reactions are initiated by OH radicals; in flames with oxygen deficiency chemical reactions are initiated by the H radical. In the later situation, synthesis reactions are observed due to high concentrations of methyl radicals. These reactions result in hydrocarbons with higher molecular weight. Aromatic compounds are formed by chemical reaction in the flames and aliphatic compounds are added and cyclisised to form aromatics.
8
The amount of aromatic compounds is determined by the amount of aromatic precursors in the fuel material and by the flame temperatures. The ratio of the primary emitted aromatic compounds to the secondary formed is not yet known. Oxygenated aliphatic compounds are typically C1- or C2-hydrocarbons. This is due to the high rate coefficients for the
oxidation of alkyl radicals with more than two carbon atoms. They decompose rapidly by the elimination of an alkene. The emission of oxygenated compounds depends greatly on the pyrolysis temperature, with maximum emission occuring at 350ºC. More than 50% of the emitted aldehydes are formaldehyde and acetaldehyde (Nussbaumer, 1989 cited by Kopmann et al., 2005). The use of moist fuel material increases the amount of emitted aldehydes.
In the smouldering phase the formation rate of volatile organic compounds is low. But, since there is no flame, there is little subsequent loss leading to a relatively high emission rates of organic compounds in this stage of the fire. The predominant emitted compound is carbon monoxide. Since the emission rates of all products of incomplete combustion emission tend to be correlated (e.g., Ferek et al., 1998), CO is often taken as a surrogate for hydrocarbons and particulate carbon (Kopmann et al., 2005).
1.1.2.2 Particulate organic material
The majority of particles resulting from biomass burning were reported to be less than 2.5 µm in diameter (Ferge et al., 2005; Hedberg et al., 2002; Hueglin et al., 1997).
Since the organic fraction of smoke particles is composed of unburned fuel components and the products of partial combustion, the bulk of the wood smoke organic fraction is likely to be composed of compounds structurally related to the thermally decomposed products of these wood components (Gao et al., 2003). The most common are carbohydrates (predominately levoglucosan) accounting 7–14% of fresh smoke particle mass (Fraser and Lakshmanan, 2000; Gao et al., 2003). Levoglucosan alone can account for 5% of particle mass (Graham et al., 2002; Hornig et al., 1985; Puxbaum et al., 2007; Simoneit et al., 2004). Acetic acid, acetone, phenols, and water result from the levoglucosan pyrolysis, during the combustion process. Methoxyphenols have been found in similar concentrations in wood smoke (Hawthorne et al., 1989). Aldehydes are also present. Less than one half of water soluble organic component of smoke particles are thought to be organic acids with the remainder being indeterminate or neutral, such as
9 alcohols (Gao et al., 2003; Graham et al., 2002; Mayol-Bracero et al., 2002; Mazurek et al., 1991). The organic acids are present in fresh smoke particles such as formate, acetate, and oxalate, typically make up <1% of total particle mass each (Ferek et al., 1998; Yamasoe et al., 2000). With new analytical techniques progress it was possible to identify gluconate as the dominant acid (Gao et al., 2003). Also present in trace quantities (on the order of <5% of total mass) are miscellaneous alcohols and sugars. Through Gas Chromatography - Mass Spectrometry (GC–MS) studies, aliphatics, polycyclic aromatic hydrocarbons (PAH), esters and alkanols have also been observed (e.g., Fang et al., 1999; Simoneit et al., 1996). On a similar magnitude as the acids, straight chain n-alkanes with carbon numbers on the order of 24–34 are prevalent. Fang et al. (1999) showed that for such species, carbon numbers on the order of 29–31 are favoured. Similar studies have shown that PAHs (the nuclei on which particles form) make up less than 1% of smoke particle mass (Jenkins et al., 1996b; Kamens et al., 1988; Pettersson et al., 2011).
1.1.2.3 Trace inorganic species
A large amount of information is available in the literature because identification and quantification techniques of tracer inorganic species are accessible and widely used. Inorganic elements such as Na, Mg, Si, S, Cl, K, Ca, and Fe were commonly found from biomass burning (Alves et al., 2010; Andreae et al. 1998; Cachier et al. 1995; Chaiyo et al., 2011; Ferek et al. 1998; Li et al., 2003; Maenhaut et al. 1996; Yamasoe et al., 2000). Alkali earths and halides tend to dominate the inorganic species, both potassium and chloride account for 2–5% of fine particle mass. It has been often suggested that they are likely in the form of potassium chloride in the core of smoke particles with black carbon (e.g., Pósfai et al., 2003). Sulphur in the form of sulphate is also present in ~1% of fine particle mass. Despite being a small part of the mass particles (~˂ 10%), trace inorganic species analysis play an important role in biomass burning particle chemistry. Comparison of emissions showed significant composition differences between the various combustion equipments types, especially when comparing old-type residential appliances versus modern woodstoves and boilers with higher combustion efficiency. In complete combustion, the emissions are enriched in inorganic ash particles, such as alkali salts of potassium. Particles generated by low combustion temperatures or incomplete combustion
10
are characterised by a low content of inorganic constituents and a much higher organic carbon content (Bølling et al., 2009; Boman et al., 2004).
1.1.2.4 Black carbon or soot
Soot is formed from gaseous hydrocarbon fragments, at high temperature in the flames, normally in areas with insufficient air, and is often considered approximated as formed by black or elemental carbon. The soot chemical composition consists of solid carbon with a graphitic-like structure. Soot formation starts during volatilisation and combustion of organics when hydrocarbon fragments leave the biomass particles. These fragments then crack into smaller pieces and react with other fragments and surrounding gases to form aromatic rings. These ring structures are thought to add alkyl groups, developing into PAH. Thereafter, the particles grow by agglomeration. The resulting soot particles are thus composed of agglomerates of smaller spherical particles (Bäfver, 2008; Bockhorn, 1994).
1.2 Objectives
In Portugal and other Mediterranean countries, there is a lack of data on emission factors from biomass burning. Additionally in Southern Europe, the detailed chemical characterisation of biomass burning emissions has not been made so far. Emission inventories and source apportionment, photochemistry and climate change models, all have been using default values obtained for USA (e.g. Fine et al., 2004a,b), mid-European Alpine regions (Schmidl et al., 2008), or Scandinavian (Hedberg et al., 2002; Johansson et al., 2004) biofuel combustion, uncommon in Southern Europe. Thus, it is desirable to use more representative and specific locally acquired data. This study deals with the characterisation and quantification of the contribution of biomass combustion sources to atmospheric trace gases and aerosol concentrations more representative of the Portuguese reality.
This study encompassed the following parts: characterisation of particulate matter with aerodynamic diameter below 10 μm (PM10) from modern woodstove combustion
(Chapter 2); rate emissions and chemical composition of the particulate matter with aerodynamic diameter below 2.5 μm (PM2.5) from fireplace and typical cast iron
11 woodstove combustion (Chapters 3 and 4); emission from the field burning of garden and agriculture residues (Chapter 5); characterisation of emissions from experimental wildland fires (Chapters 6 and 7); and finally a national inventory of emissions that are released from residential wood combustion (RWC) in Portugal (Chapter 8).
1.3 Experimental work
1.3.1 Biomass selection
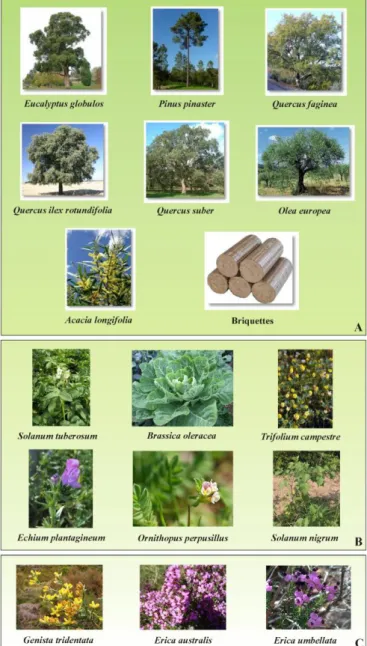
The Portuguese forest is an old ecosystem represented by a wide variety of species (Figure 1.1). The north coast of the country presents a higher abundance of maritime pine, eucalypt and Golden wattle. The northern inland regions are characterised by the presence of Portuguese oak and Portuguese chestnut, while the south is mainly covered by Cork oak and Holm oak. The species distribution is determined by the type soil, water availability and climate in each region. Portugal has one of the largest forested areas of Europe, covering 35.8% of the territory, which corresponds to 3.3 million hectares (Direcção Nacional de Gestão Florestal).
0.1 27 4 23 13 5 1 23 3 1 Golden wattle Maritime pine Stone pine Cork oak Holm oak Portuguese oak Portuguese chestnut Eucalypt Other hardwoods Other softwoods
Figure 1.1 Forest distribution in Portugal (%).
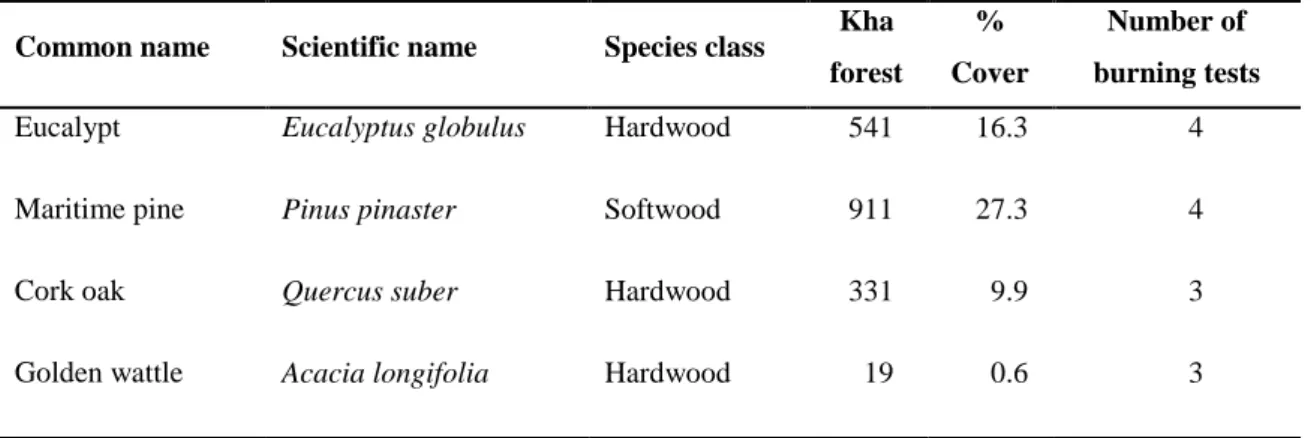
The main criterion for biomass selection for the experimental work was based on the availability of tree species in the Portuguese forest, which represents the most commonly used biofuels in domestic combustion. Maritime pine (Pinus pinaster), eucalypt (Eucalyptus globulus), cork oak (Quercus suber) and golden wattle (Acacia longifolia)
12
(Figure 1.2A) were the species selected for the combustion experiments in the modern woodstove of Vienna University of Technology (Chapter 2). For the traditional cast iron woodstove and brick fireplace tests, carried out at University of Aveiro, maritime pine (Pinus pinaster), eucalypt (Eucalyptus globulus), cork oak (Quercus suber), olive (Olea europea), Portuguese oak (Quercus faginea), Holm oak (Quercus ilex rotundifolia) and golden wattle (Acacia longifolia) (Figure 1.2A) were the species used. In addition, biomass briquettes made of wastes from forest cleaning activities and/or wastes from local wood processing industries, common in home heating nowadays, were also studied and evaluated (Chapters 3 and 4).
13 The characterisation of emissions from the field burning of garden and agriculture residues, presented in Chapter 5, relates to three types of biofuels: dried potato branches and leaves (Solanim tuberasum), weed vegetation (Trifolium campestre, Echium plantagineum, Ornithopus perpusillus, Solanum nigrum, etc.), and stalks from collard greens (Brassica oleracea) and pruned green leafy-twigs together with thin branches from garden trees (Figure 1.2B). Chapters 6 and 7 present the characterisation of experimental fires in a shrub-dominated forest. The vegetation cover was composed by some isolated pine trees (Pinus pinaster) and a continuous mass of dwarf Spanish heath (Erica umbellata), Spanish heather (Erica australis) and prickled broom (Chamaespartium tridentatum or Genista tridentata) (Figure 1.2C).
1.3.2 Laboratory and field facilities
1.3.2.1 Laboratory facilities: Combustion equipments
The domestic combustion equipments used in this study are divided into the following groups:
- Modern woodstove (Chapter 2)
- Traditional cast iron woodstove (Chapters 3 and 4) - Traditional brick fireplace (Chapters 3 and 4)
Modern woodstove: characterisation
At the Vienna University of Technology, a sophisticated “chimney type” logwood stove with a nominal power output of 6 kW was used. The woodstove is of the model Fox, manufactured by the Austrian company Rika. This type of equipment is commonly found in Austria, Hungary, Germany, Switzerland, Bohemia, Northern Italy and Scandinavia, but is gradually conquering the market in Southern Europe. Combustion air enters the burning chamber (28x25x25cm) through a grate in the bottom (primary air) and a slit in the back wall (secondary air). Exhaust gases are redirected 2 times prior to entering the chimney. Airflow is controlled manually via a rotary knob connected to a valve system that adjusts both primary and secondary combustion air flow. The stove temperature (at the centre of the combustion chamber) and its exit flue gas characteristics, such as temperature, O2,
CO2, CO, NO, and total hydrocarbons, were monitored continuously at the exit of the stove
14
monitored using K-type thermocouples. The measurement principles of the gas analysers were non-dispersive infrared (CO and CO2), paramagnetic (O2), chemiluminescence (NO)
and flame ionisation (total hydrocarbons expressed as methane-equivalents). Each gas analyser was calibrated with appropriate gas on zero and span points. Dilution factors used in the dilution tunnel ranged from 1:10 to 1:15, enabling temperatures at the particulate matter sampling port only a few degrees Celsius higher than ambient values. The dimensions of the dilution tunnel were 1 m in length and 0.2 m in width resulting in an average residence time of 50 seconds at a flow rate of 2.3 m3 h-1. PM10 was sampled from
the dilution tunnel with a low volume sampling head (Digitel AG, Switzerland) working on a one-stage impactor principle at a flow of 2.3 m3 h-1 , which was further distributed to 47 mm diameter aluminium filter holders (Pall Life Sciences). The filter holders were equipped with six quartz fibre filters (Tissuquartz, Pall 205 Life Sciences) and two mixed cellulose ester filters (GN-4 Metricel, Pall Life Sciences). The sampling flow through quartz fibre filters was set to 0.33 m3 h-1 per filter, while the flow through cellulose filters was 0.165 m3 h-1. This was necessary because of the high pressure drop of cellulose filters. The flows through both sampling lines were regulated with mass flow controllers (Bronkhorst) after drying the diluted flue gas with activated silica to refer to dry conditions (Fernandes et al., 2011; Schmidl et al., 2008, 2011) (Figure 1.3).
15 .
16
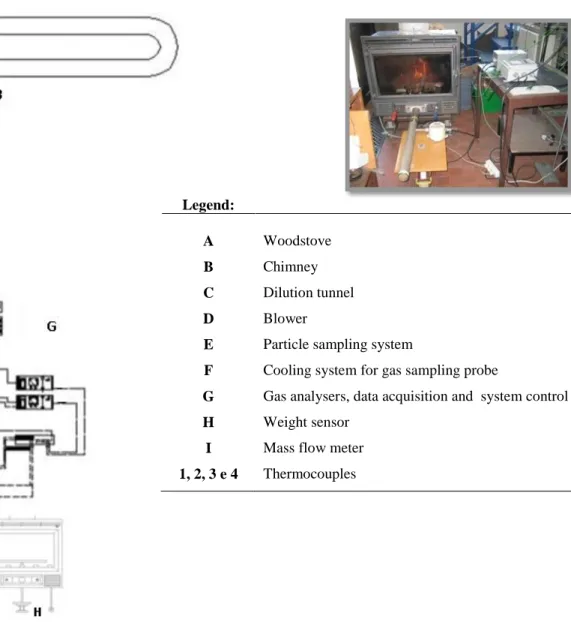
Traditional cast iron woodstove and brick fireplace: characterisation
At the University of Aveiro, the combustion tests were conducted in a traditional cast iron woodstove and in a Portuguese brick fireplace of the type used in Portugal for domestic heating purposes.
The woodstove used is of the model Sahara, manufactured by the Portuguese company Solzaima using stainless steel, with the front panel and grate made in iron cast and a combustion chamber with a volume of around 0.09 m3 (Figure 1.4). The stove is charged with batches of wood over the grate in the combustion chamber. The air enters the combustion chamber through a regulation device located in the down door, which also supports the hopper for collecting the bottom ashes, located below the grate. The driving force for the air flow rate throughout the combustion chamber is the natural convection resulting from the up flowing stream of combustion hot flue gases through the vertical exhaust duct (chimney) (Tarelho et al., 2011).
The fireplace used has a combustion chamber with a volume of around 0.15 m3 (Figure 1.5). The wood logs are supported by a fixed grate and, in this case, there is no hopper for collecting the bottom ashes. In this combustion appliance there is no device for regulating the combustion air flow. The air enters the combustion chamber through the front opening and flows below and above the fixed bed of burning biomass. The driving force for the air flow rate throughout the combustion chamber is the natural convection resulting from the up flowing column of the hot combustion flue gases throughout the chimney.
Both burning appliances were equipped with a chimney with 0.2 m internal diameter, and 3.3 m height in the case of the woodstove, and 2.7 m height in the case of the fireplace, in order to have the chimney exit at the same height (B in Figures 1.4 and 1.5). In the case of the woodstove, the first section of the exhaust duct above the stove exit was thermally insulated (with Cerablanket, 128 kg/m3, 0.025 m, 0.23 W/m/K), due to operation safety reasons (Tarelho et al., 2011)
The woodstove was equipped with a combustion grate connected to a weight sensor (load cell DSEUROPE Model 535QD-A5), in order to get continuous monitoring of the fuel mass in the combustion chamber grate (H in Figure 1.4).
The gas flow rate through the combustion chamber was accessed by using: i) a mass flow meter (Kurz, Model: 500-2.0-P 40) for combustion air flow rate entering the
17 combustion chamber, in the woodstove case (I in Figure 1.4), and ii) a Pitot tube located in the chimney and respective pressure sensor, making part of a Testo AG 808 equipment, in the fireplace case.
The combustion flue gas temperature was monitored using K-type thermocouples at several locations along the facilities, namely, in the woodstove under the fixed bed of fuel, at the central region of the combustion chamber and along the chimney height (1, 2, 3 and 4 in Figures 1.4 and 1.5).
The combustion flue gas composition was characterised on-line by using a gas sampling and analysing system which comprises a set of on-line analysers, namely: O2
(paramagnetic, ADC model O2-700 with a Servomex Module), CO2 and CO
(non-dispersive infrared, Environnement, MIR 9000) (G in Figures 1.4 and 1.5).
For O2, CO2 and CO analysis, the combustion flue gas sampling and analysing
system includes a water-cooled sampling probe, a set of gas conditioning and distribution units, and the on-line gas analysers (F in Figures 1.4 and 1.5). The combustion flue gas was sampled at a flow rate of 2 L min-1 (atmospheric temperature and pressure) at the exit of the chimney; the probe tip was located at the axial line of the chimney. The sampling probe was equipped with an external circulating quenching water sleeve, an ice-cooled particle gas filter, a K-type thermocouple and a Cerablanket plug at the tip for exhaust gas particle filtering. The gas conditioning and distribution units include gas flow meters, a filtering system for particulate removal, a gas sampling pump, a heat exchanger immersed in an ice bath for gas quenching and water vapour removal, and a gas distribution unit. The gas distribution unit consisted of pneumatic circuits that permit to deliver calibration gas, purge gas and sample gas to the analysers.
For total hydrocarbons (THC) analysis (expressed as CH4), a heated probe and
sampling line (at 190ºC) was used for gas sampling. The sampling probe was located at a height of 2.8 m in the chimney. The flue gas sample was directly analysed by FID. The sampling probe tip was located at the axial line of the chimney and a Cerablanket plug is putted at the tip probe for combustion flue gas particle filtering (Tarelho et al., 2011).
The operation and monitoring of the entire system was performed by a computer based control and data acquisition hardware and software system.
For particulate matter (PM2.5) sampling, a dilution tunnel and respective ancillary
18
gas exiting the chimney. The dilution tunnel used had 0.20 m internal diameter, and 11 m length. The dilution ratios applied to the flue gases from the woodstove were around 25:1. In the case of the fireplace, 4- to 5-times dilution ratios were applied. The particulate matter sampling point was located at 10 m downstream the dilution tunnel entrance. The sampling train included a specific sampling head (PM2.5), a pump, and a control and data
acquisition system, all part of a TCR TECORA (model 2.004.01) instrument, operating at a flow of 2.3 m3 h-1 (E in Figures 1.4 and 1.5). A K-type thermocouple was placed near the sampling head to measure the temperature of the flue gas (combustion flue gas from the stove/fireplace diluted with atmospheric air) (4 in Figures 1.4 and 1.5). The temperature in the particle sampling point was in the range 25–35°C, and the relative pressure was maintained typically at 10 mm H2O below the atmospheric pressure. The gas flow velocity
was around 6.3 m s-1.
The volumetric gas flow rate throughout the tunnel, and respective combustion gas dilution ratio were calculated from the mean gas velocity in the cross section of the dilution tunnel. This mean gas velocity was estimated based on the differential pressure monitoring using a Pitot tube and respective pressure sensor, making part of Testo AG 808 equipment, and a K-type thermocouple (Fernandes et al., 2011; Tarelho et al., 2011).
19
Figure 1.4 Schematic representation of the traditional woodstove of University of Aveiro (Fernandes, 2009).
Legend:
A Woodstove
B Chimney
C Dilution tunnel
D Blower
E Particle sampling system
F Cooling system for gas sampling probe
G Gas analysers, data acquisition and system control
H Weight sensor
I Mass flow meter
20 Legend: A Fireplace B Chimney C Dilution tunnel D Blower
E Particle sampling system
F Cooling system for gas sampling probe
G Gas analysers, data acquisition and system control
1, 2, 3 e 4 Thermocouples
21
1.3.2.2 Field facilities
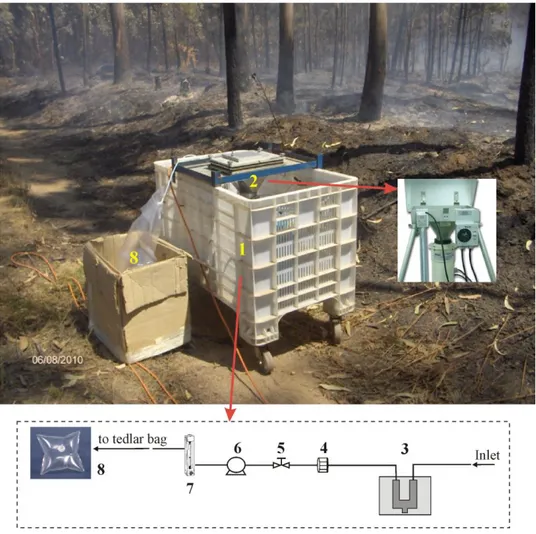
In the characterisation of garden and agriculture residues field burning (Chapter 5) and in experimental wildland fires (Chapters 6 and 7), a tripod high-volume sampler/impactor (Tisch Environmental Inc.) operating at a flow of 1.13 m3 min-1 was used to collect sequentially, on pre-baked quartz fibre filters, large coarse (PM>10), coarse
(PM2.5-10) and fine (PM2.5) smoke particles. The impaction system for capturing PM>10 was
designed at the University of Aveiro in accordance with the Marple and Rubow‟s theory (1986). A Tisch impaction plate TE-231 F was used to separate particles smaller than 2.5 µm. Quartz filters used as impaction substrates have been shown to minimise particle bounce without affecting the cutpoint of the impactor (Chang et al., 2001).
In parallel and simultaneously, Tedlar bags previously flushed with N2 were used
for the collection of gas samples. Pre-removal of water vapour from the air stream was carried out in a U glass tube filled with glass spheres, immersed in an ice bath. In addition, and previously to the water vapour removal, the air stream was filtered through a 4.7 mm quartz filter to remove particles before passing to the collection system, which also contained a Teflon-lined diaphragm pump connected to a needle valve and a calibrated rotameter operating at a flow rate of 1 L min-1. After sampling, the bags were stored in opaque containers in order to minimise U.V. radiation of the samples. The time period between sampling and analysis was reduced to a few hours to avoid secondary reactions. A schematic diagram of the open burning experiments is presented in Figure 1.6.
22
Figure 1.6 Schematic diagram of the experimental setup.
1) Portable box; 2) PM sampler; 3) U-shaped tube filled with small glass balls in an ice bath to remove water vapour; 4) Filter holder (Ø= 47 mm) to remove particles from the air stream; 5) Needle valve; 6) Teflon pump; 7) Rotameter; 8) Tedlar bag.
1.3.3 Filters treatment
In the field work, quartz fibre filters have been used as particle collection substrates. According fine particles (PM2.5) were collected over filters 20.3 x 25.4 cm (Whatman QM-A); coarse (PM2.5-10) and large coarse (PM>10) particles were collected over
the same type of quartz filter, adapted to the sample plate holder of the two-stage cascade impactor, by cutting the original rectangular quartz filters into strips. In laboratory combustion tests filters with a 47 mm diameter were used (Tissuquartz, Pall Life Sciences and GN-4 Metricel, Pall Life Sciences).
All filters used in this work (except cellulose filters) were wrapped in aluminium foil and pre-baked at 500ºC or 600ºC for 6 hours to eliminate organic contaminants. The filters