Assessment of a trap based
Aedes aegypti
surveillance program using mathematical
modeling
Raquel Martins Lana1☯*, Maı´ra Moreira Morais2☯, Tiago Franc¸a Melo de Lima3, Tiago Garcia de Senna Carneiro4, Lucas Martins Stolerman1, Jefferson Pereira Caldas dos
Santos5, Jose´ Joaquı´n Carvajal Corte´s6, A´ lvaro Eduardo Eiras7, Cla´udia Torres Codec¸o1☯
1Programa de Computac¸ão Cientı´fica, (PROCC), Fundac¸ão Oswaldo Cruz (Fiocruz), Rio de Janeiro, Rio de Janeiro, Brazil,2Centro Universita´rio de Belo Horizonte (UniBH), Belo Horizonte, Minas Gerais, Brazil, 3Departamento de Computac¸ão e Sistemas (DECSI), Instituto de Ciências Exatas e Aplicadas (ICEA), Universidade Federal de Ouro Preto (UFOP), João Monlevade, Minas Gerais, Brazil,4Departamento de Computac¸ão, Universidade Federal de Ouro Preto, Ouro Preto, Minas Gerais, Brazil,5Programa de Po´s-Graduac¸ão em Epidemiologia em Sau´de Pu´blica, Escola Nacional de Sau´de Pu´blica Se´rgio Arouca (ENSP), Fundac¸ão Oswaldo Cruz (Fiocruz), Rio de Janeiro, Rio de Janeiro, Brazil,6Laborato´rio de Doenc¸as Parasita´rias, Instituto Oswaldo Cruz/Fiocruz, Rio de Janeiro, Rio de Janeiro, Brazil,7Laborato´rio de Ecologia Quı´mica de Insetos Vetores (Labeq), Departamento de Parasitologia Instituto de Ciências Biolo´gicas (ICB), Universidade Federal de Minas Gerais, Belo Horizonte, Minas Gerais, Brazil
☯These authors contributed equally to this work. *[email protected]
Abstract
The goal of this study was to assess the goodness-of-fit of theoretical models of population dynamics ofAedes aegyptito trap data collected by a long term entomological surveillance program. The carrying capacityKof this vector was estimated at city and neighborhood level. Adult mosquito abundance was measured via adults collected weekly by a network of sticky traps (Mosquitraps) from January 2008 to December 2011 in Vito´ria, Espı´rito Santo, Brazil.Kwas the only free parameter estimated by the model. At the city level, the model with temperature as a driver captured the seasonal pattern of mosquito abundance. At the local level, we observed a spatial heterogeneity in the estimated carrying capacity between neighborhoods, weakly associated with environmental variables related to poor infrastruc-ture. Model goodness-of-fit was influenced by the number of sticky traps, and suggests a minimum of 16 traps at the neighborhood level for surveillance.
Introduction
Arthropod-borne viruses are responsible for a high disease burden worldwide [1,2]. Many arboviruses originally evolved and diversified in the tropics and currently show increasing vir-ulence and invasive characteristics associated with abrupt and explosive outbreaks, even in temperate regions [3]. The main arthropod vectors involved in viral transmission to humans are ticks, sandflies and mosquitoes. Mosquitoes of the genusAedesare among the most studied vectors due to their role on the transmission of several arboviruses with significant public
a1111111111 a1111111111 a1111111111 a1111111111 a1111111111 OPEN ACCESS
Citation:Lana RM, Morais MM, Lima TFMd, Carneiro TGdS, Stolerman LM, dos Santos JPC, et al. (2018) Assessment of a trap basedAedes aegyptisurveillance program using mathematical modeling. PLoS ONE 13(1): e0190673.https://doi. org/10.1371/journal.pone.0190673
Editor:Luciano Andrade Moreira, Centro de Pesquisas Rene´ Rachou, BRAZIL
Received:June 21, 2017
Accepted:December 19, 2017
Published:January 5, 2018
Copyright:©2018 Lana et al. This is an open access article distributed under the terms of the Creative Commons Attribution License, which permits unrestricted use, distribution, and reproduction in any medium, provided the original author and source are credited.
Data Availability Statement:All relevant data are within the paper and its Supporting Information files.
Funding:AEE had a fellowship from CNPq (Conselho Nacional de Desenvolvimento Cientı´fico e Tecnolo´gico). The funders had no role in study design, data collection and analysis, decision to publish, or preparation of the manuscript.
health impact, including yellow fever, dengue, zika (Flaviviridae, Flavivirus) and chikungunya (Togaviridae, Alphavirus) [4].
The abundance ofAedes aegyptiin a territory is an important risk factor for the emergence and maintenance of these diseases [4], and many countries spend a large amount of resources on vector surveillance and transmission control measures. In Brazil as well as other countries that follow the World Health Organization (WHO) guidelines, the standard surveillance pro-tocol is the household survey, which generates regular estimates of the Premise Index (PI), with values above 4% indicating risk of dengue outbreak [5]. However, many studies have sug-gested that such larval indices are not sensitive or efficient for monitoring the female adult
Aedespopulation, which is the mosquito subpopulation directly linked to virus transmission [6,7].
A trap-based surveillance program for continuous estimation of female adultAe. aegypti
is an alternative to household surveys. Traps are less intrusive, require less labor, and can achieve better spatial coverage and temporal resolution [8]. There are some initiatives to use trap based surveillance worldwide, using different traps and protocols, but no consensus has emerged yet on the best approach [6].
In Brazil, several cities have started trap-basedAedessurveillance initiatives in the last decade, in a quest for new entomological indices to guide their dengue control activities. The city of Vito´ria, capital of Espı´rito Santo State, is one of them. The city has been the scene of dengue epidemics since 1995 when DENV-2 serotype arrived [9]. Currently, all four dengue serotypes circulate in the city, with dominance of DENV-1 and DENV-4 since 2013 [10]. In 2016, the region witnessed the arrival of Zika (2,276 cases) and Chikungunya (313 cases) [11].
Vitoria’s trap surveillance program, named “Intelligent Dengue Monitoring System” (MI-Dengue) (Ecovec SA, Belo Horizonte, Brazil) employs sticky traps (MosquiTRAP) baited with synthetic oviposition attractant to capture gravidAedesmosquitoes [12]. Captured mos-quitoes are identified and counted in the field and data are sent immediately to a data center via cell phone [13,14]. The Mean FemaleAedes sp. IndexIMFAis calculated as the ratio between the number of mosquitoes and the number of traps in a given area and mapped to inform the city’s vector control crew on the location of high infestation neighborhoods that will be targets for intervention, which includes source reduction and adulticide application [5]. Previous studies have investigated the adequacy of the MI-Dengue system in other cities in terms of effectiveness in reducing dengue cases [13,14] and its cost-effectiveness [14]. Some studies suggest that the MosquiTrap is less sensitive than other traps to monitor the seasonal dynamics ofAe. aegypti[6,15].
Climate and landscape factors are important determinants ofAe. aegyptiabundance. Vito´-ria city is a humid climate city located in the Brazilian coastline, where seasonal effects are mostly temperature-driven [6,16]. In a meta-analysis, Couret and Benedict [17] concluded that temperature is a sufficient factor to explain variation in the development rate ofAe. aegypti. Among landscape factors, the availability and quality of breeding sites determine the carrying capacity of a given area. Intraspecific competition within breeding sites affect the mortality rate of larvae and consequently the productivity of an area [18,19].
between the observed variable (number of mosquitoes trapped per week) and the factors reg-ulating the mosquito life parameters.
In a previous work, we estimated the carrying capacity ofAe. aegyptiin neighborhoods of Rio de Janeiro using ovitrap data [21]. The model has four equations, describing the dynamics of egg, larvae, pupae and adults. The carrying capacityKis assumed to be constant and control the maximum load of the egg compartment. Temperature is the external variable that controls the seasonality of the observed mosquito abundance. In the present study, the same mathemat-ical model is used to estimate the carrying capacity ofAe. aegyptiin the city of Vitoria as a whole and in each of its neighborhoods separately. In particular, we investigate if the estimated carrying capacity is associated with differences in human density and environmental variables related to the presence of breeding sites. Finally, we discuss the potential inclusion of model-based carrying capacity estimation in the surveillance routines.
Methods
Study area
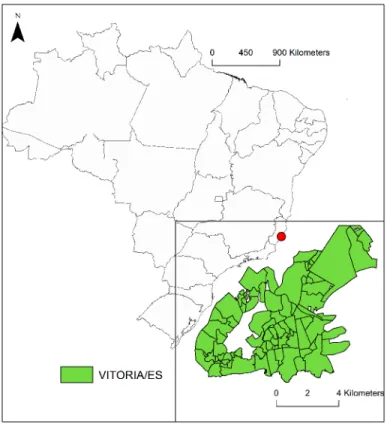
Vito´ria (20˚19’15” S, 40˚20’10” W) is the capital of the state of Espı´rito Santo in southeastern Brazil (Fig 1). The city is located on a small riverine island, with altitudes ranging from 0 to 149 m. Its total population (355,875 inhabitants) lives in a 97.4km2area, resulting in a 3,338.3/
km2population density [22]. The climate in Vito´ria is characterized as humid tropical, with average rainfall of 1,153 mm/year and an average temperature of 34.4˚C in the summer and 24.4˚C during the winter. The city is divided in a total of 80 neighborhoods [22], including slums with poor infrastructure and middle/high income areas with increasing degrees of urbanization and improved socioeconomic conditions.
Data
Temperature time series. Images from the MODIS satellite (surface temperature sensor with 1000 meters of resolution) were obtained from the International Research Institute for Climate and Society (IRI) platform at the Columbia University Land Institute [23], for the period between January 2008 and December 2011, with a temporal resolution of 8 days. The satellite’s diurnal measurements are proxies for the daily maximum tempera-ture. Good quality images (without cloud coverage) were selected and interpolated by the empirical Bayesian method [24]. A time series of maximum temperature with a time resolu-tion of 8 days was obtained for each neighborhood by averaging the image values within the neighborhood geographical polygon. A daily time series of maximum temperature was cre-ated by linear interpolation usingna.approxfunction from libraryzoo[25], R environment [26].
The mean daily temperature time series used in this work were calculated by fitting a regression model of the form
TempmedðtÞ ¼aTempmaxþb
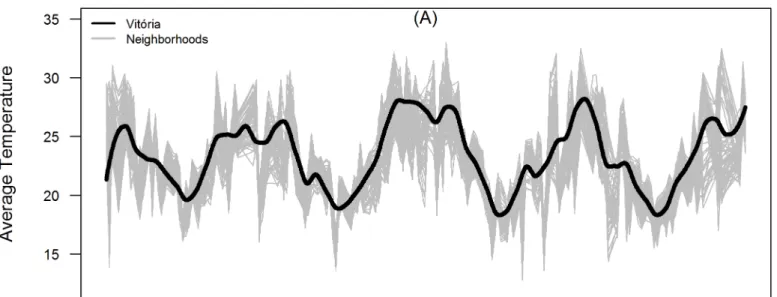
Mosquito surveillance data. The entomological data consisted of a weekly time series with the number of capturedAe. aegyptimosquitoes, using sticky traps (called MosquiTraps) as part of the city’s entomological surveillance plan. Data from January 2008 to December 2011 were obtained from Ecovec SA (Belo Horizonte, Brazil). Traps were distributed on a reg-ular grid with 250mspacing covering the city and were inspected by trained personnel. The weekly entomological index (IMFA, Mean FemaleAedessp. index), calculated as the ratio between the total number ofAe. aegyptifemales captured and the number of inspected traps (Fig 2). TheIMFAindexes were calculated for the city as a whole and for each neighborhood [13]. A total of 75 neighborhoods monitored by DENGUE-MI were used in the analysis. Some neighborhoods were grouped into Junctions due to difficulty in determining the exact location of some traps: Junction 1—Ariovaldo Favalessa, Alagoano and Morro Alagoano; Junction 2— Bela Vista and Nossa Senhora Aparecida; Junction 3—Praia do Sua´, Morro de Santa Helena, Morro do Sua´ and Morro do São João; Junction 4—São Pedro, São Jose´ e Santos Reis; Junction 5—Seguranc¸a do Lar and Solon Borges. AllIMFAdata used in this work is available inS1 Table.
Neighborhood data. For each neighborhood, mosquito infestation was related to the fol-lowing descriptor variables from the last Brazilian Census [22]: population and household count, area, population density, percentage of households with illegal energy supply, percent-age of households in unpaved streets, closeness to garbpercent-age areas, without manhole and open sewage. These variables may potentially affect the carrying capacity of theAe. aegypti popula-tion. Maps were created using polygons from the same source.
Fig 1. Vito´ria city and its neighborhoods, Espı´rito Santo, Brazil.The underlying shapefiles with political boundaries of Brazilian states and Vito´ria municipality are publicly and freely available atInstituto Brasileiro de Geografia e Estatística(IBGE, Brazilian Institute of Geography and Statistics) websitehttp://downloads.ibge.gov.br/downloads_ geociencias.htm.
Mathematical model
Our mathematical model describes a temperature-driven population dynamics ofAe. aegypti
(introduced in [21]) and a new equation modeling the capturing process of adult mosquitoes by the trap network. In this section we introduce both model equations and temperature-dependent life-stage parameters.
Fig 2. (A) Time series of diurnal surface temperature in Vito´ria city (black) and its neighborhoods (grey); (B) Mosquito infestation indexIMFA(black: true values, red: smoothed curve) at city level and in each neighborhood (grey).The total period ranges from 1stJanuary 2008 to 31thDecember 2011.
Population dynamics. Eqs1–4describe the dynamics of eggs, larvae, pupae and adult populations ofAe. aegypti, respectively.
dE
dt ¼s0A 1 E K
½s1þm1E ð1Þ
dL
dt ¼s1E ½s2þm2L ð2Þ
dP
dt ¼s2L ½s3þm3P ð3Þ
dA
dt ¼s3P m4A a Tn Hn
A
ð4Þ
dTrapped
dt ¼a Tn Hn
A ð5Þ
The first equation describes the dynamics of the egg stock (E), with a density-dependent oviposition rate, which is regulated by the carrying capacityK, and a hatching rateσ1. Larvae
(L) develop into pupae at a rateσ2, and pupae (P) into adults (A) at a rateσ3. Mortality at each
developmental stage is described by the parametersμ1,μ2,μ3andμ4. For details on this
mathe-matical model, we refer the reader to [21].
The developmental ratesσiare temperature-dependent according to the expression [28]
siðTÞ ¼ ri T
298exp ai R 1 298 1 T
1þ exp bi R 1 ti 1 T
ð6Þ
wherei= 1, 2 and 3 in our model andTrepresents the mean temperature in Kelvin. For each life-history stagei,ρirepresents the development rate at 298Kelvinassuming no enzyme
inac-tivation and the pairs {ai,bi} are specific parameters at 298Kelvin, which are given by Focks
et al. [28].τi(usually denoted byT1/2Hin the literature) represents the temperature when half
of the enzyme is deactivated by being subjected to high temperatures. Finally,R= 1.987 calK−1
mol−1is the universal gas constant [29].
Capturing process. The capturing process is modeled byEq 5where the variable
Trapped(t) represents the total number of mosquitoes captured during the surveillance period until the instantt. The capture rate is given byαTn/Hn, whereαis the trap attractiveness
(pro-portion of mosquitoes within a household attracted by the trap),TnandHnrepresents the
number of traps and households in neighborhoodn, respectively. The ratioTn/Hnis therefore
a density of traps per household.
For calculating a theoreticalIMFAin a weekwbased on our model, we use the equation
imfamodelðwÞ ¼
TrappedðwÞ Trappedðw 1Þ Tn
Model parameterization
All symbols and their meanings are listed inTable 1. The different life history parameters were obtained from the literature. The number of traps (Tn), and households (Hn) were
parameter-ized according to each surveillance area. The attractiveness of the Mosquitrap,α, is not known a priori. However, previous field study described in Resende et al. [30] compared the catching rate of 1, 2, 4, 8, 16 traps placed in a single house with no evidence of ever exhausting the local mosquito population. This result suggests that the capture rate of a single trap is low. Here, we arbitrarily setα= 0.2 implying that 20% of the mosquitoes within a household would be cap-tured per day. The impact of this choice is discussed later.
Model fitting. To estimate the carrying capacityKfor each neighborhood as well as Vito´-ria city as a whole, the following steps were taken: first, weekly time series ofIMFA(imfaobs)
were computed using either all city traps or the subset of traps within a neighborhood; second,
imfaobswas smoothed using local Polynomial Regression (degree 2, degree of
smooth-ing = 0.08); and third step was to fit the mathematical model toimfaobs. For each candidate
value forK, the model was numerically solved until its steady state using the temperature time series as a forcing function and the resulting time series of mosquito captures,imfamodel, was
calculated using7.
The model was implemented in R [26] and calibrated using theoptimizeand the
FME::modCostfunctions to find the value ofKthat minimizes the mean squared error (MSE)
betweenimfamod(at steady state) andimfaobs[32].
Results
At the city scale
The city of Vito´ria was monitored with 1410 traps. The estimated carrying capacity for Vito´ria city as a whole was 2401 eggs (error = 3.55). This number should not be interpreted as an abso-lute measure of the maximum load of eggs, because this calculation is conditioned on the trap attractiveness (set atα= 0.2) and trap density. Later in the text, a formula is provided for calcu-latingKusing other values ofα.
Fig 3compares the observed and predicted time series ofIMFA. The model fitted well the seasonal fluctuations ofIMFA, which tends to increase in October and peaks in December-January. The lowest abundance is observed from June to July.
Table 1. Model parameters and values.
Parameters Values Sources
Oviposition rate (σ0) 1.0day−1 [31] Egg eclosion rate (σ1) ρ1= 0.24,a1= 10798,
b1= 100000,τ1= 14184
[28] and [29] Pupation rate (σ2) ρ2= 0.2088,a2= 26018,
b2= 55990,τ2= 304.6 Emergence rate (σ3) ρ3= 0.384,a3= 14931,
b3=−472379,τ3= 148 Egg mortality rate (μ1)
Larva mortality rate (μ2) Pupa mortality rate (μ3) Adult mortality rate (μ4)
1/100day−1
1/3day−1
1/70day−1
1/17.5day−1
[31]
Carrying capacity (K) Fitted Trap attractiveness (α)
Traps per neighborhood (Tn)
Households per neighborhood (Hn)
0.2day−1
variable variable
ECOVEC IBGE (2010)
At the neighborhood scale
The 75 neighborhoods in Vito´ria vary considerably in area, population density, and infrastruc-ture (Table 2). On average, a neighborhood has 4200 inhabitants, ranging from 98 to more than 39 thousand. There is still a large proportion of households located in streets with poor drainage, unpaved streets, and close to open garbage dumps.
The number of traps installed per neighborhood varied from 2 in Junction 1, to 149, in Jardim Camburi. The mean number of traps was 18.67 with a median = 13 traps. The sam-pling effort increased linearly with the neighborhood area (km2), according to the equation
Traps= 4.7 + 22.8×area(R2= 0.49).
The mathematical model was fitted independently to each of the 75 time series ofIMFA
from the neighborhoods of Vito´ria. EstimatedKvaried from 1383 to 4143. The distribution of
Kvalues are approximately normally distributed (Fig 4) with mean 2585 and standard devia-tion 649. The value ofKestimated for Vitoria city (K= 2401) is lower than the averageK esti-mated at the neighborhood level. Estiesti-matedKand averageIMFAper neighborhood,aIMFA, are linearly associated (Table 2) as expected from theEq 8described below.
Fig 3. Time series of observed (black) and predicted (red)Aedes aegyptiabundance indexIMFAin Vito´ria, ES, from 1stJanuary 2008 to 31thDecember 2011.
Average temperature series is shown in dashed line.
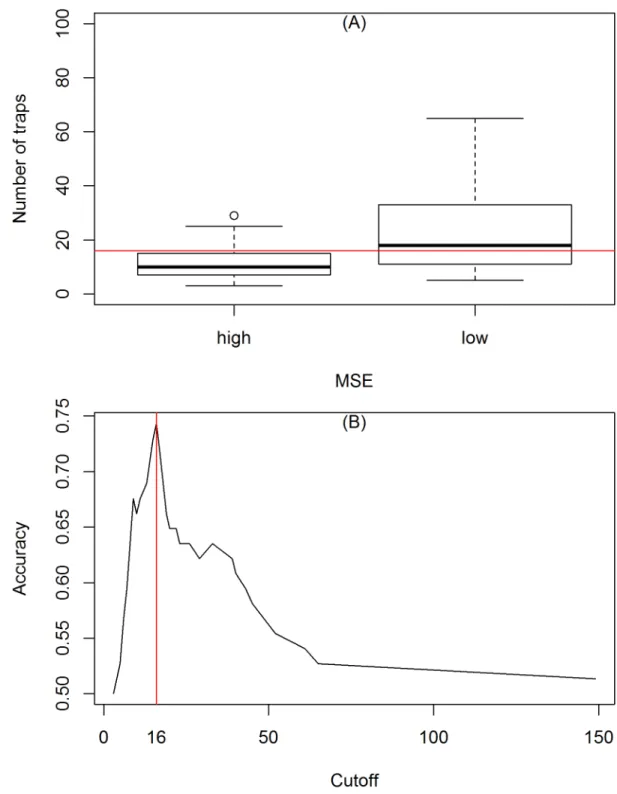
The mathematical model did not fit equally well to all time series. The medianMSEwas 8.8, with an interquantile range = [6.47, 13.18]. Four neighborhoods presentedMSE>30, two of them with few traps installed (2 and 3, respectively).
We further investigated if the goodness-of-fit was associated with the number of traps. The quality of the fit in each neighborhood was classified as below and above the average ofMSE. Using ROC [33], we calculated as n = 16, the number of traps that best discriminated between the two groups (Fig 5). The poorest fits were observed in neighborhoods monitored with less than 10 traps.
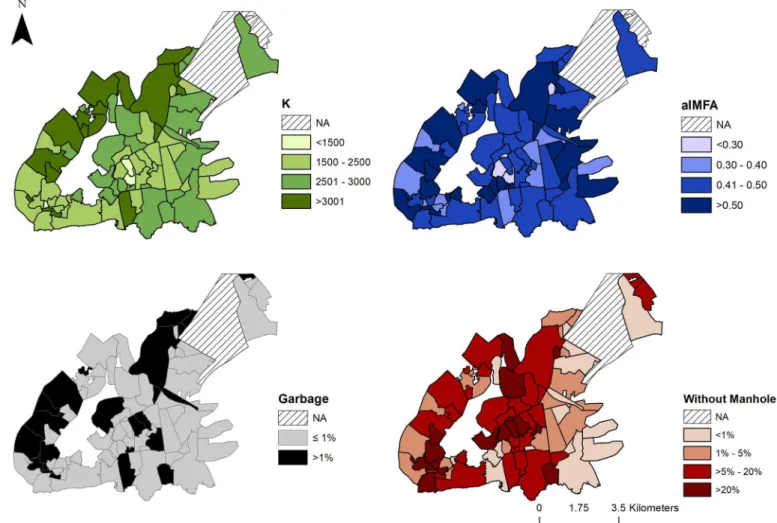
We hypothesized thatKwould be associated with environmental and demographic charac-teristics of the neighborhoods (Table 2). We foundKassociated with neighborhood size, but not with population density. Among the variables related to the production of breeding sites, only% households with garbage in the streetswas associated and with less intensity, only to
aIMFA,% households with open sewage. In addition, the variable% households in streets with-out manholewas associated negatively withK(Fig 6).
Relationship between carrying capacity, mosquito abundance and capture
rate
The mathematical relationship between the carrying capacityKand capture rateα, as a func-tion of the number of adult mosquitoes in the equilibrium is:
K¼A 1
1
s3FLFP aTn
Hn þm4 FE 0 B B @ 1 C C A 1
ð8Þ
whereFE,FL,FPare combinations of the life history parameters (seeS1 Appendixfor the
der-ivation of this expression from the mathematical model).
According to this expression shows,Kshould increase linearly with the abundance of adult mosquitoes (what we found) but this relationship depends on a composite factor of life-history parameters and the trapping process. It is clear that the estimatedKwill vary if trap attractive-ness varies (α), in other words, the estimatedKis trap dependent.
Table 2. Association between demographic, environmental and entomological variables withaIMFA(average
IMFAper neighborhood) and the estimated carrying capacityKof the neighborhoods of Vitoria city.Linear regressions were fitted (see text for details). Three asterisks indicatep−value<0.05, two asterisks indicate p−value<0.1.
Descriptors Range aIMFA K
aIMFA [0.2561,0.7712]
K [1383,4143]
Number of traps [2,149] log(Number of inhabitants) [4.5,10.5] Number of households [27,14451]
Area (km2) [0.045,3]
Population density (person/km2) [447,52479] % households with illegal energy supply [0,30]
% households with garbage in the streets [0,8]
% households in unpaved streets [0,20]
% households with open sewage [36,54]
Discussion
Entomological surveillance is a key component of any dengue control program. Infestation indexes are collected to inform levels of attention and to identify hotspots for vector control activities. Understanding the temporal dynamics ofAe. aegyptiand its response to environ-mental factors is important for the development of early-warning systems and identification of urban landscapes most associated with infestation. In this study, we have shown that a mecha-nistic model with temperature-dependent transition rates is able to capture the temporal dynamics ofAe. aegyptiin a dengue endemic tropical city and allows the estimation of the mosquito’s carrying capacity. It is known that high temperature is a strong modulator ofAe. aegyptidynamics [34,35], once it stimulates the fast development of larvae and the likelihood of adult emergence, as well its dispersion [36,37]. Our results are in agreement with previous work [21] who applied the same model to ovitrap data in Rio de Janeiro, and supports the
hypothesis that mosquito abundance responds to temperature even when annual temperature amplitudes are not high [6].
In this study, we have found carrying capacities for textitAe. aegypti varying from 1383 to 4143 across Vitoria’s neighborhoods. These values represents an approximation of the egg
Fig 5. (A) Comparison between the number of traps used in the entomological surveillance resulted in high (poor fit) or low
MSE(good fit). (B) ROC curve showing the number of traps that separating good fits from poor fits. The red line indicates the n = 16 traps that separates the two groups.
maximum capacity load of each neighborhood, once it also depends on the stated efficiency of the trapping system to sample the adult population. In other words, a more attractive trap would collect a larger sample of the flying population than a less attractive one and the number of collect mosquitoes will affect the estimatedK. Resende et al. [30] showed that trap sensitivity (Positive MosquiTRAP Index) increased significantly with 8 traps per block in both high and low abundance areas, suggesting that higher densities of MosquiTRAPs may be required for monitoringAe. aegypti.
In the literature, there are suggestions thatAe. aegypticarrying capacity should increase with human population density and the amount of breeding sites produced by poor managed garbage disposal, and water storage. In Vito´ria, we have found evidence for association ofK
with garbage in the streets. The negative association between the% households in streets with-out manholesandKcould be explained by manholes functioning as oviposition sites in the urban landscape. The presence of immatureAe. aegyptiin the drainage system without clean-ing and maintenance is well understood [38,39], being considered a potential breeding site by the Center for Disease Control and Prevention (CDC) [40]. In Brazil, it is commonly stated
Fig 6. Maps of Vito´ria, ES, neighborhoods.Maps show estimated carrying capacityK(green), the average entomological indexaIMFA(blue),% households with garbage in the streets(black) and% households in streets without manhole(red), respectively. The underlying shapefile with Vito´ria municipality and
neighborhoods used to build this figure is publicly available and free to use atInstituto Brasileiro de Geografia e Estatística(IBGE, Brazilian Institute of Geography and Statistics) websitehttp://downloads.ibge.gov.br/downloads_geociencias.htm.
that most breeding sites are within the households and their owners should be responsible for their removal. Although we did not directly address this hypothesis, the results presented here suggest that the landscape outside the households also contributes to the carrying capacity of
Ae. aegypti. Differences in receptivity conditions, as found in the neighborhoods of Vito´ria, are expected in an urban landscape. It is likely that even within neighborhoods, the short flight capacity ofAe. aegyptiwill favor the formation of small clusters of mosquitoes [41]. Therefore, improving sanitary conditions and public services to reduce mosquito density is an important control policy [42,43] as well as defining and directing more intense efforts of vector control actions to the clusters of greater risk.
The entomological surveillance program implemented in Vito´ria operates with 2 to 149 traps per neighborhood, which is the spatial scale at whichIMFAis calculated and control actions implemented. Our results have indicated that the estimation of carrying capacity is affected by the sampling effort (number of traps). Small neighborhoods, with small sampling effort, were found to have less precise trap data to be modeled. A closer inspection indicates a higher variability inIMFAas sample size decreases. Better than average goodness-of-fit has been only observed with 16 or more traps installed (Fig 5). Although this is not a study designed for sample size calculation, our results suggest that a minimum of 16 traps should be considered for monitoring a neighborhood. Otherwise, if less traps are delivered per area, than
IMFAshould be calculated with less spatial resolution.
There are some limitations in this study. The satellite data is only reliable on days with few clouds, and under perfect conditions, every 8 days. There is only one meteorological sta-tion in the city, at the airport. Cities with the geographical complexity of Vitoria should have meteorological surveillance integrated with their entomological surveillance. The microclimate variations within a city can be strong enough to offer different survival and reproduction con-ditions for invertebrates [44] such asAe. aegypti. The model also present limitations, as it con-siders temperature as the only source of temporal variation. Rainfall and relative air humidity may be extra sources of variation that should be considered in future models. It is also neces-sary to further explore spatial dependences between neighborhoods. Finally, the parameters of the model, except forK, were fixed in values obtained from the literature, which do not neces-sarily reflect the biology of the mosquitoes in Vito´ria.
In summary, the trap based surveillance system employed in Vito´ria delivers infestation indices that are consistent with the patterns predicted byAe. aegyptiecological models. This result supports the usefulness of the trap-based surveillance for guidingAe. aegypticontrol programs, in combination with mathematical models that allow the estimation of the unob-servable carrying capacity. For local assessments, the quality of the indices depended on the trap sample size. We recommend thatIMFAindices should be calculated with at least 16 traps per neighborhood. From a modeling perspective, this study highlights the importance of math-ematical models beyond their applications in ecology. Besides estimating latent (hidden) vari-ables, once calibrated, models can be used to point out geographic areas and levels for the control of vector-borne diseases.
Supporting information
S1 Table. Convert data used for analysis.IMFA and temperature data. (XLS)
S1 Appendix. Equilibrium states and mathematical relationship between carrying capacity (K) and capture rate (α).
Acknowledgments
We thanks to Ecovec and the municipalities for allowing the use of mosquito sample data. AEE thanks to CNPq (Conselho Nacional de Desenvolvimento Cientı´fico e Tecnolo´gico) for the fellowship. Alexandra Almeida for help in estimate missing data in time series.
Author Contributions
Conceptualization:Raquel Martins Lana, Maı´ra Moreira Morais, Tiago Garcia de Senna Car-neiro, Cla´udia Torres Codec¸o.
Data curation:Raquel Martins Lana, Maı´ra Moreira Morais, Tiago Franc¸a Melo de Lima, Jef-ferson Pereira Caldas dos Santos, Cla´udia Torres Codec¸o.
Formal analysis:Raquel Martins Lana, Maı´ra Moreira Morais, Tiago Franc¸a Melo de Lima, Jose´ Joaquı´n Carvajal Corte´s, Cla´udia Torres Codec¸o.
Investigation:Raquel Martins Lana, Maı´ra Moreira Morais, Lucas Martins Stolerman.
Methodology:Raquel Martins Lana, Maı´ra Moreira Morais, Tiago Garcia de Senna Carneiro, Lucas Martins Stolerman, Cla´udia Torres Codec¸o.
Supervision:Cla´udia Torres Codec¸o.
Visualization:Raquel Martins Lana, Maı´ra Moreira Morais, Cla´udia Torres Codec¸o.
Writing – original draft:Raquel Martins Lana, Maı´ra Moreira Morais, Cla´udia Torres Codec¸o.
Writing – review & editing:Raquel Martins Lana, Maı´ra Moreira Morais, Tiago Franc¸a Melo de Lima, Lucas Martins Stolerman, Jose´ Joaquı´n Carvajal Corte´s, A´ lvaro Eduardo Eiras, Cla´udia Torres Codec¸o.
References
1. LaBeaud A, Bashir F, King CH. Measuring the burden of arboviral diseases: the spectrum of morbidity and mortality from four prevalent infections. Popul Health Metr. 2011; 9(1):1.https://doi.org/10.1186/ 1478-7954-9-1PMID:21219615
2. Rodriguez-Morales AJ, Villamil-Go´mez WE, Franco-Paredes C. The arboviral burden of disease caused by co-circulation and co-infection of dengue, chikungunya and Zika in the Americas. Travel Med Infect Dis. 2016; 14(3):177–179.https://doi.org/10.1016/j.tmaid.2016.05.004PMID:27224471
3. Weaver SC, Reisen WK. Present and future arboviral threats. Antiviral Res. 2010; 85(2):328–345.
https://doi.org/10.1016/j.antiviral.2009.10.008PMID:19857523
4. Jourdain F, Roiz D, Perrin Y, Grucker K, Simard F, Paupy C. Facteurs entomologiques d’e´mergence des arboviroses. Transfus Clin Biol. 2015; 22(3):101–106.https://doi.org/10.1016/j.tracli.2015.06.001
PMID:26141429
5. Brasil. Diretrizes nacionais para prevenc¸ão e controle de epidemias de dengue. Brası´lia: Ministe´rio da Sau´de—Secretaria de Vigilaˆncia em Sau´de—Departamento de Vigilaˆncia Epidemiolo´gica; 2009. 6. Codec¸o CT, Lima AWS, Arau´jo SC, Lima JBP, Maciel-de Freitas R, Hono´rio NA, et al. Surveillance of
Aedes aegypti: Comparison of House Index with Four Alternative Traps. PLoS Negl Trop Dis. 2015; 9 (2):1–23.
7. Sivagnanam N, Gunasekaran K. Need for an efficient adult trap for the surveillance of dengue vectors. Indian J Med Res. 2012; 136:739–749.
8. Morrison A, Gray K, Getis A. Temporal and geographic patterns ofAedes aegypti(Diptera: Culicidae) production in Iquitos, Peru. J Med Entomol. 2004; 41(6):1123–1142. https://doi.org/10.1603/0022-2585-41.6.1123PMID:15605653
10. SES/ES. Plano de Contingência Estadual da Dengue 2014–2015. Vito´ria: Secretaria Estadual de Sau´de, Governo do Estado do Espı´rito Santo; 2014.
11. SVS/MS. Vigilaˆncia em Sau´de no SUS: fortalecendo a capacidade de reposta ao velhos e novos desa-fios. Brası´lia: Ministe´rio da Saude; 2006. Available from:http://bvsms.saude.gov.br/bvs/publicacoes/ vigilancia_saude_SUS.pdf.
12. Fa´varo EA, Dibo MR, Mondini A, Ferreira AC, Barbosa AAC, Eiras A´ E, et al. Physiological state of
Aedes(Stegomyia)aegyptimosquitoes captured with MosquiTRAPs in Mirassol, São Paulo, Brazil. J Vector Ecol. 2006; 31(2):285–291.https://doi.org/10.3376/1081-1710(2006)31%5B285:PSOASA% 5D2.0.CO;2PMID:17249346
13. Eiras A´ E, de Resende MC. Preliminary evaluation of the “Dengue-MI” technology forAedes aegypti
monitoring and control. Cad Saude Pu´blica, Rio de Janeiro. 2009; 25(Sup 1):S45–S58.https://doi.org/ 10.1590/S0102-311X2009001300005
14. Pepin KM, Marques-Toledo C, Scherer L, Morais MM, Ellis B, Eiras AE. Cost-effectiveness of Novel System of Mosquito Surveillance and Control, Brazil. Emerg Infect Dis. 2013; 19(4):542–550.https:// doi.org/10.3201/eid1904.120117PMID:23628282
15. Degener CM, de A´zara TMF, Roque RA, Codec¸o CT, Nobre AA, Ohly JJ, et al. Temporal abundance of
Aedes aegyptiin Manaus, Brazil, measured by two trap types for adult mosquitoes. Mem Inst Oswaldo Cruz. 2014; 109(8):1030–1040.https://doi.org/10.1590/0074-0276140234PMID:25494470
16. Hono´rio ANA, Codec¸o CT, Alves FC, Magalhães MAFM, Codec CT. Temporal distribution ofAedes aegyptiin different districts of Rio de Janeiro, Brazil, measured by two types of traps. J Med Entomol. 2009; 46(5):1001–1014.https://doi.org/10.1603/033.046.0505PMID:19769029
17. Couret J, Benedict MQ. A meta-analysis of the factors influencing development rate variation inAedes aegypti(Diptera: Culicidae). BMC Ecol. 2014; 14(1):3.https://doi.org/10.1186/1472-6785-14-3PMID:
24495345
18. Dye C. Intraspecific competition amongst larvalAedes aegypti: food exploitation or chemical interfer-ence? Ecol Entomol. 1982; 7(1):39–46.https://doi.org/10.1111/j.1365-2311.1982.tb00642.x
19. Legros M, Lloyd A, Huang Y, Gould F. Density-dependent intraspecific competition in the larval stage of
Aedes aegypti(Diptera: Culicidae): revisiting the current paradigm. J Med Entomol. 2009; 46(3):409– 419.https://doi.org/10.1603/033.046.0301PMID:19496407
20. Hui C. Carrying capacity, population equilibrium, and environment’s maximal load. Ecol Modell. 2006; 192(1):317–320.https://doi.org/10.1016/j.ecolmodel.2005.07.001
21. Lana R, Carneiro T, Hono´rio N, Codec¸o C. Seasonal and nonseasonal dynamics ofAedes aegyptiin Rio de Janeiro, Brazil: Fitting mathematical models to trap data. Acta Trop. 2014; 129:25–32.https:// doi.org/10.1016/j.actatropica.2013.07.025PMID:23933186
22. IBGE. Instituto Brasileiro de Geografia e Estatı´stica- Cidades; 2010. Available from:http://www. cidades.ibge.gov.br.
23. Thomson MC, Ukawuba I, Hershey CL, Bennett A, Ceccato P, Lyon B, et al. Using Rainfall and Temper-ature Data in the Evaluation of National Malaria Control Programs in Africa. Am J Trop Med Hyg. 2017; 97(3_Suppl):32–45.https://doi.org/10.4269/ajtmh.16-0696PMID:28990912
24. Zhao N, Lu N, Chen C, Li H, Yue T, Zhang L, et al. Mapping temperature using a Bayesian statistical method and a high accuracy surface modelling method in the Beijing–Tianjin–Hebei region, China. Meteorological Applications. 2017; 24(4):571–579.https://doi.org/10.1002/met.1657
25. Zeileis A, Grothendieck G. zoo: S3 Infrastructure for Regular and Irregular Time Series. Journal of Sta-tistical Software. 2005; 14(6):1–27.https://doi.org/10.18637/jss.v014.i06
26. R Core Team. R: A Language and Environment for Statistical Computing; 2017.
27. INCAPER. Instituto Capixaba de Pesquisa, Assistência Te´cnica e Extensão Rural; 2016. Available from:https://incaper.es.gov.br.
28. Focks D, Haile D. Dynamic life table model forAedes aegypti(Diptera: Culicidae): simulation results and validation. J Med Entomol. 1993; 30(6):1018–1028.https://doi.org/10.1093/jmedent/30.6.1018
PMID:8271243
29. Schoolfield RM, Sharpe PJH, Magnuson CE. Non-linear regression of biological temperature-depen-dent rate models based on absolute reaction-rate theory. J Theor Biol. 1981; 88(4):719–731.https://doi. org/10.1016/0022-5193(81)90246-0PMID:6790878
30. de Resende MC, de A´ zara TMF, Costa IO, Heringer LC, de Andrade MR, Acebal JL, et al. Field optimi-sation of MosquiTRAP sampling for monitoringAedes aegypti Linnaeus(Diptera: Culicidae). Mem Inst Oswaldo Cruz. 2012; 107(3):294–302.https://doi.org/10.1590/S0074-02762012000300002
32. Soetaert K, Petzoldt T. Inverse Modelling, Sensitivity and Monte Carlo Analysis in R Using Package FME. J Stat Softw. 2010; 33(3):1–28.https://doi.org/10.18637/jss.v033.i03
33. Sing T, Sander O, Beerenwinkel N, Lengauer T. ROCR: visualizing classifier performance in R. Bioin-formatics. 2005; 21(20):3940–3941.https://doi.org/10.1093/bioinformatics/bti623PMID:16096348
34. Brady OJ, Golding N, Pigott DM, Kraemer MUG, Messina JP, Reiner RC Jr, et al. Global temperature constraints onAedes aegyptiandAe. albopictuspersistence and competence for dengue virus trans-mission. Parasit Vectors. 2014; 7(1):338.https://doi.org/10.1186/1756-3305-7-338PMID:25052008
35. Kraemer MU, Sinka ME, Duda KA, Mylne AQ, Shearer FM, Barker CM, et al. The global distribution of the arbovirus vectorsAedes aegyptiandAe. albopictus. Elife. 2015; 4.https://doi.org/10.7554/eLife. 08347PMID:26126267
36. Alto BW, Juliano SA. Temperature Effects on the Dynamics ofAedes albopictus(Diptera: Culicidae) Populations in the Laboratory. J Med Entomol. 2001; 38(4):548–556. https://doi.org/10.1603/0022-2585-38.4.548PMID:11476335
37. Kobayashi M, Nihei N, Kurihara T. Analysis of Northern Distribution ofAedes albopictus(Diptera: Culici-dae) in Japan by Geographical Information System. J Med Entomol. 2002; 39(1):4–11.https://doi.org/ 10.1603/0022-2585-39.1.4PMID:11931270
38. Manrique-Saide C, Arisqueta-Chable E, Geded-Moreno J, Herrera-Bojorquez V, Uc J, Chable-Santos A, Che-Mendoza EC, Sanchez JI, Arredondo-Jimenez A MB. An assessment of the importance of sub-surface catch basins for Aedes aegypti adult production during the dry season in a neighborhood of Merida, Mexico. J Am Mosq Contr Assoc. 2013; 29:164–167.https://doi.org/10.2987/12-6320R.1. 39. Paploski IAD, Rodrigues MS, Mugabe VA, Kikuti M, Tavares AS, Reis MG, et al. Storm drains as larval
development and adult resting sites for Aedes aegypti and Aedes albopictus in Salvador, Brazil. Para-sites & Vectors. 2016; 9(1):419.https://doi.org/10.1186/s13071-016-1705-0
40. CDC. Surveillance and control of Aedes aegypti and Aedes albopictus in the United States. Atlanta, USA: Centers for Disease Control and Prevention (CDC), National Center for Emerging and Zoonotic Infectious Diseases (NCEZID) Division of Vector-Borne Diseases (DVBD); 2017. Available from:http:// www.cdc.gov/chikungunya/resources/vector-control.html.
41. Silva Lima A, Hono´rio N, Codec¸o C. Spatial Clustering ofAedes aegypti(Diptera: Culicidae) and Its Impact on Entomological Surveillance Indicators. J Med Entomol. 2016; 53(2):343–348.https://doi.org/ 10.1093/jme/tjv187PMID:26659607
42. Chiaravalloti Neto F. Descric¸ão da colonizac¸ão deAedes aegyptina região de São Jose´ do Rio Preto, São Paulo. Rev Soc Bras Med Trop. 1997; 30(4):279–285.
https://doi.org/10.1590/S0037-86821997000400002PMID:9265223
43. Macoris MLG, Mazine CAB, Andrighetti MTM, Yasumaro S, Silva ME, Nelson MJ, et al. Factors favoring houseplant container infestation withAedes aegyptilarvae in Marı´lia, São Paulo, Brazil. Rev Panam Salud Publica. 1997; 1(4):280–286.https://doi.org/10.1590/S1020-49891997000400004PMID:
9149524