American Dairy Science Association, 2005.
Genetic Parameter Estimates of Portuguese Dairy Cows for Milk, Fat,
and Protein Using a Spline Test-Day Model
A. M. Silvestre, F. Petim-Batista, and J. Colac¸o
Departamento de Zootecnia - CECAV, Universidade de Tra´s-os-Montes e Alto Douro 5000-911 Vila Real, Portugal
ABSTRACT
A spline animal model was fitted to 152,103 test-day milk, fat, and protein yield records from 14,423 first-lactation cows. The models included age at calving and the herd-test-month as fixed effects. Model fitting was carried out using Restricted Maximum Likelihood with ASREML. For milk yield, the heritability at 18 d in milk was 0.19, which increased to the maximum estimated value of 0.23 at midlactation and then decreased. On average, milk, fat, and protein yield heritabilities were 0.22, 0.14, and 0.19, respectively.
For milk yield, all correlations were positive and ranged from 0.54 to 0.99 for the genetic component and from 0.32 to 0.78 for the phenotypic component. Genetic correlations were higher than phenotypic ones. For fat and protein yields, all genetic correlations were posi-tive, ranging from 0.43 to 0.99. The phenotypic correla-tions for fat yield had the lowest correlacorrela-tions of the 3 traits.
Curves of estimated breeding values for milk, fat, and protein over lactation had positive deviations from mean curves for sires with high genetic merit, but there was considerable variability in the shapes of the curves for different sires. More research is needed to compare the spline function with other mathematical functions used as submodels of lactation curve.
(Key words: dairy cow, cubic spline, genetic effect, breeding value curve)
Abbreviation key: rg= genetic correlation, rp=
pheno-typic correlation, TD = test-day.
INTRODUCTION
The use of test-day yield instead of 305-d lactation yields has recently become the focus of much research in dairy genetics (Gengler et al., 1999; Tijani et al., 1999). Several studies have confirmed that environ-mental effects can be accounted for with greater
preci-Received December 5, 2003. Accepted November 11, 2004.
Corresponding author: A. M. Silvestre; e-mail: [email protected].
1225
sion when an effect for test day (TD) is included (Ptak and Schaeffer, 1993; Swalve, 1995; Brotherstone et al., 2000; Pool et al., 2000). Different methods have been proposed to estimate the (co)variance structure among TD. In methods using multitrait analysis, different test-day yields are treated as different traits but the multitrait (co)variance components obtained do not allow a direct continuous description of the (co)variance structure (Gengler et al., 2001). Another method is based on the analysis of TD data with a model that estimates random regression coefficients of the lacta-tion curve for each animal (Jamrozik and Schaeffer, 1997; Brotherstone et al., 2000). The use of covariance functions to fit different covariances in repeated records has also been applied by Kirkpatrick et al. (1994) and Meyer and Hill (1997).
Verbyla et al. (1999) demonstrated that cubic smooth-ing splines could be fitted into the mixed model frame-work. A cubic spline is a smooth curve over an interval formed by linked segments of cubic polynomials at cer-tain knot-points, so that the whole curve and its first and second differentials are continuous over the inter-val (Green and Silverman, 1994). According to Jensen (2001), spline models applied to TD data are a class of test-day models. Swalve (2000), Huisman et al. (2002), and Guo and Schaeffer (2002) classified the spline model as a random regression test-day model with a spline function as a submodel of the lactation curve. The ASREML software (Gilmour et al., 2000) has made the computations practical and White et al. (1999) have applied this methodology to estimate genetic parame-ters for dairy cow lactation curves. Subsequently, Huis-man et al. (2001, 2002) applied the spline model to describe the growth curve in pigs at the genetic level. However, no information is available on whether this procedure is appropriate for fat yield and protein yield in dairy cattle.
The aim of this study was to estimate the genetic and permanent environmental parameters of Portuguese dairy cows’ TD data by applying a cubic spline mixed model to milk, fat, and protein yields.
MATERIALS AND METHODS
Monthly test-day records were provided by EABL (Estac¸a˜o de Apoio a` Bovinicultura Leiteira). Records
consisted of first-lactation milk, fat, and protein yields of dairy cows from January 1993 through September 1997. Test days with lack of proper identification, lack of information on birth, calving, or test date, test-day intervals shorter than 26 d or more than 35 d, and lack of first measurement between d 5 and 32, were not used. Records of cows calving before 20 mo or after 36 mo of age were also rejected. Only completed lactations with 8 to 12 TD records were retained. The percentage of lactation records excluded due to this edit was mini-mal. Each daily yield curve was modeled as a spline function deviation from the average spline curve. The study was undertaken with 152,103 observations of 14,423 first lactations.
Test-day records were fitted with a cubic spline mixed model (1). Fixed effects in the model were HTD (herd– year of test–class of month of test day) and age at calv-ing. Because there are no available data on a large scale of BW and body condition, the inclusion of age at calving in the model may partially reflect these differences, but also reflects other factors that may differ with maturity and over time. According to Keown and Everett (1986), Gallo et al. (1996), and Pryce et al. (2002), those factors would provide a better biological explanation of differ-ences in milk synthesis capacity. The spline function was used to model milk, fat, or protein yield as a func-tion of DIM. Moreover, the model has 2 random parts: one for the animal effect and another that accounts for repeated measurements on the same animal. The model used was: yijk= HTDi+ b0Agej+ b1+ b2tjk +
∑
q−1 m=2 v0mzm(tjk) + bj0+ bj1tjk+∑
q−1 m=2 v1jmzm(tjk) [1] + bj2+ bj3tjk+∑
q−1 m=2 v2jmzm(tjk) + eijkwhere yijkis the kth observation on milk, fat, or protein yield, made on animal j, on day tjkwithin the ith class of HTD and with the age at calving Agej, with b0as a fixed coefficient. The b1and b2terms are the coefficients of an overall linear regression. The bj0 and bj1 coeffi-cients (animal, animal× time) describe the linear devia-tion from the overall regression for animal j and the bj2 and bj3 coefficients (permanent environment, perma-nent environment× time) describe the deviation from the overall regression for permanent environment for animal j. The term v0m represents the estimate for a mean spline-coefficient at the knotpoint m and q is the number of knots. For this mean, curves used 12 knots placed at the mean number of DIM for each TD for all the considered lactations. The terms v1jm and v2jm
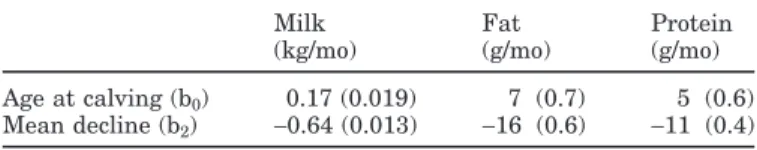
Table 1. Age at calving effect and mean decline in production effects
for milk, fat, and protein yields.
Milk Fat Protein
(kg/mo) (g/mo) (g/mo) Age at calving (b0) 0.17 (0.019) 7 (0.7) 5 (0.6) Mean decline (b2) −0.64 (0.013) −16 (0.6) −11 (0.4)
represents the estimates for the spline-coefficient of animal j and permanent environment of animal j, re-spectively, at the knotpoint m, and zm(tjk) are the ran-dom spline-coefficient for test day tjk. This implies that the genetic and permanent environmental effects are modeled as deviations from the average spline curve. The residual variance was assumed constant for each TD but was allowed to vary between tests. In matrix no-tation:
Y = Xβ + Zsa + Zspe + e
where Y was a vector containing the observations, β was the vector containing the fixed effects, X was an incidence matrix, which indicates for each observation the fixed effects by which it was influenced, Zs was an incidence matrix containing the spline coefficients for each observation in blocks of animals, a was a matrix containing the estimates for genetic spline effects, pe was a matrix containing the estimates for permanent environment spline effects, and e was the residual vari-ance term. The model was fitted using ASREML (Gil-mour et al., 2000).
RESULTS AND DISCUSSION
The spline animal model estimated a typical mean lactation curve for milk, fat, and protein, where there is a period of increase in early lactation followed by a continuous decrease after peak production. Results for the fixed effects of age at calving (b0) and mean decline in production (b2) are presented in Table 1. The term b0 represents the increase in production with an in-crease of 1 mo in age at calving. The value of b0= 0.17 kg/mo for milk was nearly identical to those reported by White et al. (1999). On a 305-d basis, the increase of 1 mo in age at calving represents an increase in lactation yield of 50, 2, and 1.5 kg of milk, fat, and protein, respectively. However, this represents a delay to the beginning of the dairy cow’s productive life.
In Table 2, estimates of additive genetic, permanent environmental and phenotypic variances and heritabil-ities are shown for the 3 traits of the study. The additive genetic variance at DIM 18 was 5.83, which fell to 4.08 in the following 3 tests and then reached the maximum estimated value of 6.33 at DIM 348. The milk genetic and phenotypic variance estimates shown in Table 2
Table 2. Days in milk, variance estimates, and heritabilities for milk, fat, and protein.
Milk Fat2 Protein2
DIM G1 EP P h2 G EP P h2 G EP P h2 18 5.83 15.11 30.09 0.19 6.07 21.42 52.06 0.12 4.68 12.14 27.02 0.17 48 4.57 11.55 22.23 0.21 4.77 15.57 40.50 0.12 3.49 9.18 20.06 0.17 78 4.09 9.89 19.86 0.21 4.24 12.96 37.19 0.11 3.16 7.84 18.72 0.17 108 4.08 9.43 19.11 0.21 4.19 12.39 34.59 0.12 3.34 7.56 18.25 0.18 138 4.25 9.59 18.69 0.23 4.39 12.78 33.18 0.13 3.71 7.84 18.30 0.20 168 4.41 9.91 19.17 0.23 4.65 13.34 33.52 0.14 4.05 8.32 19.14 0.21 198 4.46 10.18 19.04 0.23 4.88 13.67 32.59 0.15 4.23 8.80 19.29 0.22 228 4.38 10.39 19.63 0.22 5.08 13.76 33.31 0.15 4.26 9.28 20.26 0.21 258 4.30 10.78 19.99 0.22 5.34 14.03 33.16 0.16 4.25 9.95 21.34 0.20 288 4.41 11.77 21.38 0.21 5.84 15.26 34.77 0.17 4.44 11.19 23.08 0.19 318 4.98 13.97 23.70 0.21 6.83 18.52 38.03 0.18 5.13 13.48 25.32 0.20 348 6.33 18.06 29.95 0.21 8.59 25.03 45.91 0.19 6.68 17.39 31.45 0.21 1G = Additive genetic variance, EP = permanent environmental variance, P = phenotypic variance, h2= heritability.
2The variance estimates are multiplied by 103.
fall between the results of White et al. (1999) and Olori et al. (1999). The other additive genetic, permanent environmental and phenotypic variances tend to follow the same concave pattern of variation with a moderate oscillation at midlactation. Tijani et al. (1999) used co-variance functions developed by Gengler et al. (1999) to produce covariance functions for all days of lactation, and have concluded that the genetic variance increased with DIM. A contrary result (decreasing) has been pre-sented by Strabel and Misztal (1999) for the traits milk, fat, and protein. This variability in results may be par-tially explained by the fact that estimates of the
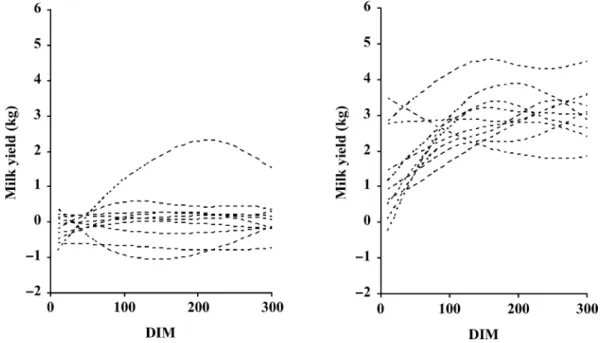
addi-Figure 1. Estimated breeding values for milk for 10 sires randomly selected (left) and for 10 sires with high genetic merit for milk
yield (right).
tive and permanent environmental components of vari-ance for test-day yields in a random regression model depend on the submodel fitted (Olori et al., 1999).
For milk yield, the heritability at DIM 18 was 0.19, which increased to the maximum estimated value of 0.23 at midlactation and then decreased. Results re-ported by White et al. (1999) are similar to these in terms of pattern. However, that study found higher heritabilities. The heritability for fat yield follows a crescent trajectory. Furthermore, the heritability for protein yield showed a pattern of variation reasonably similar to that described above for milk heritability.
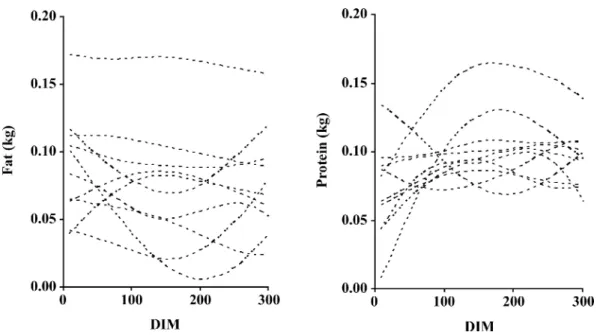
Figure 2. Estimated breeding values for fat (left) and protein (right) for 10 sires with high genetic merit for milk production.
Additionally, the heritability of milk, fat, and protein yields over the DIM considered in Table 2 were, on average, 0.22, 0.14, and 0.19, respectively. Other re-search reported higher (Pander et al., 1992, 1993; Swalve, 1995; Jamrozik and Schaeffer, 1997) or lower (Meyer et al., 1989; Veerkamp and Goddard, 1998; Gen-gler et al. 1999; Tijani et al., 1999; GenGen-gler et al., 2001) estimates of heritabilities for milk, fat, and protein. The results of these authors have shown that heritabilities for fat were, in almost all cases, lower than the herita-bilities for protein, and that milk production has the highest heritability, which is in accordance with Ta-ble 2.
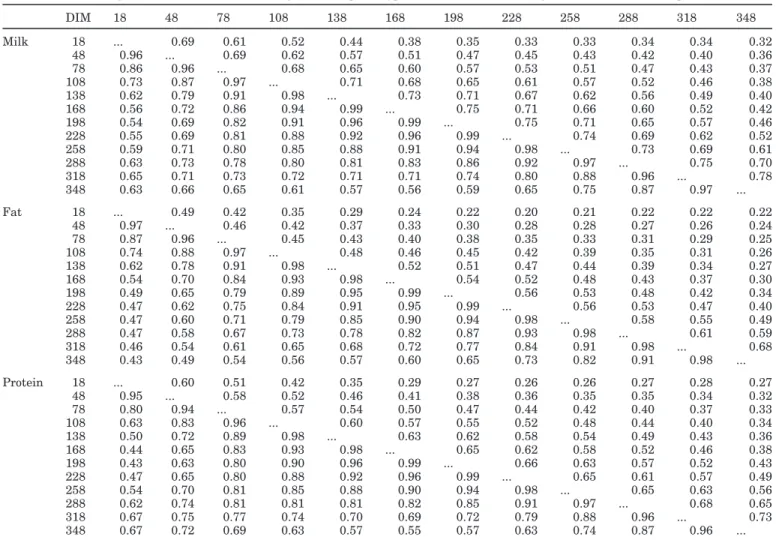
Estimated genetic (rg) and phenotypic (rp) correla-tions between tests are shown in Table 3. For milk yield, all correlations were positive ranging from 0.54 to 0.99 for rgand from 0.32 to 0.78 for rp. Genetic tions were always higher than the phenotypic correla-tions. Adjacent tests have a minimum rgvalue of 0.96 and the highest values are located at midlactation. Higher estimates of genetic correlations between TD yields throughout lactation have been reported by White et al. (1999). This pattern of variation has simi-larities with results achieved by Brotherstone et al. (2000) and Kettunen et al. (2000). Phenotypic correla-tions decreased from the maximum value of 0.78 on adjacent tests to 0.32 between 18 and 348 DIM, whereas White et al. (1999) reported that phenotypic correla-tions for milk yield ranged from 0.40 to 0.75. For fat and protein yields, all rg were positive, ranging from 0.43 to 0.99. The rpresults for fat production have the lowest values over all the 3 traits. Genetic correlations
for protein yield showed some lack of consistency be-tween the beginning and the end of lactation. However, all genetic correlations were positive in the 3 traits of this study. Brotherstone et al. (2000) reports negative genetic correlations for milk yield when 2 parametric functions [Wilmink (1987) and Ptak and Schaeffer (1993)] were used.
In Figure 1, two sets of sire breeding value curves for milk production are presented. They are expressed as deviations from the mean lactation curve. One set concerns 10 sires randomly selected from the 1824 sires, whereas the other set illustrates curves for 10 sires with high genetic merit for milk production. For the ranking of sires, we used the bj0result (see model) as a scale criterion, comparable to a lactation yield criterion. Although most of the 10 random curves are similar in shape, with some scale variation, there is considerable variation in shape for 2 of them. The curves for the 10 sires with high genetic merit show, as expected, a positive deviation from the mean lactation curve, and the shapes differ greatly from the others. On the other hand, we can see in Figure 2 that these 10 sires with high genetic merit for milk production show a positive deviation from the respective mean lactation curve for fat and protein yields. However, in those cases, the breeding value curves were more variable for fat than for protein; and this could indicate a higher correlation between milk and protein than between milk and fat. So, Figures 1 and 2 elucidate the good flexibility of the spline methodology for describing the shape of the breeding value curves. White et al. (1999) noticed that
Table 3. Estimated genetic correlations (below diagonal) and phenotypic correlations (above diagonal) for milk, fat, and protein. DIM 18 48 78 108 138 168 198 228 258 288 318 348 Milk 18 ... 0.69 0.61 0.52 0.44 0.38 0.35 0.33 0.33 0.34 0.34 0.32 48 0.96 ... 0.69 0.62 0.57 0.51 0.47 0.45 0.43 0.42 0.40 0.36 78 0.86 0.96 ... 0.68 0.65 0.60 0.57 0.53 0.51 0.47 0.43 0.37 108 0.73 0.87 0.97 ... 0.71 0.68 0.65 0.61 0.57 0.52 0.46 0.38 138 0.62 0.79 0.91 0.98 ... 0.73 0.71 0.67 0.62 0.56 0.49 0.40 168 0.56 0.72 0.86 0.94 0.99 ... 0.75 0.71 0.66 0.60 0.52 0.42 198 0.54 0.69 0.82 0.91 0.96 0.99 ... 0.75 0.71 0.65 0.57 0.46 228 0.55 0.69 0.81 0.88 0.92 0.96 0.99 ... 0.74 0.69 0.62 0.52 258 0.59 0.71 0.80 0.85 0.88 0.91 0.94 0.98 ... 0.73 0.69 0.61 288 0.63 0.73 0.78 0.80 0.81 0.83 0.86 0.92 0.97 ... 0.75 0.70 318 0.65 0.71 0.73 0.72 0.71 0.71 0.74 0.80 0.88 0.96 ... 0.78 348 0.63 0.66 0.65 0.61 0.57 0.56 0.59 0.65 0.75 0.87 0.97 ... Fat 18 ... 0.49 0.42 0.35 0.29 0.24 0.22 0.20 0.21 0.22 0.22 0.22 48 0.97 ... 0.46 0.42 0.37 0.33 0.30 0.28 0.28 0.27 0.26 0.24 78 0.87 0.96 ... 0.45 0.43 0.40 0.38 0.35 0.33 0.31 0.29 0.25 108 0.74 0.88 0.97 ... 0.48 0.46 0.45 0.42 0.39 0.35 0.31 0.26 138 0.62 0.78 0.91 0.98 ... 0.52 0.51 0.47 0.44 0.39 0.34 0.27 168 0.54 0.70 0.84 0.93 0.98 ... 0.54 0.52 0.48 0.43 0.37 0.30 198 0.49 0.65 0.79 0.89 0.95 0.99 ... 0.56 0.53 0.48 0.42 0.34 228 0.47 0.62 0.75 0.84 0.91 0.95 0.99 ... 0.56 0.53 0.47 0.40 258 0.47 0.60 0.71 0.79 0.85 0.90 0.94 0.98 ... 0.58 0.55 0.49 288 0.47 0.58 0.67 0.73 0.78 0.82 0.87 0.93 0.98 ... 0.61 0.59 318 0.46 0.54 0.61 0.65 0.68 0.72 0.77 0.84 0.91 0.98 ... 0.68 348 0.43 0.49 0.54 0.56 0.57 0.60 0.65 0.73 0.82 0.91 0.98 ... Protein 18 ... 0.60 0.51 0.42 0.35 0.29 0.27 0.26 0.26 0.27 0.28 0.27 48 0.95 ... 0.58 0.52 0.46 0.41 0.38 0.36 0.35 0.35 0.34 0.32 78 0.80 0.94 ... 0.57 0.54 0.50 0.47 0.44 0.42 0.40 0.37 0.33 108 0.63 0.83 0.96 ... 0.60 0.57 0.55 0.52 0.48 0.44 0.40 0.34 138 0.50 0.72 0.89 0.98 ... 0.63 0.62 0.58 0.54 0.49 0.43 0.36 168 0.44 0.65 0.83 0.93 0.98 ... 0.65 0.62 0.58 0.52 0.46 0.38 198 0.43 0.63 0.80 0.90 0.96 0.99 ... 0.66 0.63 0.57 0.52 0.43 228 0.47 0.65 0.80 0.88 0.92 0.96 0.99 ... 0.65 0.61 0.57 0.49 258 0.54 0.70 0.81 0.85 0.88 0.90 0.94 0.98 ... 0.65 0.63 0.56 288 0.62 0.74 0.81 0.81 0.81 0.82 0.85 0.91 0.97 ... 0.68 0.65 318 0.67 0.75 0.77 0.74 0.70 0.69 0.72 0.79 0.88 0.96 ... 0.73 348 0.67 0.72 0.69 0.63 0.57 0.55 0.57 0.63 0.74 0.87 0.96 ...
a particular advantage of the spline approach is the extra flexibility it offers in the shape of fitted curves.
CONCLUSIONS
The spline animal model estimated a typical mean lactation curve. This methodology allowed us to esti-mate genetic and environmental correlations. Sires with high genetic merit for milk production produced estimated breeding value curves for milk, fat and pro-tein with a positive deviation from the mean curve and had considerable variability in shape. However, per-haps due to its more recent implementation, the splines mixed model framework has not yet achieved the popu-larity of other random regression models.
ACKNOWLEDGMENTS
The authors are grateful to Arthur Gilmour, Ian White, and Anne Winkelman for helpful advice. We also thank Arthur Gilmour for providing the ASREML software, and thank the reviewers of this manuscript.
REFERENCES
Brotherstone, S., I. M. S. White, and K. Meyer. 2000. Genetic model-ling of daily milk yield using orthogonal polynomials and para-metric curves. Br. J. Anim. Sci. 70:407–415.
Gallo, L., P. Carnier, M. Cassandro, R. Mantovani, L. Bailoni, B. Contiero, and G. Bittante. 1996. Change in body condition score of Holstein cows as affected by parity and mature equivalent milk yield. J. Dairy Sci. 79:1009–1015.
Gengler, N., A. Tijani, G. R. Wiggans, and J. C. Philpot. 2001. Indirect estimation of (co)variance functions for test-day yields during first and second lactations in the United States. J. Dairy Sci. 84:542. Online. Available http://jds.fass.org.
Gengler, N., A. Tijani, G. R. Wiggans, C. P. Van Tassell, and J. C. Philpot. 1999. Estimation of (co)variances of test day yields for first-lactation Holsteins in the United States. J. Dairy Sci. 82:225. Online. Available http://jds.fass.org.
Gilmour, A. R., R. Thompson, B. R. Cullis, and S. J. Welham. 2000. ASREML Reference Manual. New South Wales Agriculture, Or-ange, Australia.
Green, P. J., and B. W. Silverman. 1994. Nonparametric regression and generalized linear models. A roughness penalty approach. Chapman & Hall, London, UK.
Guo, Z., and L. R. Schaeffer. 2002. Random regression submodel comparison. 7th World Congr. Genet. Appl. Livest. Prod., CD-ROM communication No. 20-08.
Huisman, A. E., R. F. Veerkamp, and J. A. M. Van Arendonk. 2002. Genetic parameters for various random regression models to de-scribe the weight data of pigs. J. Anim. Sci. 80:575–582.
Jamrozik, J., and L. R. Schaeffer. 1997. Estimates of genetic parame-ters for a test day model with random regressions for yield traits of first-lactation Holsteins. J. Dairy Sci. 80:762–770.
Jensen, J. 2001. Genetic evaluation of dairy cattle using test-day models. J. Dairy Sci. 84:2803–2812.
Keown, J. F., and R. W. Everett. 1986. Effect of days carried calf, days dry, and weight of first calf heifers on yield. J. Dairy Sci. 69:1891–1896.
Kettunen, A., E. A. Ma¨ntysaari, and J. Po¨so¨. 2000. Estimation of genetic parameters for daily milk yield of primiparous Ayrshire cows by random regression test-day models. Livest. Prod. Sci. 66:251–261.
Kirkpatrick, M., W. G. Hill, and R. Thompson. 1994. Estimating the covariance structure of traits during growth and ageing, illus-trated with lactation in dairy cattle. Genet. Res. Camb. 64:57–69. Meyer, K., H. U. Graser, and K. Hammond. 1989. Estimates of genetic parameters for first lactation test day production of Australian Black and White cows. Livest. Prod. Sci. 21:177–199.
Meyer, K., and W. G. Hill. 1997. Estimation of genetic and phenotypic covariance functions for longitudinal or “repeated” records by restricted maximum likelihood. Livest. Prod. Sci. 47:185–200. Olori, V. E., S. Brotherstone, W. G. Hill, and B. J. McGuirk. 1999.
Estimating variance components for test day milk records by restricted maximum likelihood with random regression animal model. Livest. Prod. Sci. 61:53–63.
Pander, B. L., W. G. Hill, and R. Thompson. 1992. Genetic parameters of test day records of British Holstein-Friesian heifers. Anim. Prod. 55:11–21.
Pander, B. L., R. Thompson, and W. G. Hill. 1993. The effect of increasing the interval between recordings on genetic parameters of test day records of British Holstein-Friesian heifers. Anim. Prod. 56:159–164.
Pool, M. H., L. L. G. Janss, and T. H. E. Meuwissen. 2000. Genetic parameters of Legendre polynomials for first-parity lactation curves. J. Dairy Sci. 83:2640–2649.
Pryce, J. E., M. P. Coffey, S. Brotherstone, and J. A. Woolliams. 2002. Genetic relationships between calving interval and body condition score conditional on milk yield. J. Dairy Sci. 85:1590–1595. Ptak, E., and L. R. Schaeffer. 1993. Use of test day yields for genetic
evaluation of dairy sires and cows. Livest. Prod. Sci. 34:23–34. Strabel, T., and I. Misztal. 1999. Genetic parameters for first and
second lactation milk yields of Polish Black and White cattle with random regression test-day models. J. Dairy Sci. 82:2805–2810. Swalve, H. H. 1995. The effect of test day models on the estimation of genetic parameters and breeding values for dairy yield traits. J. Dairy Sci. 78:929–938.
Swalve, H. H. 2000. Theoretical basis and computational methods for different test-day genetic evaluation methods. J. Dairy Sci. 83:1115–1124.
Tijani, A., G. R. Wiggans, C. P. Van Tassell, J. C. Philpot, and N. Gengler. 1999. Use of (co)variance functions to describe (co)vari-ances for test day yield. J. Dairy Sci. 82:226. Online. Available http://jds.fass.org.
Veerkamp, R. F., and M. E. Goddard. 1998. Covariance functions across herd production levels for test day records on milk, fat, and protein yield. J. Dairy Sci. 81:1690–1701.
Verbyla, A. P., B. R. Cullis, M. G. Kenward, and S. J. Welham. 1999. Smoothing splines in the analysis of designed experiments and longitudinal data. Appl. Stat. 48:269–311.
White, I. M. S., R. Thompson, and S. Brotherstone. 1999. Genetic and environmental smoothing of lactation curves with cubic splines. J. Dairy Sci. 82:632–638.
Wilmink, J. B. M. 1987. Adjustment of test-day milk, fat and protein yield for age, season and stage of lactation. Livest. Prod. Sci. 16:335–348.