Selected Results on Strong and Coulomb-Induced Correlations from the STAR Experiment
M. ˇSumbera for the STAR Collaboration
Nuclear Physics Institute, Academy of Sciences of the Czech Republic, 250 68 ˇReˇz, Czech Republic Received on 13 December, 2006
Using recent high-statistics STAR data from Au+Au and Cu+Cu collisions at full RHIC energy I discuss strong and Coulomb-induced final state interaction effects on identical (π−π) and non-identical (π−Ξ) particle correlations. Analysis ofπ−Ξcorrelations reveals the strong and Coulomb-induced FSI effects, allowing for the first time to estimate spatial extension ofπandΞsources and the average shift between them. Source imaging techniques provide clean separation of details of the source function and are applied to the one-dimensional rela-tive momentum correlation function of identical pions. For low momentum pions, and/or non-central collisions, a large departure from a single-Gaussian shape is observed.
Keywords: Heavy ions; Femtoscopy
I. INTRODUCTION
Progress in understanding the space-time structure of mul-tiparticle production via femtoscopy is currently driven by high-statistics data sets accumulated in heavy ion experiments at RHIC and SPS accelerator [1–4, 10]. In particular, an ambi-tious program of the STAR collaboration at RHIC exploiting good particle identification has already provided a vast vari-ety of femtoscopic measurements in different identical and non-identical particle systems, some of which were actually measured for the first time [4]. This contribution is a progress report on two currently pursued STAR femtoscopy analyses. Both of them were introduced already at the previous WPCF meeting last year in Kromˇeˇr´ıˇz [2]. The first focuses on non-identical particle correlations in rather exotic meson–baryon systemπ±−Ξ±[5]. Previous investigations have shown that correlations among these two charged hadrons reveal not only the Coulomb but also strong final state interaction (FSI) ef-fects [11, 12]. The order of magnitude difference in mass, plus∆B=1/∆S=2 gap in baryon/ strangeness quantum num-bers, makes theπ−Ξsystem an important tool to study the interplay between matter flow on the partonic and hadronic levels. The second analysis exploits particle correlations in a more conventional system of two identical charged pions [6]. Its aim is to understand the geometry of the source. The ul-timate and rather ambitious aspiration of this project is to ex-tract pion-pion scattering lengths. This goal will make heavy ion femtoscopic measurements fully competitive to a dedi-cated particle physics experiments trying to extract this im-portant parameter of the strong interaction [3, 7, 8]. Basic prerequisites for such measurements are good knowledge of correlations due to quantum statistics and Coulomb interac-tions.
II. STUDYING SPACE-TIME STRUCTURE OF MULTI-STRANGE BARYON SOURCE VIAπ−Ξ
CORRELATIONS
In ultra-relativistic heavy-ion collisions at RHIC, hot and dense strongly interacting matter is created exhibiting prop-erties of de-confined partonic matter [9, 13]. Almost instan-taneous equilibration of the produced matter is indicated by recent heavy flavor measurements [9, 14], and represents one
of the greatest puzzles coming from RHIC [9]. The early partonic collectivity also shows up in a subsequent evolution of the system leading to strong collective expansion of the bulk matter as demonstrated by large values of observed el-liptic flow [9, 13]. These observations are further substan-tiated by STAR multi–strange baryon measurements show-ing thatΞandΩbaryons reveal significant amount of ellip-tic flow which is comparable to ordinary non–strange baryons [15]. The sizable multi–strange baryon elliptic flow, which obeys constituent quark scaling [16], confirms that a substan-tial part of the collective motion has indeed developed prior to hadronization. This picture is also corroborated by a more recent STAR analysis of the centrality dependence of hyperon yields carried out within the framework of a thermal model [17]. The observed scaling behavior of strange baryons is con-sistent with a scenario of hadron formation from constituent quark degrees of freedom through quark recombination pro-vided that the coalescence took place over a volume that is much larger than the one created in any elementary collisions. These observations fit nicely into ideal hydrodynamic evo-lution starting from the system of de-confined QCD matter. However, they are also consistent with a more realistic hybrid macroscopic/microscopic transport approach [20] which takes into account the strength of dissipative effects prevalent in the latter hadronic phase of the reaction. The hybrid model calcu-lations indicate that at the top RHIC energy the hadronic phase of the heavy-ion reactions is of significant duration (at least 10 fm/c), making hadronic freeze-out a continuous process, strongly depending on hadron flavor and momenta. In partic-ular, heavy hadrons, which are quite sensitive to radial flow effects, obtain the additional collective push created by res-onant (quasi)elastic interactions during that fairly long-lived hadronic rescattering stage [21].
differ-ent particle species [19], the answer is affirmative. The fem-toscopy of non-identical particles was already used to show that the average emission points of pions, kaons and protons produced in heavy-ion collisions at SPS and RHIC are not the same [3, 7, 10, 22, 23]. In a hydrodynamically inspired blast-wave approach [18], the mass ordering of average space-time emission points of different particle species naturally appears due to the transverse expansion of the source. This effect in-creases with the mass difference of the measured particle pair. Hence, studying correlations in theπ−Ξsystem where the mass difference is very large should provide rather sensitive test of the emission asymmetries introduced by the transverse expansion of the bulk matter.
Moreover, in addition to the Coulomb interaction studied in theπ−K system, the small relative momentum π±−Ξ∓
correlations may provide a clear signal of the strong interac-tion, revealing itself via theΞ∗(1530)resonance. Expressing
particle momentum in the pair rest frame,k∗=pπ=−pΞvia pair invariant massMπΞandmπandmΞ
k∗=[M 2
πΞ−(mπ−mΞ)2]1/2[M2πΞ−(mπ+mΞ)2]1/2
2MπΞ (1)
One expects theΞ∗(1530) peak to show up in the correla-tion funccorrela-tionC(k∗) at k∗≈ 150 MeV/c. Due to its rather long lifetime,τΞ∗(1530)=22f m/c, the resonance could also be
rather sensitive to theπ−Ξinteraction during the long-lived hadronic phase. This should be investigated by bothπ−Ξ
femtoscopy as well as via direct measurements ofΞ∗(1530)
spectra. While the first signal of theΞ∗resonance in heavy ion collision was seen in femtoscopy analysis just two years ago [24], the first preliminary STAR measurements concerning the
Ξ∗spectra and their yields were presented only recently at the
Quark Matter conference in Shanghai this year [25].
A. Data selection
Though in previous analyses [5, 11, 12, 24] the π−Ξ
correlations were studied for two different system d+Au and Au+Au and also at two different energies, in this contribution I will concentrate on Au+Au data at(sNN)= 200 GeV from RHIC Run IV only. The data were divided into several cen-trality classes. During the run, the central trigger was used to enhance the fraction of the 10% most central events. Track-level cuts based ondE/dxparticle identification in the STAR Time Projection Chamber were used. Pion sample momenta pt were limited to [0.125, 1.] GeV/c. After thedE/dxcuts, the upperpT-limit was 0.8 GeV/c and 0.6 GeV/c aty=0.and
y=0.8, respectively. ChargedΞs were reconstructed topo-logically in thept range [0.7, 3.] GeV/c. To increase the total number of analyzedπ−Ξpairs in this analysis we have used a wider rapidity cut than in the previous STAR femtoscopy analyses [26]. The cut|y|<0.8 instead of|y|<0.5 was em-ployed for both particle species. Total number of extractedΞ
used in this analysis are given in Table I.
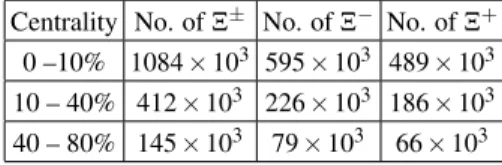
TABLE I:200 GeV Au+Au, Run IV data set Centrality No. ofΞ± No. ofΞ− No. ofΞ+
0 –10% 1084×103 595×103 489×103 10 – 40% 412×103 226×103 186×103 40 – 80% 145×103 79×103 66×103
B. Data analysis and corrections
The event–mixing technique was used to obtain the uncor-related two-particle distribution in the pair rest frame. To re-move spurious correlations of non-femtoscopic origin, the un-correlated pairs were constructed from events with sufficient proximity in primary vertex position along the beam direc-tion, multiplicity and event plane orientation variables. Pair cuts were used to remove effects of track splitting and merg-ing. The resulting raw correlation function was then corrected for the purity of both particle species. The correction was per-formed individually for each bin ink∗= (k∗,cosθ,ϕ)of the 3-dimensional (3D) correlation function as described bellow.
C. Pair purity analysis
The pair purity, defined as a fraction of primaryπ−Ξpairs, was calculated as a product of the particle purities of both par-ticle species. TheΞpurity was obtained from reconstructedΞ
invariant mass plots as a function of transverse momentum. Pion purity was estimated using the parameter√λof the stan-dard parametrization of the identicalπ−π correlation func-tion. The identical pion measurements were performed with the same pion cuts as those used in theπ−Ξanalysis. Since the value of theλparameter is influenced by decays of long-lived resonances as well as by the non-Gaussian shape of the correlation function, the pion purity correction can be a sig-nificant source of systematic error.
In order to make contact with the previous STAR identical pion analyses [26] in Fig. 1, we present thekT–dependence of parametersλ, Rout, Rside andRlong entering the standard out-side-long decomposition of the 3D correlation function C(q) =1+λ·exp(−q2outRout2 −q2sideR2side−q2longR2long). Here, kT= (|p1T|+|p1T|)/2 is the average transverse momentum of two pions. On the same figure the ratioRout/Rsideis aso plot-ted. We conclude that the improved cuts used in the present analysis do not change the values of extracted parameters, but due to the increased acceptance in rapidity and transverse mo-menta of the pions, our analysis covers also region of lower kT.
(GeV/c)
T
k
0.2 0.3 0.4 0.5 0.6
λ
0.2 0.3 0.4 0.5
λ
Year4 preliminary
0-10%
10-40%
40-80%
STAR PRC71 0-5% 5-10% 10-20% 20-30% 30-50% 50-80%
(GeV/c)
T
k
0.2 0.3 0.4 0.5 0.6
(fm)
out
R
4 6 8
Out
(GeV/c)
T
k
0.2 0.3 0.4 0.5 0.6
(fm)
side
R
4 6 8
Side
(GeV/c)
T
k
0.2 0.3 0.4 0.5 0.6
(fm)
long
R
4 6 8
Long
(GeV/c)
T
k
0.2 0.3 0.4 0.5 0.6
side
/R
out
R
0.8 0.9 1 1.1 1.2 1.3
FIG. 1: (Color online) The comparison between parameters of 3D Gaussian fits to the correlation functions of identical charged pions produced in Au+Au collisions at 200 GeV. Previous [26] (open stars) and this analysis (full triangles). Error bars contain only statistical uncertainties.
mained unchanged.
D. Results in 1D source size information
Theπ−Ξcorrelation functionsC(k∗)were analyzed in the pair rest frame (k∗=pπ=−pΞ). The results for unlike sign pairs are presented in Fig. 2.
k*[GeV/c]
0 0.1 0.2
C(k*
)
1 1.2 1.4
STAR preliminary
200GeV AuAu
Ξ π
unlike-sign
Centrality
0-10% 10-40% 40-80%
FIG. 2: (Color online) The centrality dependence of the correlation function of the combined sample of unlike-signπ±Ξ∓pairs .
For all centralities, the low k∗ region is dominated by the Coulomb interaction. The strong interaction manifests
it-self in a peak aroundk∗≈150 MeV/c corresponding to the
Ξ∗(1530). The peak’s centrality dependence clearly shows high sensitivity to the source size. Contrary to the Coulomb region, the correlation function in the resonance region does not suffer from the low statistics and can thus in principle be used to extract sizes of the sources more effectively than in the former case.
E. Results in 3D asymmetry measurement
The information about the shift in average emission points betweenπandΞcan be extracted from the angular part of the 3D correlation functionC(k∗)≡C(k∗,cosθ,ϕ).
0 0
A
1 1.2 1.4 1.6
AuAu 0-10% AuAu 10-40% AuAu 40-80%
"size"
0 0
A
200GeV AuAu
-Ξ
+
π
+
+Ξ
-
π
k*[GeV/c]
0 0.1 0.2
1 1
A
-0.05 0 0.05
"shift"
1 1
A STAR preliminary
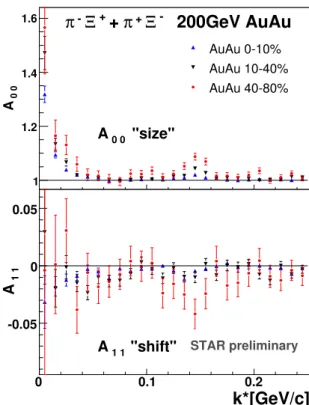
FIG. 3: (Color online)A00(k∗)andA11(k∗)coefficients of spherical decomposition for the combined sample of unlike-signπ±Ξ∓pairs from three different centrality bins.
The function is binned ink∗,cosθ,ϕwith∆cosθ=Ncos2θ and ∆ϕ=N2πϕ as the bin sizes in cosθandφ, respectively. After its
decomposition into spherical harmonics [27],
Alm(k∗) =∆cos√θ∆ϕ 4π
all bins
∑
i
Ylm(θi,ϕi)C(k∗,cosθi,ϕi) (2)
do not vanish. On the other hand, for non–identical particle correlations the coefficients with odd values ofl andm are allowed.
For both cases, the most important coefficient is A00(k∗)
representing the angle-averaged correlation functionC(k∗). The latter is sensitive to the source size only, whereas in the non–identical particle caseA11(k∗)measures a shift of the
av-erage emission point in theRoutdirection.
The decomposition of the correlation function into spheri-cal harmonics was used to study the centrality dependence of asymmetry in emission between pions andΞs. The results are presented in Fig. 3. The coefficientA11 which is non-zero in
all centrality bins clearly confirms that the average space-time emission points of pions andΞare not the same.
0 0
A
0.9 1 1.1
unlike-sign like-sign
HBT
π
-π
BW 0-10% from HBT
π
-π
BW 0-10% from
"size"
0 0
A
200GeV AuAu 0-10% central Ξ
- π
k*[GeV/c]
0 0.1 0.2
1 1
A
-0.05 0 0.05
"shift"
1 1
A
STAR preliminary
FIG. 4: (Color online) Comparison ofA00(k∗)andA11(k∗) coef-ficients of spherical decomposition for combined sample of unlike-signπ±Ξ∓pairs from 10% most central Au+Au collisions with the FSI model predictions.
In Fig. 4 the experimental results for the 10% most central, the highest statistics bin, are compared to a model calculation exploiting strong and Coulomb final state interaction [28].The theoretical correlation function was constructed from the par-ticle emission separation distribution. For this purpose, the momenta of real particles were used. The emission coordi-nates of bothπ and Ξwere generated using the blast wave model [18]. This model, encompassing correlation between particle momenta and their space-time coordinates, was used with a single set of parameters for generating emission co-ordinates of bothπandΞ. These parameters were obtained from experimentally measured pion spectra andπ−π emis-sion radii. Let us note that using the same set of parameters
for theΞsource as for the pions implicitly assumes significant transverse flow ofΞ. In the Coulomb region, the theoretical correlation function is in qualitative agreement with the data. Moreover, the orientation of the shift and its magnitude agrees with the scenario in which theΞparticipates in the transverse expansion. However, in the region dominated by the strong fi-nal state interaction the calculations over predict both the size and the shift coefficients.
F. Extracting the source parameters
For further analysis we have used only the low k∗ region dominated by the Coulomb interaction, excluding thus the re-gion around theΞ∗(1530)peak (see Fig. 5).
0 0
A
0.8 1 1.2 1.4
data unlike-sign data like-sign fit unlike-sign fit like-sign
"size"
0 0
A
Coulomb Fit to 0-10% central AuAu
k*[GeV/c]
0 0.05 0.1
1 1
A
-0.05 0 0.05
"shift"
1 1
A
STAR preliminary
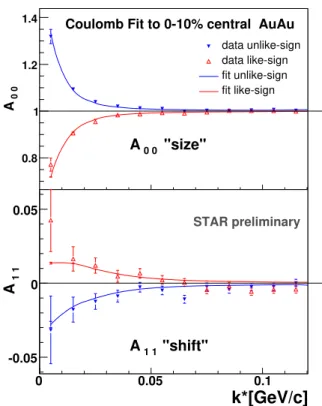
FIG. 5: (Color online) Comparison ofA00(k∗)andA11(k∗) coef-ficients from the spherical decomposition of the combined sample of like-signπ±Ξ±and unlike-signπ±Ξ∓pairs from the 10% most
central Au+Au collisions, along with the FSI model predictions. The theoretical correlation function was calculated using the momentum distribution of pairs extracted from real data. The emission coordinates were randomly generated from the two-parameter source distribution constructed in the follow-ing way. For both particle species, the Gaussian shape of their source was assumed with the sources shifted in theRout
direc-tion relative to each other. In the pair rest frame this can be ex-pressed via two parametersRand∆outcharacterizing the pair
separation distribution in∆r∗. Here, Rrepresents the width of the Gaussian and∆outrepresents the shift in theRout
correlation function. Fitting was done simultaneously for like and unlike–sign correlation functions.
For the most central Au+Au collisions this method yields the first preliminary values ofR= (6.7±1.0)fm and∆out= (−5.6±1.0)fm. The errors are purely statistical. System-atic error studies are under way and their values are expected to be of the order of the statistical ones. In our case a neg-ative value of the shift means that average emission point of
Ξis positioned more to the outside of the whole fire-ball than the average emission point of pion as expected in theΞflow scenario.
III. IDENTICAL PION CORRELATIONS
A. Motivation
In ultra–relativistic heavy–ion collisions femtoscopy can also be employed to extract information related to the strong interaction among the particles [3, 10]. In recent STAR analy-ses the strong FSI was studied via two–Ks0interferometry [29] and in proton-lambda correlations [30]. A model that takes the effect of the strong interaction into account has been used to fit the measured correlation functions. In thep−Λandp−Λ
correlations, which were actually measured for the first time, annihilation channels and/or a negative real part of the spin-averaged scattering length was needed in the FSI calculation to reproduce the measured correlation function.
At the previous WPCF meeting an ambitious proposal to exploit the correlations among identical charged pions to ex-tract pion-pion scattering lengths was made [8]. The potential for such measurements at RHIC, and also later at the LHC stems from the fact that, compared to a dedicated particle physics experiments measuring scattering lengths parameters a00anda20like BNL-E865 [31] or Dirac [32], heavy ion exper-iments provide a much larger number of pion pairs at small relative momenta in a single event plus very large data sam-ples ( 107−109events). The real challenge when studying the strong interaction among identical charged pions then is to beat down all systematical errors pertinent to the ultra– relativistic heavy ion collisions environment. Coulomb inter-action, pion purity and geometry of the pion source need to be kept under control. Varying the source size (kT or centrality) may provide a good handle on this.
In particular, the bias arising from the frequently used Gaussian assumption of the source shape needs to be ad-dressed. Using the high statistics sample of Au+Au events from the STAR experiment at RHIC’s highest energy accumu-lated during the run IV, it was found that for allkT and cen-trality bins the L´evy stable source parametrization does not bring an advantage in describing the detailed shape of mea-sured three-dimensional correlation function [6].
The next step in this direction is to exploit the model-independent imaging technique of Brown and Danielewicz [33, 34] and reconstruct the source itself. This is done via inverting Koonin-Pratt equation (see e.g. [1]):
C(q)−1=4π
K0(q,r)S(r)r2dr
K0(q,r)≡
1 2
(|Φ(q,r)|2−1)d(cosθq,r)
q=1
2
−(p1−p2)2, (3)
which expresses the 1D correlation functionC(q)in terms of the probabilityS(r)to emit a pair of particles at a separation rin the c.m. frame.S(r)is usually called the source function. All FSI is encoded in the (angle averaged) final state wave functionΦ(q,r)describing the propagation of the pair from a relative separation ofrin the pair c.m. to the detector with relative momentumq. The angle between vectorsqandris denoted byθq,r. The procedure to extractS(r)via inversion
of Eq. 3 is given in [34].
B. Testing the inversion procedure
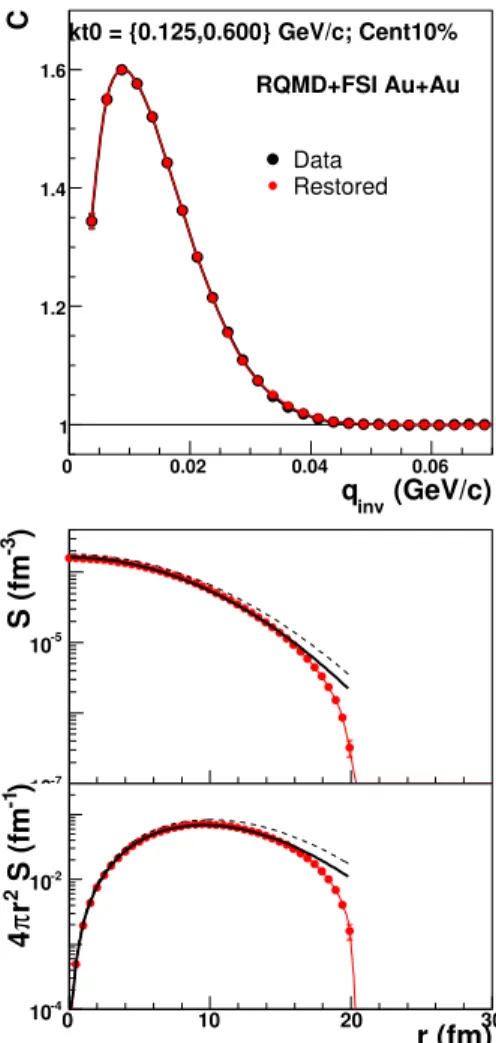
To test reproducibility of he original source function by the imaging procedure we have generated Bose-Einstein (B-E) correlated and Coulomb interacting pion pairs. The mo-mentum spectra of the pions were obtained from the 10% most central Au+Au RQMD generated events at√sNN=200 GeV. The pions coordinates were randomly sampled from an isotropic 3D Gaussian distribution with the radius R=5 fm. The instantaneous emissionδτ=0 of particles was assumed. Using pion momenta and their coordinates the B-E correla-tions and Coulomb FSI were introduced using the procedure described in [36]. Results for correlations and source func-tions are displayed on Fig. 6. In order to compare with the input Gaussian source the extracted source function was fitted with the Gaussian distribution again:
g(r,R) = λ (2√πR)3e
−r2
4R2 (4)
Let us note that ther2-weighting ofS(r)appearing in the
normalization condition of the source function: 4π
∞
0
S(r)r2dr=λ (5) makes the normalization constantλmore sensitive to the be-havior ofS(r)atr≫Rthan one would naively expect. Since the latter is determined by the imaging from values of the cor-relation functionC(q)at very smallq, fulfilment of the above normalization condition using data with limited statistics in the lowqbins may be hard to achieve. This may explain why values of the extracted parametersRandλ from the single-Gaussian fit were found to be smaller than the input ones. While forR the discrepancy is about 4% forλ it is almost 25%.
C. 1D imaging analysis of the pion source from Au+Au and Cu+Cu collisions
(GeV/c)
inv
q
0 0.02 0.04 0.06
C
1 1.2 1.4 1.6
GeV/c; Cent10% kt0 = {0.125,0.600}
RQMD+FSI Au+Au
Data Restored
0 10 20 30
)
-3
S (fm
-7
10
-5
10
r (fm)
0 10 20 30
)
-1
S (fm
2r
π
4
-4
10
-2
10
FIG. 6: (Color online) The 1D imaging analysis of an isotropic Gaussian source using pion momentum spectra from RQMD sim-ulating the 10% most central Au+Au collisions at√sNN=200 GeV.
Top: original (black filled circles) and restored by imaging technique (red filled circles) correlation functionC(q). To guide the eye the data points are connected by a smooth line of the same color. Mid-dle: 1D source functionS(r)(red filled circles). The full black line represents the result of a single-Gaussian fit toS(r), dashed line -input Gaussian distribution. Bottom: 4πr2S(r).
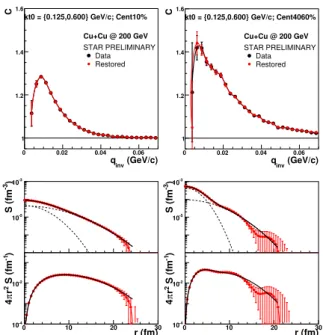
used for the reconstruction of the pion source. The second data set employed in the imaging analysis consists of about 8 million Cu+Cu minimum bias events at√sNN=200 GeV accu-mulated during the Run V. Selected results from 1D imaging analysis of the pion source using centrality selected Au+Au and Cu+Cu events are displayed on Fig. 7 and 8, respectively. Compared to the model example discussed in the previous paragraph the extracted source functions now develop long tails [35] and cannot thus be described by a single Gaussian distribution. The only exception are the data from the 10% most central Au+Au collisions (Fig. 7.) To account for the observed behavior we use the simplest extension of Eq. 4 and assume that the source function contains contributions from two Gaussians. While the first Gaussian g(r,R1)
contribut-ing with fraction(1−α)is responsible for the long tails the second oneg(r,R2)contributing with weight αof width the
(GeV/c) inv q 0 0.02 0.04 0.06
C
1 1.1 1.2 1.3 1.4
GeV/c; Cent10% kt0 = {0.125,0.600}
Au+Au @ 200 GeV STAR PRELIMINARY
Data Restored
)
-3
S (fm -5
10
r (fm)
0 10 20 30 40
)
-1
S (fm
2r
π
4
-4
10
-2
10
(GeV/c) inv q 0 0.02 0.04 0.06
C
1 1.1 1.2 1.3 1.4
GeV/c; Cent4080% kt0 = {0.125,0.600}
Au+Au @ 200 GeV STAR PRELIMINARY
Data Restored
)
-3
S (fm -5
10
r (fm)
0 10 20 30 40
)
-1
S (fm
2r
π
4
-4
10
-2
10
FIG. 7: (Color online) 1D imaging analysis of identical charged pi-ons from Au+Au collisipi-ons at√sNN =200 GeV. Results are shown
for the 10% most central (the left panel) and for peripheral(centrality 40-80%) collisions (the right panel). Top: the measured correla-tion funccorrela-tion C(q) (black filled circles), restored correlacorrela-tion funccorrela-tion from imaging technique (red filled circles). To guide the eye the data points are connected by a smooth line of the same color. Middle: 1D source functionS(r)(red filled circles). The full black line rep-resents the result of a double-Gaussian fit toS(r). Two dashed lines show contribution of each of two Gaussians. Bottom: 4πr2S(r): (red filled circles). Full black line represents result of a double-Gaussian fit.
R2<R1 describes the source function at smallr. The double Gaussian distribution:
G(r,R1,R2) = (1−α)g(r,R1) +αg(r,R2),R1>R2 (6) now seems to describe data quite well. Comparing Au+Au to Cu+Cu collisions of the same centrality we conclude that the long tails are more pronounced for the smaller system.
All source functions presented so far were obtained from data integrated over the whole range of average pair trans-verse momentakT= [0.125, 0.600] GeV/c). In the following I
will present results showing how much the observed departure from a single Gaussian shape depends on particle transverse momenta.
Such an analysis was performed and is displayed in Figs. 9-11. While for Au+Au collisions the statistics allowed us to use 9 bins inkTfor Cu+Cu we have used only 4 bins. In Fig. 9 the
lowestkT= [0.125, 0.250] GeV/c and the highestkT= [0.450,
0.600] GeV/c bins from Cu+Cu 10% most central collisions are compared. We see that the long tail present in the lowest kT bin, which is characterized by the Gaussion with the width
R≈7 fm, completely disappears from the highestkT bin.
Figures 10 and 11 show thekT-dependence of the double
(GeV/c) inv q 0 0.02 0.04 0.06
C 1 1.2 1.4 1.6 GeV/c; Cent10% kt0 = {0.125,0.600}
Cu+Cu @ 200 GeV STAR PRELIMINARY Data Restored ) -3 S (fm -5 10 -3 10 r (fm)
0 10 20 30
) -1 S (fm 2r π 4 -4 10 -2 10 (GeV/c) inv q 0 0.02 0.04 0.06
C 1 1.2 1.4 1.6 GeV/c; Cent4060% kt0 = {0.125,0.600}
Cu+Cu @ 200 GeV STAR PRELIMINARY Data Restored ) -3 S (fm -5 10 -3 10 r (fm)
0 10 20 30
) -1 S (fm 2r π 4 -4 10 -2 10
FIG. 8: (Color online) 1D imaging analysis of identical charged pi-ons from Cu+Cu collisipi-ons at√sNN=200 GeV. Results are shown
for the 10% most central (the left panel) and for peripheral (centrality 40-60%) collisions (the right panel). Top: C(q). Middle: 1D source functionS(r). Bottom: 4πr2S(r). Labels are same as on Fig. 7.
(GeV/c) inv q 0 0.02 0.04 0.06
C 1 1.2 1.4 1.6 GeV/c; Cent10% kt1 = {0.125,0.250}
Cu+Cu @ 200 GeV STAR PRELIMINARY
Data Restored
r (fm)
0 10 20 30
) -3 S (fm -7 10 -6 10 -5 10 -4 10 -3 10 0.007 ± = 0.370 λ 0.31 fm ± = 7.14 G1 R 0.07 fm ± = 3.87 G2 R 0.03 ± = 0.45 G2 α (GeV/c) inv q 0 0.02 0.04 0.06
C 1 1.2 1.4 1.6 GeV/c; Cent10% kt4 = {0.450,0.600}
Cu+Cu @ 200 GeV STAR PRELIMINARY
Data Restored
r (fm)
0 10 20 30
) -3 S (fm -7 10 -6 10 -5 10 -4 10 -3 10 0.005 ± = 0.231 λ 0.07 fm ± = 3.88 G1 R 0.15 fm ± = 1.79 G2 R 0.01 ± = 0.04 G2 α
FIG. 9: (Color online) The 1D imaging analysis of identical charged pions from the 10% most central Cu+Cu collisions at√sNN=200
GeV. Results are shown for the lowest (the left panel) and for the highest (the right panel)kT-bin. Top: correlation function C(q).
Mid-dle: 1D source functionS(r)Bottom: 4πr2S(r). Labels are same as on Fig. 7.
prominent. This behavior is more pronounced in Cu+Cu col-lisions. Let us note that the long tails observed in the low-kT bins may then indicate an important role played by the pions from long-lived resonance decays. An interesting observation
(GeV/c)
T
k 0.2 0.3 0.4 0.5 0.6
λ 0.2 0.3 0.4 0.5 0.6 λ
Cu+Cu, 200 GeV STAR PRELIMINARY 0-10% 10-40% 40-60% (GeV/c) T k 0.2 0.3 0.4 0.5 0.6
α 0 0.2 0.4 0.6 α (GeV/c) T k 0.2 0.3 0.4 0.5 0.6
(fm)1 R 3 4 5 6 7 8 1 R (GeV/c) T k 0.2 0.3 0.4 0.5 0.6
(fm)2 R 1 2 3 4 5 2 R
FIG. 10: (Color online) ThekT-dependence of source parameters of
identical charged pions from Cu+Cu collisions at√sNN=200 GeV
taken at three different centralities: 0-10% - full red circles, 10-40% - full blue squares, 40-60% - full black triangles.
(GeV/c) T k
0.2 0.3 0.4 0.5 0.6
λ
0.2 0.4 0.6 λ
Au+Au, 200 GeV STAR PRELIMINARY 0-10% 10-40% 40-80% (GeV/c) T k
0.2 0.3 0.4 0.5 0.6
α 0 0.2 0.4 0.6 α (GeV/c) T k
0.2 0.3 0.4 0.5 0.6
(fm)1 R 4 5 6 7 8 9 1 R (GeV/c) T k
0.2 0.3 0.4 0.5 0.6
(fm)2
R
2 4
6 R2
FIG. 11: (Color online) ThekT-dependence of source parameters of
identical charged pions from Au+Au collisions at√sNN=200 GeV
taken at three different centralities: 0-10% - full red circles, 10-40% - full blue squares, 40-80% - full black triangles.
IV. SUMMARY
High-statistics STAR data from Au+Au and Cu+Cu colli-sions taken at full RHIC energy and three different centralities were used to discuss recent progress in identical (π−π) and non-identical (π−Ξ) particle femtoscopy. In theπ−Ξsystem the strong and Coulomb-induced FSI effects were observed, making it possible for the first time to estimate the average shift and width betweenπandΞsource. The 1D imaging of the identical pion source reveals a significant departure from a single Gaussian shape. The observed long tails, which could be fairly well described by allowing for the second Gaussian, are more pronounced for the sources produced at large impact parameters. The effect is stronger for Cu+Cu than for Au+Au collisions. For all centralities and both colliding systems the
highest departure from a single Gaussian shape is observed for sources emitting particle with a small average pair transverse momentakT. For the highest analyzedkT the source is to a good approximation a single Gaussian.
Acknowledgements
This work was supported in part by the IRP AV0Z10480505 and by GACR grants 202/04/0793 and 202/07/0079. The data analysis was performed by Michal Bystersk´y and Petr Chaloupka as a part of their Ph.D. thesis work. I would like to thank to both of them for important input to my talk. My gratitude goes also to the organizers of this excellent meeting, in particular to Sandra Padula.
[1] M. A. Lisa, S. Pratt, R. Soltz, and U. Wiedemann, Ann. Rev. Nucl. Part. Sci.55, 357 (2005) [arXiv:nucl-ex/0505014]. [2] Proc. XXXV Int. Symp. on Multiparticle Dynamics (ISMD
2005), Kromˇeˇr´ıˇz, Czech Republic, August 9-15, 2005 and of the Workshop on Particle Correlations and Femtoscopy (WPCF 2005), Kromˇeˇr´ıˇz, Czech Republic, August 15-17, 2005. Edited by V. ˇSim´ak, M. ˇSumbera, ˇS. Todorova, B. Tom´aˇsik, AIP Con-ference Proceedings 828 (2006), ISBN 0-7354-0320-1. [3] R. Lednick´y, ibid, p. 423 (2006).
[4] M. Lisa, ibid, p. 226 (2006). [5] P. Chaloupka, ibid, p. 610 (2006).
[6] M. Bystersk´y, ibid, p. 205 (2006) [arXiv:nucl-ex/0511053]. [7] R. Lednick´y, Proc. CIPPQG’01, Palaiseau, France,
arXiv:nucl-th/0112011; Phys. Atom. Nucl.67, 72 (2004).
[8] M. Bystersk´y and F. Retiere: “Measuring scattering length at STAR,” unpublished talk at WPCF 2005. Available at http://www.particle.cz/conferences/wpcf2005/talks/retiere.ppt. [9] Proc. 18th Int. Conf. on Ultra-Relativistic Nucleus-Nucleus
Collisions, Budapest, Hungary, 4-9 August, 2005, edited by T. Cs¨org˝o, G. D´avid, and P. L´evai, Nucl. Phys. A774(2006). [10] R. Lednick´y, ibid, p. 189 (2006).
[11] P. Chaloupka, ibid, p. 603 (2006).
[12] P. Chaloupka, Proc. SQM 2006 Int. Conf on Strangeness in Quark Matter, University of California Los Angeles, March 26-31, 2006, edited by K. Barish, H. Z. Huang, J. Kapusta, G. Odyniec, J. Rafelski, and C. A. Whitten Jr., J. Phys. G32, S537 (2006).
[13] J. Adamset al.[STAR Collaboration], Nucl. Phys. A 757, 102 (2005).
[14] B. I. Abelev et al. [STAR Collaboration], arXiv:nucl-ex/0607012.
[15] J. Adamset al. [STAR Collaboration], Phys. Rev. Lett. 95, 122301 (2005).
[16] D. Molnar and S. A. Voloshin, Phys. Rev. Lett. 91, 092301 (2003), R. J. Fries, B. Muller, C. Nonaka, and S. A. Bass, Phys. Rev. Lett.90, 202303 (2003).
[17] J. Adamset al.[STAR Collaboration], arXiv:nucl-ex/0606014.
[18] F. Retiere and M. A. Lisa, Phys. Rev. C70, 044907 (2004). [19] R. Lednicky, V. L. Lyuboshits, B. Erazmus, and D. Nouais,
Phys. Lett. B373, 3034 (1996).
[20] C. Nonaka and S. A. Bass, Phys. Rev. C75, 014902 (2007). [21] U. W. Heinz, J. Phys. G31, S717 (2005).
[22] C. Blumeet al.[NA49 Collaboration], Nucl. Phys. A715, 55 (2003).
[23] J. Adams et al. [STAR Collaboration], Phys. Rev. Lett. 91, 262302 (2003).
[24] P. Chaloupka [STAR Collaboration], Nucl. Phys. A749, 283 (2005).
[25] R. Witt, talk at 19th Int. Conf. on Ultra–Relativistic Nucleus– Nucleus Collisions, Shanghai, China, November 14-20, 2006, arXiv:nucl-ex/0701063.
[26] J. Adamset al.[STAR Collaboration], Phys. Rev. C71, 044906 (2005).
[27] Z. Chajecki, T. D. Gutierrez, M. A. Lisa, and M. Lopez-Noriega [the STAR Collaboration], arXiv:nucl-ex/0505009.
[28] S. Pratt and S. Petriconi, Phys. Rev. C68, 054901 (2003). [29] B. I. Abelev [STAR Collaboration], Phys. Rev. C74, 054902
(2006); S. Bekele and R. Lednicky, “Neutral Kaon Correlations in√sNN=200 GeV Au+Au collisions at RHIC”, Proc. WPCF 2006.
[30] J. Adamset al.[STAR Collaboration], arXiv:nucl-ex/0511003. [31] S. Pislaket al.[BNL-E865 Collaboration], Phys. Rev. Lett.87,
221801 (2001).
[32] B. Adevaet al.[DIRAC Collaboration], Phys. Lett. B619, 50 (2005).
[33] D. A. Brown and P. Danielewicz, Phys. Lett. B398, 252 (1997). [34] D. A. Brown and P. Danielewicz, Phys. Rev. C57, 2474 (1998). [35] S. S. Adler et al. [PHENIX Collaboration],
arXiv:nucl-ex/0605032.
[36] R. Lednick´y and V.L. Lyuboshitz, Yad. Fiz.35, 1316 (1982) [Sov. J. Nucl. Phys.35, 770 (1982)]. Fortran program provided by R. Lednick´y.