Space-Time Characterization and Collective Motion at Intermediate Energies
Giuseppe Verde
GANIL, CEA and IN2P3-CNRS, Caen Cedex, F-14076, France and INFN, Sezione di Catania, I-95123, Italy
Received on 10 December, 2006
Shape analyses of two-particle correlation functions are discussed. Two-proton imaging provides information about the volume, the relative contributions between fast and slow emitting sources and the profile of the two-particle source that can be directly compared to microscopic model simulations. In the case of correlations between complex particles, the role played by collective motion and space-momentum correlations needs special considerations. By means of a semi-quantitative Monte Carlo approach, deuteron-alpha correlation functions measured in Xe+Au collisions at E/A=50 MeV are investigated. The comparison reveals the existence of a position-relative momentum correlation that reduces the apparent source size and distorts the line-shape of the correlation function. The developed ideas show how intensity interferometry with complex particles is sensitive not only to the geometry of the system but also to the interplay between collective and thermal motion.
Keywords: Two-particle correlation functions; Imaging; Collective motion; Nuclear densities
I. INTRODUCTION
Two-particle correlation functions have been extensively used to study the space-time properties of nuclear reactions [1–6]. During an energetic collision between two heavy ions, nuclear matter under extreme conditions of temperature and density is produced. Measuring the properties of the pro-duced nuclear systems represents the only terrestrial means to access the equation of state of nuclear matter. However, heavy-ion collisions are rather complex systems. Particles are emitted by several different sources and a clear understanding of their properties has not yet been achieved. The observed single particle spectra contain contributions from the fast pre-equilibrium emission, dominating the early stages of the reac-tion, and the slowly evolving evaporative and secondary decay sources as well. In this context, intensity interferometry tech-niques have provided powerful tools to disentangle the contri-butions from different emitting sources and extract informa-tion about their properties such as size and lifetimes.
It should be pointed out that the coexistence of very differ-ent emission time scales, ranging from pre-equilibrium (τ≈
10-50 fm/c) and secondary decays (τ≈103−105) makes the study of such space-time probes of the reaction quite compli-cated. Two-proton correlation functions have been success-fully used to determine the size and the lifetime of particle emission sources [4, 6]. However, it is expected that differ-ent particles are emitted at differdiffer-ent times. Thus, extending HBT techniques to particles heavier than protons would rep-resent an important step forward towards fully understanding particle and fragment emission mechanisms and, eventually, their inner link to liquid-gas phase transitions in nuclear mat-ter [7]. On the other hand, one has to keep in mind that the larger mass of complex particles makes them more sensitive to the presence of collective motion, as compared to the case of protons. Indeed, while thermal velocities decrease with mass (vth∝m−1/2), collective velocities do not depend on mass.
In this article, we will present some studies that have been recently performed in the context of heavy-ion collisions at intermediate energies. We will focus on the importance of
characterizing the space-time extent of the emitting sources by means of detailed analyses of the shape of two-particle correlation functions. The first part of the article is devoted to presenting the advances in the field ofimaging techniques ap-plied to angle-averaged two-proton correlation functions. In the second part of the article, attempts to extend shape analy-ses to correlation functions between complex particles will be discussed. In this context, the role played by collective motion on deuteron-alpha correlation functions measured in Xe+Au collisions at E/A=50 MeV will be discussed. This specific case of correlation functions between complex particles can be considered as a guideline to understand how the effects of collective flow in nuclear reactions can strongly affect shape analyses and must be properly taken into account in order to extract reliable space-time source extents.
II. TWO-PROTON CORRELATION FUNCTIONS AND SOURCE FUNCTIONS
Given two protons with individual momentap1andp2, rel-ative momentumq, and relative space-time separation,r, the angle-averaged correlation function, 1+R(q), can be defined as:
1+R(q) =4π
directional analyses are successful when the emission time scales and not too long. In a nuclear reaction between heavy ions, protons are expected to be produced by different mecha-nisms and the p-p correlation function will reflect the proper-ties of different emitting sources.
FIG. 1: Left panel: The thick line indicates a typical two-proton source function for intermediate energy collisions. The dashed line represents the short range contribution from short lifetime pre-equilibrium emission. Right panel: corresponding correlation func-tions calculated with Eq. (1).
The thick solid line on the left panel of Fig. 1 shows a typical profile for a two-proton emitting source [10]. A short range contribution, at smallr-values, peaks atr=0 and local-izes within a small range inr-space. This portion is dom-inated by pairs generated by fast pre-equilibrium emissions in the earlier stages of the reaction. A significant number of protons are known to be produced also by long lifetime evap-orative emissions and from secondary decays of the heavier fragments. These protons are expected to contribute mainly in the long tail of the source function at large relative spa-tial distances. The corresponding proton-proton correlation function from this two-component source is represented on the right panel of Fig. 1 by the thick solid line. The prominent peak at 20 MeV/c is due to the attractive nature of the short range nuclear interaction between the protons. This type of in-teraction dominates proton pairs at small relative distances in the source function. However, at larger-values, the Coulomb force and the Pauli exclusion principle are the dominant fac-tors. Thus, the portion ofS(r)contained in its tail is expected to contribute mainly at the low relative momentum region of 1+R(q)(shaded regions in Fig. 1). In order to show this, we represent the short range part ofS(r)with a more local-ized source (dashed line on the left panel of Fig. 1). Its in-tegral over all space,λ, is less than unity, due to the suppres-sion in the tail. As expected, the correspondent correlation function (dashed line in the right panel) is strongly affected in the regionq=0-10 MeV/c. Unfortunately, this region at low relative momenta (shaded area) is normally not accessi-ble. In particular, the presence of experimental threshold in the data,qc, (commonly ranging between 5 and 15 MeV/c),
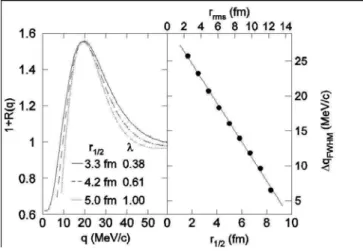
suggests that the correlation function probes only a portion of the sourceS(r), inside a certain cutoff relative distance, i.e. r<rc. In such a scenario, the commonly adopted picture of using the height of the peak at 20 MeV/c to extract the size of the emitting source has to be abandoned. This is shown on left panel of Fig. 2 where three correlation functions corre-sponding to sources with different sizes display the same val-ues at q=20 MeV/c. Ther1/2values of the source profiles are used as a measure of their space-time extent. Their integrals,
λ=0.38, 0.61 and 1.0, reflect different long range tail suppres-sions from the original sources. It is evident that the shape, not the height, of the peak at 20 MeV/c reflects the size of the fast pre-equilibrium proton source. This is best shown on the right panel of Fig. 2 that represents the correlation between the size (r1/2-value on the lower scale and rms-radius on the upper scale) of the fast portion of the emitting source and the FWHM width,∆qFW HM, of the peak in the correlation func-tion.∆qFW HMis linearly correlated to the size of the emitting source: more extended sources produce a more narrow peak at 20 MeV/c. Furthermore, the correlation between width of the peak and size of the source is completely independent of theλ-values, i.e. the relative contributions between fast and slow proton emissions [10].
FIG. 2: Left panel: correlation functions for Gaussian sources with differentλ-values and radii. Right panel: the relation between the width of the resonance peak at 20 MeV/c and therms-radii (upper scale), and half radii (lower scale).
III. IMAGING TWO-PROTON CORRELATION FUNCTIONS
without any a priori assumption about its profile. All the data points of the correlation function deviating from unity, are used to obtain information about the source function.
Combining the flexibility of the imaging approach with our qualitative understanding of the link between the main phys-ical properties of the source and the global features of the correlation function, we have analyzed the momentum depen-dence of two-proton correlations measured in14N+197Au re-actions at 75 MeV/u [6]. Details of the experiment can be found in [13]. The data points on Fig. (3) show the proton-proton correlation functions measured for three bins of total momentum,Psum, in the lab frame, Psum=840-1230, 450-780 and 270-390 MeV/c.
FIG. 3: (Color online) Gaussian analysis (left panel) and Imaging analysis (right panel) of two-proton correlation functions measured in14N+197Au collisions at E/A=30 MeV. See text for details [10].
The thick curves on the right panel of Fig. 3 show the best-fits of the experimental data with the imaging approach [10]. All the data points deviating from unity are reproduced by the numerical inversion of Eq. (1). As a comparison, the left panel of Fig. 3 shows the results of a more common one-dimensional analysis approach[13, 14]. Indeed, the dashed lines correspond to a best fit of the experimental data per-formed by using Gaussian sources with the width used as the only free parameter. The failure of such approach clearly demonstrates the non-Gaussian nature of the sources. A cor-rect extraction of the source function requires a detailed de-scription of the whole shape of the correlation function. This goal is achieved successfully by the imaging technique and the resulting emitting sources are shown by the thick lines on Fig. 4 [10]. The dashed lines refer to the Gaussian sources used to fit the data on the left panel of Fig. 3. It is clearly
FIG. 4: (Color online) Solid thick lines: imaged sources. Dashed lines: Gaussian sources. See text for details [10].
seen that without a detailed shape analysis of the correlation function, the emitting sources are not correctly extracted.
As we outlined in section 2, the imaged sources, repre-sented in Fig. 4 refer to the short range portion, dominated by fast pre-equilibrium emissions. Their sizes, quantified by their r1/2 values are 2.44±0.4 fm, 3.13±0.14 fm and 2.93±0.15 fm, for Psum=840-1230, 450-780, and 270-390 MeV/c, re-spectively. The total momentum dependence of these sizes is shown in the left panel of Fig. 5. Consistent with pre-vious analysis, the widths of the Gaussian source (open cir-cles) decrease strongly with increasing total momentum of the two protons. However, these sizes are not correct because the Gaussian source does not fit the experimental data (see Fig. 3). The sizes extracted by imaging (solid points) do not show a strong dependence on the total momenta of the pairs. This weak sensitivity toPsumof the short range sizes of the imaged sources, refer mainly to a property of the small localized emitting region in space-time corresponding to pre-equilibrium emissions. Proton pairs produced by long lifetime emission mechanisms, such as evaporation and secondary de-cays, mainly contribute at large relative distancesr, outside the imaged region, due to the experimental thresholds in the measured correlation functions.
FIG. 5: Source size (left panel) and contributions from long-lifetime proton emission (right panel) as a function of total momentum,Psum.
from evaporative processes and secondary decays, typical in the later stages of the reactions. All the strong total momen-tum dependence observed in the correlation data is reflected in contributions from long-lifetime emissions (as shown on the right panel of Fig. 5, rather than in the size of the imaged sources.
These results demonstrate clearly that extracting the size of the emitting source requires a detailed shape analysis of the correlation function. This consideration can be easily extended to correlation functions constructed with particles heavier than protons. Failures in reproducing the line-shape of the correlation function leads to large inaccuracies as far as the volume of the source is concerned.
IV. PROBING TRANSPORT MODELS BY IMAGING TWO-PROTON CORRELATIONS
The source extent shown on Fig. 5 represents low order in-formation about the source itself. Of course, the whole profile of the source extracted by means of the imaging technique contains much more information. This profile can indeed be used to constrain certain features of microscopic reaction models. Within the context of reaction models it is possible to calculate the two-proton emitting source directly from the sin-gle particle emission functions [15, 16]. Comparisons to the source profiles extracted from the experimental data by means of the imaging technique allow one to perform more stringent tests of transport properties of nuclear matter.
In an attempt to constrain BUU transport model predictions, two-proton correlation functions measured in central Ar+Ac at E/A=80, 120 and 160 MeV have been imaged [17, 18]. The main difficulty in performing this kind of analysis stems from the fact that BUU does not contain any fragment formation mechanisms. Therefore, BUU simulations are more suited to
describe the early dynamical stage of the reaction. In the pre-vious section we have explained how imaging provides the profile of the dynamical stage and a quantitative estimate of the relative contributions from the fast pre-equilibrium source and the slow secondary decay emitting source. Based on such considerations, the imaging analyses of the experimental data in Ref. [18] was performed to extract both the profile of the dynamical source and also a normalization constant that can be identified with the λparameter in Fig. 5. This normal-ization factor was used to scale the BUU two-proton source functions to better compare to the imaged source profiles.
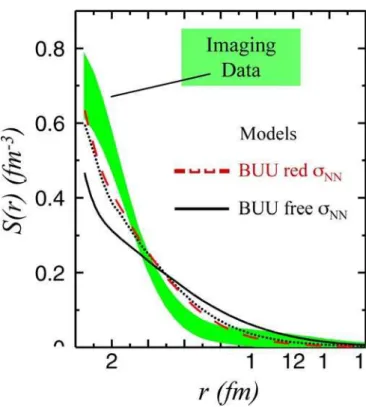
FIG. 6: (Color online) Two-proton source function in central Ar+Sc collisions at E/A=80 MeV. Shaded area: results from imaging; Lines: BUU simulations with free (solid) and reduced (dotted and dashed lines) nucleon-nucleon cross section.
when free cross section values were used. The results on the cross section reductions reported here are consistent with the conclusions deduced in Ref. [19] from the analysis of flow data. Despite these successes at E/A=80 MeV, at higher ener-gies, E/A=160 MeV, the shape of the two-proton source from imaging exhibits a core+tail behavior that is not reproduced by transport model simulations. The shape of the BUU two-proton source appears incorrect, no matter what cross section is used.
Regardless of the moderate success of imaging-vs-BUU analyses, it should be pointed out that detailed shape studies of two proton correlation functions provide not only reliable space-time extents but also higher order information, such as the source emitting profile, that can be considered a useful probe to test the validity of microscopic models.
Motivated by these results and by the importance of shape studies, one can attempt to apply imaging technique to com-plex particle correlations. However, other complications can play a relevant role and the task becomes difficult. In the next section, shape analyses of deuteron-alpha correlation func-tions are discussed in the context of the effects induced by space-momentum correlations on HBT studies.
V. POSITION-RELATIVE MOMENTUM CORRELATIONS
Particles produced during heavy-ion collisions move with velocities consisting of a thermal and a collective component. The collective component is commonly described with posi-tion dependent velocity fields. In central collisions the exis-tence of radial expansion has been observed and the corre-sponding collective velocities have been extensively parame-terized with a self-similar field,v(r)∝r/R, where Ris the radius of the emitting source. In the case of intensity interfer-ometry analyses, these collective velocity fields are known to induce “position-total momentum correlations” (r−P, where
P=p1+p2) [4–6]. As a consequence, smaller source sizes are expected to be observed when particles pairs with higher velocities are selected [3, 4]. This contribution shows other features that can emerge from space-momentum correlations induced by collective motion and that can severely affect HBT analyses with massive particles. We will focus on the case of deuteron-alpha correlations.
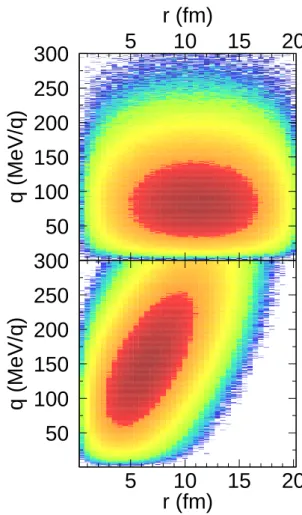
We simulate the emission of d-αpairs by means of a simple Monte Carlo model where the system is described as a sphere with radiusRand temperatureT. The source is assumed to ex-pand radially with a self-similar velocity field,v(r) =βr/R. For each emitted pair the relative separation,r, and the mo-mentum of relative motion,q=µvrel, are recorded. Fig. 7 shows a color scatter plot ofrvsqin the case of a pure ther-mal source,β=0 (upper panel), and in the case of a radially expanding source withβ=0.2 (bottom panel). It is clear that collective motion induces a correlation between relative posi-tion and relative momentum.
What are the effects induced by these “relative momentum-position” correlations on HBT analyses? The main effects consist of: a) an apparent reduction of the source size and b) a distortion in the line shape of the corresponding
corre-50
100
150
200
250
300
5
10
15
20
50
100
150
200
250
300
5
10
15
20
r (fm)
q (MeV/q)
r (fm)
q (MeV/q)
FIG. 7: (Color online) Relative momentum-position correlations in the case of pure thermal sources withβ=0 (top panel) and in the case of thermal and expanding sources withβ=0.2 (bottom panel). See text for details.
lation function. Both effects change drastically the analysis techniques for complex particle correlation functions as well as the space-time information that one can extract from them [20].
The reduction of the apparent source size can be easily explained by the scatter plot shown in the bottom panel of Fig. 7. In the presence of space-momentum correlations, small spatial extents of the source are associated to spondingly small relative momenta. Measurements of corre-lation functions normally extend to finite relative momentum ranges, 0≤q≤qmax, withqmaxof the order of few hundreds of MeV/c’s. As a consequence, the probed region of the emitting source is reduced as compared to the case of a pure thermal source where any relative momentum regions probe particles emitted by the whole source spatial extent.
VI. LINE-SHAPE DISTORTIONS INd−αCORRELATION FUNCTIONS
FIG. 8: (Color online) The LASSA array located inside the Miniball 4πdetector at the NSCL-MSU.
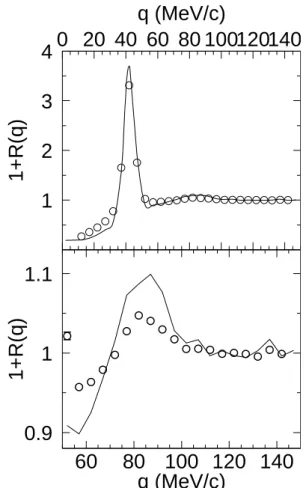
Deuteron-alpha correlation functions were measured in quasi-central Xe+Au collisions at E/A=50 MeV. The exper-iment was performed at the K1200 cyclotron of the Na-tional Superconducting Cyclotron Laboratory at Michigan State University. Isotopically resolved particles with 1≤Z≤10 were detected with nine telescopes of the Large Area Silicon Strip Array (LASSA). Details about the LASSA array can be found in Refs. [21]. Impact parameter selection was per-formed with the Miniball/Miniwall arrays [22] by means of the total multiplicity of detected charged particles. Fig. 9 shows the measured d-α correlation function (data points). The correlation function is determined as the ratio between coincidence two-particle yields and uncorrelated two-particle yields constructed by means of the event mixing techniques [23].
The anticorrelation at small relative momentum, q< 30 MeV/c, is due to the mutual Coulomb repulsion. The sharp peak at relative momentum q=42 MeV/c corresponds the first excited states of 6Li at E*(6Li) = 2.186 MeV state, while
the broad peak around 84 MeV/c stems mainly from the resonance at E*(6Li) = 4.31 MeV. Both peaks are resolved
with high resolution by the LASSA array. Theoretically, the angle-averaged correlation function is commonly calculated using the averaged Koonin-Pratt equation 1. The angle-averaged kernelK(q,r)is calculated from the radial part of the two-particle scattering relative wave function. The source function, S(r), is defined as the probability of emitting two correlated particles separated by a distance r when the last of the two particles is emitted. Due to the presence of collec-tive motion, one can encounter “relacollec-tive momentum-position” correlations, as it was shown in Fig. 7, that make the source function in Eq. 1 bothr- andq-dependent, e.g.S=S(r,q).
By means of the Monte Carlo model described in the previ-ous section, we simulate two-particle source functions,S(r,q),
1
2
3
4
0 20 40 60 80 100120140
q (MeV/c)
1+R(q)
q (MeV/c)
1+R(q)
0.9
1
1.1
60
80
100 120 140
FIG. 9: Data points: Deuteron-alpha correlation functions mea-sured in quasi-central Xe+Au collisions at E/A=50 MeV. Solid line: Simulated d-αcorrelations for purely thermal spherical sources with R=10.5 fm and temperature T=4 MeV.
peaks at q 42 MeV/c and q 84 MeV/c, being generated by the short range mutual d-αnuclear interaction, are mostly popu-lated by d-α pairs emitted from nearly the same location in space with relative distances,r≈0. Therefore, the deuteron and the alpha particles are characterized by almost the same collective velocity. When calculating their relative momen-tum in these regions q=42 MeV/c and 84 MeV/c, the collec-tive components cancel out. On the other hand, the mixed event background, used to construct the uncorrelated back-ground in the correlation function includes: a) particles that come from two different events in which the collective veloc-ity fields are completely different; b) particles that are emitted even from very different space locations in the system. Con-sequently, deuterons and alphas mixed from different events can have very different collective velocity components. Their relative velocity will be on average larger than the one of co-incident d-α pairs. The difference between coincidence and uncorrelated spectra induces a distortion in the shape of the correlation function. The distortion induces a sort of exponen-tial decline in the height of the resonant peaks with increasing relative energy. This effect seem to qualitatively explain the problems observed in Fig. 9 where the height of the second peak appears to be attenuated as compared to a situation where collective motion does not exist.
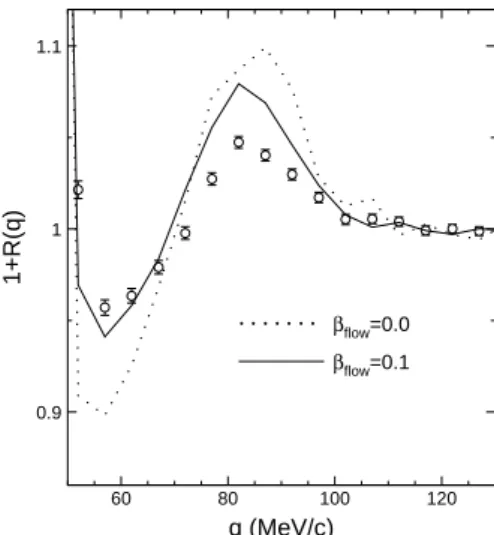
Stimulated by the described considerations, we have com-pared the experimental data to simulations performed with our Monte Carlo calculations by adding collective motion. In sim-ilar reaction systems, a presence of a collective expansion of about 2 MeV per nucleon have been observed by studying fragment kinetic energy spectra [25, 26]. We included such an amount of collective motion in our Monte Carlo simula-tions by choosing a radial expansion parameter,β=0.1. We also assume the emitting system to be characterized by an el-lipsoidal shape with axis,Rz=2·Rx=2·Ry, wherezis the direction of the beam axis. This deformation of the system is intended to schematically simulate emissions from projectile-like and target-projectile-like sources in non-central collision events. In Fig. 10 the results of the simulations are shown in the region corresponding to the second peak at 84 MeV/c. The solid line corresponds to the correlation function obtained with collec-tive motion and for an ellipsoidal source withRz=16 fm,Rx=8 fm andRy=8 fm. While the radial flow parameter,β, has been fixed to the value that would be more consistent with the exist-ing literature, the radii of the ellipsoidal source have obtained by minimizing the chi-squared between data and simulations. The dotted line correspond to the pure thermal source that was already shown to fail in reproducing the shape of the correla-tion funccorrela-tion. The correlacorrela-tion funccorrela-tions shown in Fig. 1 are all normalized to reproduce the height of the first peak at 42 MeV/c. It is clearly observed that including collective motion modifies the line shape of the correlation function improving the comparison to experimental data. The height of the second peak at 84 MeV/c is attenuated due to the interplay between thermal and collective motion in the event mixing background described earlier. Furthermore, the effects of position-relative momentum correlations on the source size induces also a dis-tortion on the Coulomb part of the deuteron-alpha correlation function. This further distortion is observed in the valley
be-tween the two peaks, at q=50-70 MeV/c where the compari-son to experimental data improves when collective motion is turned on.
0.9 1 1.1
60 80 100 120
q (MeV/c)
1+R(q)
βflow=0.0
βflow=0.1
FIG. 10: Expanded view of the peak at q=84 MeV/c in the d-α
correlation function. Open dots: experimental data. Dotted line: pure thermal source. Solid line: emitting source with collective motion,
β=0.1 and elliptical shape withRz=16 fm,Rx=8 fm andRy=8 fm (see text).
Even if the Monte Carlo calculations described in this ar-ticle must be considered only a schematic representation of particle emission properties, they are capable of providing a semi-quantitative description of the data. The distortions in the line-shape of the d-αcorrelation function are qualitatively predicted and the parameters used in the model are close to those that have been more precisely determined in other ex-periments. Assuming that the emitting system contains about 80% of the total mass of the colliding nuclei, consistent with Refs. [25, 26], the density of the d-αsource can be estimated in the rangeρ/ρ0≈0.1-0.4, which is reasonably close to den-sity values expected in these reactions and used as input to statistical multifragmentation models.
Better density determination can be performed with im-proved collective motion models. The simple Monte Carlo approach used here to deuteron and alpha emission represents an oversimplification and it is meant to show what the ef-fects of “relative momentum-position” correlations are on the study of correlation functions between complex particles. On the other hand, collective motion can be determined and con-strained most effectively with high precision measurements using modern 4πdetector designs with high granularity. This would allow a better reconstruction of impact parameter, re-action plans and collective component of particle velocities.
access the dynamical evolution of source densities during the reaction.
VII. CONCLUSIONS
By means of a schematic Monte Carlo approach, position-relative momentum correlations are predicted in the study of intensity interferometry with complex particles interacting with short ranged nuclear forces. The induced effects include an apparent source size reduction and a distortion of the line shape of the correlation function. These distortions are studied in the specific case of deuteron-alpha correlation functions, and used to extract source size information from experimen-tal data collected in the reaction Xe+Au at E/A=50 MeV. The
proposed ideas provide a semi-quantitative explanation of the long-standing problem of the shape of d-α correlation func-tions. By making reasonable assumptions about collective motion and temperature in the emitting system, we improve our understanding of these complex particle correlations and extract source size and densities that are reasonably close to expectations for the studied systems.
These results can play a key role in the study of correlation functions built with massive particles at all incident energies. The effects of collective motion are indeed more pronounced when heavier particles are considered, due to the decreasing magnitude of thermal velocity. Detailed simultaneous analy-ses of HBT observables and collective motion are necessary in order to complex particles to extract space-time informa-tion about nuclear reacinforma-tions.
[1] G. Goldhaber, S. Goldhaber, W. Lee, and A. Pais, Phys. Rev.
120, 300 (1960).
[2] S. E. Koonin, Phys. Lett. B70, 43 (1977).
[3] W. Bauer, C. K. Gelbke, and S. Pratt, Ann. Rev. Nucl. Part. Sci.
42, 77 (1992).
[4] D. H. Boal, C.K. Gelbke, and B. K. Jennings, Rev. Mod. Phys.
62, 553 (1990).
[5] U. Heinz and B. V. Jacak, Ann. Rev. Nucl. Part. Sci.49, 529 (1999).
[6] M. A. Lisa, S. Pratt, R. Soltz, and U. Wiedemann, Ann. Rev. Nucl. Part. Sci.55, 357 (2005).
[7] J. Pochodzalla et al., Phys. Rev. Lett.75, 1040 (1995). [8] S. Pratt and M. B. Tsang, Phys. Rev. C36, 2390 (1987). [9] M. A. Lisa et al., Phys. Rev. Lett.71, 2863 (1993). [10] G. Verde et al., Phys. Rev. C65, 054609 (2002).
[11] D. A. Brown and P. Danielewicz, Phys. Lett. B398, 252 (1997). [12] D. A. Brown and P. Danielewicz, Phys. Rev. C64, 014902
(2001).
[13] W. G. Gong et al., Phys. Rev. C43, 1804 (1991), and references therein.
[14] W. G. Gong et al., Phys. Rev. C43, 781 (1991). [15] W. G. Gong et al., Phys. Rev. Lett.65, 2114 (1990). [16] G.J. Kunde et al., Phys. Rev. Lett.70, 2545 (1993). [17] D. O. Handzy et al., Phys. Rev. C50, 858 (1994). [18] G. Verde et al., Phys. Rev. C67, 034606 (2003). [19] G. D. Westfall et al., Phys. Rev. Lett.71, 1986 (1993). [20] G. Verde et al., submitted for publication on Physics LettersB. [21] B. Davin et al., Nucl. Instr. and Meth. A473, 302 (2001). [22] R.T. de Souza et al., Nucl. Inst. Meth. A295, 109 (1990). [23] M. A. Lisa et al., Phys. Rev. C44, 2865 (1991).