ACPD
11, 29251–29282, 2011The Morning NOx maximum in the forest atmosphere
boundary layer
M. Alaghmand et al.
Title Page
Abstract Introduction
Conclusions References
Tables Figures
◭ ◮
◭ ◮
Back Close
Full Screen / Esc
Printer-friendly Version
Interactive Discussion
Discussion
P
a
per
|
Dis
cussion
P
a
per
|
Discussion
P
a
per
|
Discussio
n
P
a
per
|
Atmos. Chem. Phys. Discuss., 11, 29251–29282, 2011 www.atmos-chem-phys-discuss.net/11/29251/2011/ doi:10.5194/acpd-11-29251-2011
© Author(s) 2011. CC Attribution 3.0 License.
Atmospheric Chemistry and Physics Discussions
This discussion paper is/has been under review for the journal Atmospheric Chemistry and Physics (ACP). Please refer to the corresponding final paper in ACP if available.
The Morning NO
x
maximum in the forest
atmosphere boundary layer
M. Alaghmand1, P. B. Shepson1,2,3, T. K. Starn4, B. T. Jobson5, H. W. Wallace5, M. A. Carroll6, S. B. Bertman7, B. Lamb5, S. L. Edburg5, X. Zhou8, E. Apel9, D. Riemer10, P. Stevens11, and F. Keutsch12
1
Purdue University, Dept. of Chemistry, West Lafayette, IN, USA
2
Dept. of Earth and Atmospheric Sciences, West Lafayette, IN, USA
3
Purdue Climate Change Research Center, West Lafayette, IN, USA
4
West Chester University, Dept. of Chemistry, West Chester, PA, USA
5
Washington State University, Dept. of Civil and Environmental Engineering, Pullman, WA, USA
6
University of Michigan, Dept. of Atmospheric, Oceanic, and Space Sciences, Ann Arbor, MI, USA
7
Western Michigan University, Dept. of Chemistry, Kalamazoo, MI, USA
8
Wadsworth Center, SUNY-Albany, NY, USA
9
National Center for Atmospheric Research, Boulder, CO, USA
10
ACPD
11, 29251–29282, 2011The Morning NOx maximum in the forest atmosphere
boundary layer
M. Alaghmand et al.
Title Page
Abstract Introduction
Conclusions References
Tables Figures
◭ ◮
◭ ◮
Back Close
Full Screen / Esc
Printer-friendly Version
Interactive Discussion
Discussion
P
a
per
|
Dis
cussion
P
a
per
|
Discussion
P
a
per
|
Discussio
n
P
a
per
|
11
Indiana University, School of Public and Environmental Affairs, Bloomington, IN, USA
12
University of Wisconsin, Madison, Dept. of Chemistry, Madison, WI, USA
Received: 22 August 2011 – Accepted: 11 October 2011 – Published: 28 October 2011
Correspondence to: P. B. Shepson ([email protected])
Published by Copernicus Publications on behalf of the European Geosciences Union.
ACPD
11, 29251–29282, 2011The Morning NOx maximum in the forest atmosphere
boundary layer
M. Alaghmand et al.
Title Page
Abstract Introduction
Conclusions References
Tables Figures
◭ ◮
◭ ◮
Back Close
Full Screen / Esc
Printer-friendly Version
Interactive Discussion
Discussion
P
a
per
|
Dis
cussion
P
a
per
|
Discussion
P
a
per
|
Discussio
n
P
a
per
|
Abstract
During the 1998, 2000, 2001, 2008, and 2009 summer intensives of the Program for Research on Oxidants: PHotochemistry, Emissions and Transport (PROPHET), ambi-ent measuremambi-ent of nitrogen oxides (NO+NO2=NOx) were conducted. NO and NOx mole fractions displayed a diurnal pattern with NOxfrequently highest in early morning.
5
This pattern has often been observed in other rural areas. In this paper, we discuss the potential sources and contributing factors of the frequently observed morning pulse of NOx. Of the possible potential contributing factors to the observed morning pulse of NO and NOx, we find that surface-layer transport and slow upward mixing from soil emissions, related to the thermodynamic stability in the nocturnal boundary layer
10
(NBL) before its morning breakup are the largest contributors. The morning NOx peak can significantly impact boundary layer chemistry, e.g. through production of HONO on surfaces, and by increasing the importance of NO3chemistry in the morning boundary layer.
1 Introduction 15
A wide variety of environmental and health impacts result from the emission of NOx (NO+NO2) into the atmosphere, including acidic deposition (Galloway et al., 2008), stimulation of forest growth (Ollinger et al., 2002; Magnani et al., 2007; Lockwood et al., 2008; Costa et al., 2011), including a potentially strong impact on the atmospheric CO2 “fertilization effect” (Norby et al., 2010), production of ozone, and altering (indirectly and
20
directly) atmospheric aerosol concentrations. Continental atmospheric boundary lay-ers typically have NOx concentrations of 1–3 ppb (Parrish et al., 1993; Thornberry et al., 2001), while clean, remote locations have very low NOx concentrations ranging between 4 and 50 ppt (Kondo et al., 1996). NOx regulates photochemical production of tropospheric ozone, and hydroxyl and peroxy radical concentrations directly and
in-25
ACPD
11, 29251–29282, 2011The Morning NOx maximum in the forest atmosphere
boundary layer
M. Alaghmand et al.
Title Page
Abstract Introduction
Conclusions References
Tables Figures
◭ ◮
◭ ◮
Back Close
Full Screen / Esc
Printer-friendly Version
Interactive Discussion
Discussion
P
a
per
|
Dis
cussion
P
a
per
|
Discussion
P
a
per
|
Discussio
n
P
a
per
|
nitrogen dioxide (NO2) by oxidants other than ozone, such as hydroperoxyl radicals (HO2) or organic peroxy radicals (RO2), a net photochemical production of ozone re-sults (Ridley et al., 1992). NOx chemistry, in the presence of other species such as BVOCs (Rollins et al., 2010), NH3 (Dentener and Crutzen, 1994) and humidity, pro-duces nitric acid (HNO3) and aerosol. Thus, through connection to ozone and aerosol
5
production, and through impacts on the carbon cycle, nitrogen chemistry is linked to changes in climate. Understanding the sources and fate of NOx and the distribution of odd nitrogen species is important for quantifying human impacts on both atmospheric composition and climate (Penner et al., 1991).
Since 1997 we have been conducting measurements of NOx, O3, VOCs, and
rad-10
icals as part of the Program for Research on Oxidants: PHotochemistry, Emissions and Transport (PROPHET; Carroll et al., 2001) at the University of Michigan Biolog-ical Station, situated near the tip of the Michigan lower peninsula in a mixed decidu-ous/coniferous forest site. At this site, a morning NOx peak at the sampling location above the forest canopy is routinely observed (Fig. 1). A morning NOxpeak has been
15
observed at other surface sites that are removed from anthropogenic sources (Martin et al., 1991; Parrish et al., 1993; Thornberry et al., 2001). Parrish et al. (1993) re-ported that (NO)/(NOy) peaked in the early morning when NO2was photodissociated rapidly. Thornberry et al. (2001) hypothesized that during the breakup of the nocturnal boundary layer (NBL) in the morning, air aloft is mixed down to the surface, resulting in
20
an increase of NOxat the surface for sites such as PROPHET, where local emissions are small. Day et al. (2009) observed and explained a morning NOxpeak as resulting from this process. However, this hypothesis does not always explain the PROPHET observations, since the morning NOxpeak often starts before sunrise (i.e. well before the NBL breakup). In addition, there are some cases at PROPHET during which
turbu-25
lence data do not support interpretation of the morning NOxpeak via downward mixing of polluted air to the surface. There are a number of possible contributors to the ob-served morning NOxpeak, including: photolysis of highly photo-labile substances that have deposited onto the canopy during nighttime; HONO photodissociation after its
ACPD
11, 29251–29282, 2011The Morning NOx maximum in the forest atmosphere
boundary layer
M. Alaghmand et al.
Title Page
Abstract Introduction
Conclusions References
Tables Figures
◭ ◮
◭ ◮
Back Close
Full Screen / Esc
Printer-friendly Version
Interactive Discussion
Discussion
P
a
per
|
Dis
cussion
P
a
per
|
Discussion
P
a
per
|
Discussio
n
P
a
per
|
nighttime production at the surface (Zhou et al., 2011); downward mixing of polluted air from the residual layer to the surface when the NBL breaks up; local scale combustion; long-range transport of polluted air; and soil NOxemission. Here, we set out to evalu-ate these possibilities to identify the underlying cause of this phenomenon and discuss the supporting data and implications. This study leverages a range of observations
5
from the University of Michigan Biological Station PROPHET tower site (Carroll et al., 2001) over a number of different growing seasons.
2 Experimental
Field studies with relevant and supporting data were conducted in the summers of 1998, 2000, 2001, 2008 and 2009 at the PROPHET measurement site (Carroll et al.,
10
2001). This site consists of a 31.5 m tall scaffolding tower located in a rural mixed decid-uous/coniferous forested area near the northern tip of the lower peninsula of Michigan (45.559◦N, 84.715◦W). The typical canopy height is ∼22 m and is dominated by as-pen, with some maple, oak, birch, beech and a successional undergrowth of white pine (Gough et al., 2007). A range of measurements of NOx, NOy, PAN, O3, aerosol, CO,
15
VOCs, radiation, temperature and wind speed/direction are available in the PROPHET data archive. Most instrumentation was located in the PROPHET laboratory building at the base of the tower. For most instruments air was sampled from a port on the lowest segment of the common 5 cm ID Pyrex manifold that drew air from a height of 35 m into the laboratory building at the base of the tower with a residence time of<2 s (Carroll et
20
al., 2001). NOxwas measured using a custom-built NO chemiluminescence analyzer, constructed as described by Ridley and Grahek (1990). For the instrument used in 2008, chemiluminescence photons were detected using a Burle Industries 8852 photo-multiplier tube, cooled using dry ice, and using a Hamamatsu photon counting system. The instrument incorporates a blue light LED NO2 photolytic converter. Artifact tests
25
ACPD
11, 29251–29282, 2011The Morning NOx maximum in the forest atmosphere
boundary layer
M. Alaghmand et al.
Title Page
Abstract Introduction
Conclusions References
Tables Figures
◭ ◮
◭ ◮
Back Close
Full Screen / Esc
Printer-friendly Version
Interactive Discussion
Discussion
P
a
per
|
Dis
cussion
P
a
per
|
Discussion
P
a
per
|
Discussio
n
P
a
per
|
atmospheric compounds. The artifact test was done before each ambient air sample measurement. The NO2 converter, which has two blue light photodiodes on either end of the converter, photolyzes NO2to NO. The wavelength output of the photodiodes makes the converter very selective for NO2because interferents (e.g. HONO and NO3) do not absorb energy in the photodiode output wavelength range. The average NO2
5
conversion efficiency for a flow rate of 1.2 slpm was determined to be 28.6±0.9 %. The instrument was calibrated daily by dilution of a 5.0 ppm NO in nitrogen standard (Praxair) with ultra-zero air. An independent calibration using a separate NO standard (5 ppm; Praxair) was used to evaluate the accuracy of the standards. These two stan-dards differed by 2 %. The 3σ, 1 min avgerage detection limit for the 2008 study for NO
10
and NO2was 7 ppt. In 2001, NOxand NOywere measured via a similar instrument, as described by Thornberry et al. (2001).
In 2009 NO and NO2 were measured simultaneously using a 2-channel chemilu-minescence instrument (Air Quality Design) with a blue light LED converter for NO2. Sensitivity calibrations were performed daily using standard addition of 10 sccm NO
15
calibration gas 101.4 ppmv±1 % NIST traceable from Scott-Marrin, Inc. The blue light NO2 converter was calibrated by gas phase titration of the NO calibration gas to NO2 using ozone, and the average conversion efficiency was∼60 %. The average sensitivity was∼4 counts per pptv and 5 counts per pptv on the NO and NO2channels, respec-tively. The background counts were 1300 for the NO channel and 1500 Hz for the NO2
20
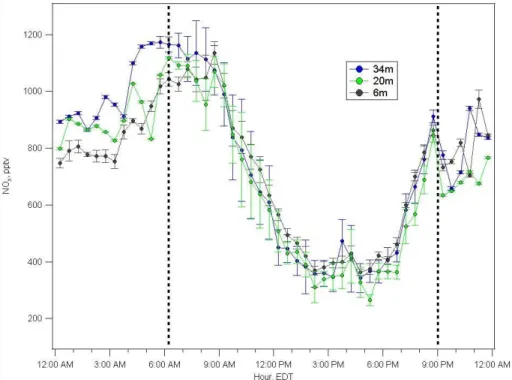
channel. The minimum detection limits defined as 3 times the standard deviation of a 60 second zero air measurement were 25 pptv for NO and 33 pptv for NO2. Sampling was done from 3 separate PFA Teflon inlets to measure the vertical gradients through the canopy. The sampling heights were 6 m, 20 m and 34 m. The diameters of the PFA tubes were1/2′′ for the 6-m and 20-m tubes and 5/8′′ for the 34m tube. The flow
25
rates were approximately 80 slpm for the 1/2′′tubes and 130 slpm for the 5/8′′tube. An
automated valving system cycled a 10 min sampling duration sequentially from each inlet for approximately 3 weeks.
ACPD
11, 29251–29282, 2011The Morning NOx maximum in the forest atmosphere
boundary layer
M. Alaghmand et al.
Title Page
Abstract Introduction
Conclusions References
Tables Figures
◭ ◮
◭ ◮
Back Close
Full Screen / Esc
Printer-friendly Version
Interactive Discussion
Discussion
P
a
per
|
Dis
cussion
P
a
per
|
Discussion
P
a
per
|
Discussio
n
P
a
per
|
Benzene and toluene were measured by GC/MS, as described by Apel et al. (2002). Aerosol size distributions were measured using a Scanning Mobility Particle Sizer (SMPS), deployed on the tower at a height of 26 m, 4 m above the average canopy height. The sampling inlet consisted of 7 m of1/
4′′Tygon tubing. A GAST pump was used to create a fast flow rate, while the SMPS sampled from a tee connected to the
5
tubing that led to the pump. The flow rate of the pump was set to 1.5 L/min. using a needle valve. Size distribution data were collected every 5 minutes, continuously, except during periods of vertical profiling within the forest canopy.
A TECO 49C Ozone monitor was employed to determine ozone, with a precision of ∼1 ppb. CO concentrations in 2001 were determined using a TECO 48C. PAN was 10
determined using a GC-ECD instrument, as described in Pippin et al. (2001).
3 Results and discussion
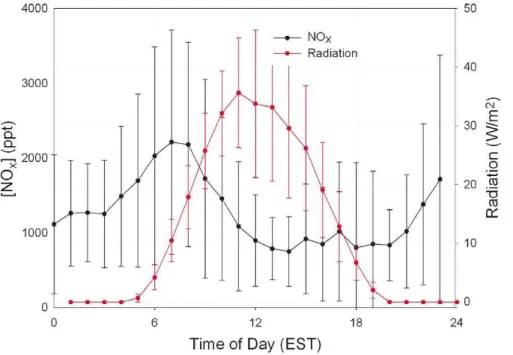
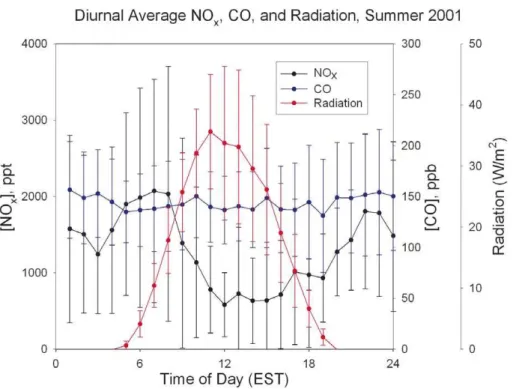
Figure 1 presents the diurnal average (hourly) NOx and radiation observed at the PROPHET site over the 24 June 2008 to 26 July 2008 measurement period. Fig-ure 1S (see Supplement) shows four different daily observations. As shown in Fig. 1
15
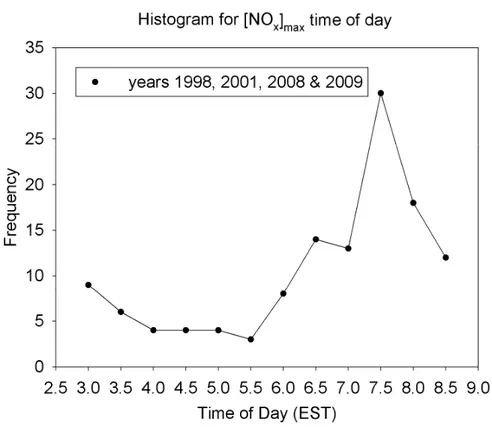
there is, on average, an increase of∼1 ppb of NOx at the tower sampling inlet (34 m, approximately 12 m above canopy height) between 03:00 to 07:00 (all times reported in EST unless noted) with a maximum around 07:00. We observe the average NOxmole fraction to begin to increase before sunrise, as shown in individual cases below. A plot of the frequency of the time of day for the maximum in NOx is shown in Fig. 2. While
20
the peak occurs at 0730, there are significant numbers of events that occur with earlier maxima, when the atmosphere is still quite stable, prior to breakup of the NBL due to solar heating. For the time period 04:00–08:00, the distribution (histogram) of NOx observations (data not shown) is very broad, with a peak at 600–800 ppt, but extending out to ∼3000 ppt; in contrast, the midday distribution is rather sharp, with a peak in 25
ACPD
11, 29251–29282, 2011The Morning NOx maximum in the forest atmosphere
boundary layer
M. Alaghmand et al.
Title Page
Abstract Introduction
Conclusions References
Tables Figures
◭ ◮
◭ ◮
Back Close
Full Screen / Esc
Printer-friendly Version
Interactive Discussion
Discussion
P
a
per
|
Dis
cussion
P
a
per
|
Discussion
P
a
per
|
Discussio
n
P
a
per
|
The increase in NO in the morning can be readily explained by photolysis of NO2, and the photostationary state relationship (Reactions R1–3 and Eq. 1).
NO2+hν→NO+O(3P) (R1)
O(3P)+O2→O3 (R2)
O3+NO→NO2+O2 (R3)
5
(NO)pss=JNO2(NO2)/k3(O3) (1)
As an example, in Fig. 3 we show the observed (NO), along with the calculated [NO]pss from Eq. (1), for 1 July 2008. Figure 3 shows the calculatedJNO2, and observed O3 mole fraction for that day. [NO]psshas the same shape and comparable magnitude as the observed [NO] in the morning, and thus photolysis of NO2can explain the morning
10
NO peak. While NO2 photolysis can explain the NO peak, it does not explain the morning NOx peak that is often observed before sunrise. Below we discuss each of the potential mechanisms that could explain a morning NOx peak.
3.1 HONO production and photolysis
As discussed by many in the past, HONO is produced on a variety of surfaces
(Saka-15
maki et al., 1987; Finlayson-Pitts et al., 2003; Zhou et al., 2002, 2011), e.g. as shown in Reaction (R4). If sufficient HONO were produced on forest canopy surfaces and released to the stable boundary layer, photolysis upon sunrise (Reaction R5) could account for some of the NOx.
2NO2+H2O→HNO3+HONO (R4)
20
HONO+hν→NO+OH (R5)
To test this, we calculated the total possible production of NOxfrom HONO photolysis for the average data, using the HONO observations for 23 July 2008; JHONO[HONO]
ACPD
11, 29251–29282, 2011The Morning NOx maximum in the forest atmosphere
boundary layer
M. Alaghmand et al.
Title Page
Abstract Introduction
Conclusions References
Tables Figures
◭ ◮
◭ ◮
Back Close
Full Screen / Esc
Printer-friendly Version
Interactive Discussion
Discussion
P
a
per
|
Dis
cussion
P
a
per
|
Discussion
P
a
per
|
Discussio
n
P
a
per
|
was integrated over the period 03:35 to 07:10, during which (HONO) was 20–25 ppt, and during which NOx increased by 611 ppt, from about 1100 ppt. Integrated HONO photolysis over this period yielded a total NOx production of∼84 ppt, only 14 % of the observed 611 pptv increase in NOx. We note that we used clear sky JHONO values for this calculation, so our NOx production from HONO photolysis is an upper limit.
5
Interestingly, (HONO) increases through the morning with radiation at this site, and thus photo-induced HONO production is much more important than the dark production mechanism. Thus while HONO production and photolysis is significant (especially as an OH source), it appears to represent only a minor source of NOx production at the surface at this site.
10
3.2 Downward mixing of polluted air
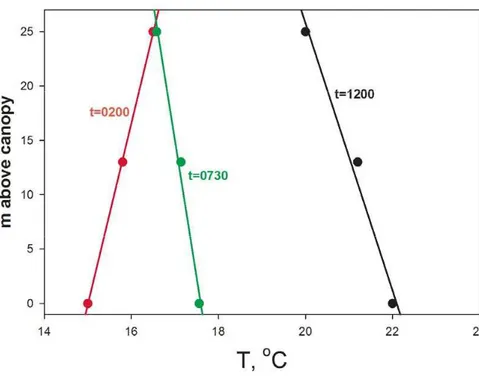
As discussed by Hastie et al. (1993) and others, the NBL is thermodynamically sta-ble, with a positive lapse rate that can be as much as 0.04 K m−1 (see Fig. 4, for 24 July 2008; this was a typical clear sky night, with a large NOx peak before sunrise, see Fig. 8). The air near the surface is therefore isolated from that aloft, resulting in
15
exponential decay in concentrations of various pollutants at the surface, due to dry de-positional loss. Downward mixing of polluted (i.e. high NOx) air from aloft (e.g. from within the residual layer, or from nocturnal jets, Singh et al., 1993), may result in an increase in [NOx] (or other species that are relatively surface-depleted) at the surface. If this were the case, within the polluted layer aloft would be elevated concentrations
20
of CO (if the source is combustion) as well as of PAN and O3, relative to the surface layer at tower height due to dry depositional loss of PAN and O3from the surface layer during the time prior to the occurrence of the peak (Hastie et al., 1993). A viable hy-pothesis is that downward mixing of air either not subject to dry depositional losses, or containing transported pollution, would cause an increase of these species observed at
25
ACPD
11, 29251–29282, 2011The Morning NOx maximum in the forest atmosphere
boundary layer
M. Alaghmand et al.
Title Page
Abstract Introduction
Conclusions References
Tables Figures
◭ ◮
◭ ◮
Back Close
Full Screen / Esc
Printer-friendly Version
Interactive Discussion
Discussion
P
a
per
|
Dis
cussion
P
a
per
|
Discussion
P
a
per
|
Discussio
n
P
a
per
|
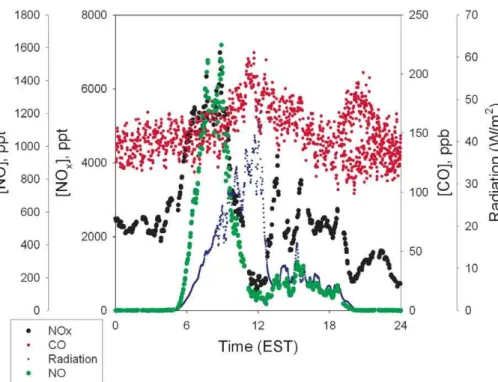
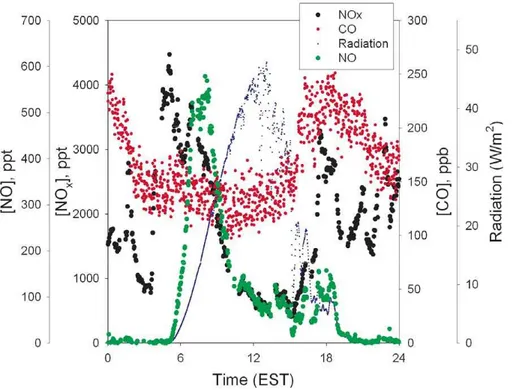
constant at the time of the NOxmaximum, and thus inconsistent with downward mixing of polluted air. Futhermore, beginning at 08:00 (a time typically associated with the start of the NBL breakup) NOx decreases, likely from dilution with relatively cleaner air from aloft (see also Fig. 1). Figures 6 and 8 present radiation, [NO], [NOx], and [CO] obtained on 20 and 24 July 2001, respectively, each of which shows the NOx
5
peak beginning in the 04:00–05:00 EST time frame. If combustion was the source of the NOx in these cases, there would have been a simultaneous increase in CO of ∼30–90 ppb, given the typical value for the CO emission factor of∆CO/∆NOx∼8 from mobile sources (McGaughey et al., 2004), and∼25 in stationary source combustion plumes (Neuman et al., 2009; Nicks et al., 2003), and the relatively longer lifetime for
10
CO. While this was not observed, the variability in the CO data is at the lower end of this range, and it is thus difficult to rule that out. For the case shown in Fig. 8, the NOx peak began roughly one hour before sunrise (clearly before the NO increase). Thus it seems clear that NOxbehaves not at all like O3and PAN (species that mix downward upon the breakup of the NBL), but in fact, much more like a species with a surface
15
source, that builds up under the NBL, and is diluted in the surface layer by downward mixing of cleaner air upon breakup of the NBL.
The impact of vertical mixing can also be directly evaluated, using observations of turbulence along with the chemical species. In Fig. 7 we present observations of radi-ation, calculated friction velocity (a measure of turbulent mixing), NOx, PAN and ozone
20
concentration data for 20 July 2001. As shown in this figure, while there is a ∼3 ppb increase in NOx starting in the 04:00–05:00 EST time frame, neither PAN nor O3 in-crease, as would be expected if the source were downward mixing (Hastie et al., 1993). PAN and O3do increase later in the morning as the mixed layer deepens, and PAN and O3mix downward (Hastie et al., 1993). The friction velocity is relatively low through the
25
morning NOxpeak. This is further evidence that vertical mixing is not playing a major role since clearly the morning NOxpeak can often occur in very stable conditions.
Along with CO, a number of “markers” of combustion exist that are useful; among them is aerosol. In the summer of 2008 aerosol measurements using an SMPS,
ACPD
11, 29251–29282, 2011The Morning NOx maximum in the forest atmosphere
boundary layer
M. Alaghmand et al.
Title Page
Abstract Introduction
Conclusions References
Tables Figures
◭ ◮
◭ ◮
Back Close
Full Screen / Esc
Printer-friendly Version
Interactive Discussion
Discussion
P
a
per
|
Dis
cussion
P
a
per
|
Discussion
P
a
per
|
Discussio
n
P
a
per
|
mounted∼10 m above the canopy on the PROPHET tower were conducted. Figure 9 shows radiation, fine particle number density (15–40 nm diameter range), [NOx], and O3observed on 1 July 2008. As shown in this figure, NOxbegins increasing at∼04:00, while O3is decreasing, presumably a result of dry deposition within the stable boundary layer. At the time of the NOx peak at∼7 a.m., there is no significant change in small
5
particle number density, i.e. again no sign of an impact of local combustion-related NOx. Thus there are numerous cases that clearly do not result from downward mixing of polluted air from aloft, nor from transport of local scale combustion NOx.
3.3 Upward mixing from surface sources
An alternative possibility is that NOx from sources below the canopy or soil slowly
10
diffuses upward past the inlet, in the relatively stable night air, and passes the inlet at semi-random times, but enhanced by sunrise-mediated turbulence. Soil NO flux data obtained by Carleton and Carroll (unpublished data, 2003) indicates an upward emission (or flux) in this forest of, on average,∼180 nmoles m−2-h. If that NOx mixes into a 40 m layer (i.e. up to roughly the tower inlet height) over a 6 h period (i.e. from
15
sunset to the typical time of observation of the NOx increase), this is the equivalent of∼0.7 ppb, within the range of observations. Of course it is more likely that the NOx emitted would be more stratified and thus the peak concentrations observed as the NOx-enriched air moves upward past the tower inlet could be greater than this. Thus soil emissions followed by upward mixing could possibly explain a significant amount of
20
the observed NOxpeak. Vertical profile measurements of NOxconducted in the below-canopy environment in the summer of 2009 are shown in Fig. 10. This plot shows that on average, there is more NOxat the 34-m height than below, during the early morning hours. Such an average plot can, however, be impacted by occasional transport events carrying large concentrations just above the canopy, as discussed below. Figure 11 is
25
ACPD
11, 29251–29282, 2011The Morning NOx maximum in the forest atmosphere
boundary layer
M. Alaghmand et al.
Title Page
Abstract Introduction
Conclusions References
Tables Figures
◭ ◮
◭ ◮
Back Close
Full Screen / Esc
Printer-friendly Version
Interactive Discussion
Discussion
P
a
per
|
Dis
cussion
P
a
per
|
Discussion
P
a
per
|
Discussio
n
P
a
per
|
would lead to an upward flux of NOx from the surface. Thus the available information indicates that under stable NBL conditions sufficient NOx could accumulate under the canopy. If a mixing event were to occur, e.g. a large-scale eddy, then this could account for some of the observations.
3.4 Anthropogenic sources 5
A last remaining possibility is long-range transport of aged polluted air from pogenic sources, e.g., for UMBS, from Detroit or Chicago. A good marker for anthro-pogenic pollution is toluene, a significant mobile source pollutant. As shown in Fig. 12, on 8 August 1998 there is an increase in NOx during the time that O3 is decreasing in the NBL due to dry deposition. Toluene increases with NOx, in support of the
pol-10
lution transport hypothesis. In Fig. 13, we show the 24-h. isentropic back trajectory (HYSPLIT) showing that the sampled air likely transported at or very near the surface through the night, with an origin in the Detroit metropolitan area. This suggests that long-range transport of polluted air at or near the surface of the stable NBL may occur. We note that the data shown in Fig. 11 also show instances of gradients with
signif-15
icantly more NOx at tower height, compared to the surface level. To date, there has been little study of long-range pollutant transport in near-surface stable air. While Banta et al. (1998) discuss that nighttime transport of pollutants away from urban sources is more important than previously thought, the transport is generally thought to occur in the residual layer. In support of this interpretation, examination of the back trajectories
20
(see the Figs. 2S–6S) indicates that all the air masses arriving at the site when the high morning NOx maximum appeared traveled near the ground and mostly in dark-ness during the previous 12 h., although the back trajectories are highly uncertain in these cases. While some of the air masses originated or passed through an urban region (Figs. 2S, 4S, 6S), some did not (e.g. Figs. 3S and 5S). The air mass arriving
25
at the site on 20 July 2001 (Figs. 6 and 3S) might have accumulated NOx from var-ious sources when traveling at low altitude over small towns and highways (Fig. 3S). In contrast, the case of 1 July 2008 (Fig. 9) is difficult to explain by emissions into a
ACPD
11, 29251–29282, 2011The Morning NOx maximum in the forest atmosphere
boundary layer
M. Alaghmand et al.
Title Page
Abstract Introduction
Conclusions References
Tables Figures
◭ ◮
◭ ◮
Back Close
Full Screen / Esc
Printer-friendly Version
Interactive Discussion
Discussion
P
a
per
|
Dis
cussion
P
a
per
|
Discussion
P
a
per
|
Discussio
n
P
a
per
|
stratified NBL during low-altitude long-distance transport, since the air came from the north over Lake Michigan where there are no significant NOxsources. It is conceivable that for this case, the soil NOx flux discussed above was the major factor. It must be that for all nights, transport from upwind sources within the NBL, and the local soil NOx emissions both contribute, to varying degrees, depending on the source trajectory, and
5
local surface soil conditions (T, soil moisture, etc.).
4 Conclusions
While the morning NO peak is clearly explained by photolysis of NO2, photochemistry cannot explain the morning peak in NOx. We showed that this peak is inconsistent with downward mixing from the residual layer, nor can it be caused by photolysis of
10
nitrogen species on the canopy surface, as it often occurs before sunrise. We present data showing that these events likely occur as a result of the lack of vertical mixing dur-ing long-range transport of air to the site. Durdur-ing transport the air mass accumulates combustion and/or soil NOx emissions into the stable NBL. From this work, a picture emerges of a regional surface-bound air mass that “wallows” in the direction of the
15
mean surface wind while accumulating NOx from the variety of surface sources, both anthropogenic (point and distributed) and natural (likely widely distributed soil emis-sions), culminating in a peak in [NOx] just before the NBL breakup with associated downward mixing from the typically lower-NOx residual layer. Such processes can have a large impact on the composition of the atmosphere prior to and at the time
20
of sunrise, leading to relatively NOx-rich morning conditions at an otherwise relatively clean-air site. High NOx levels can impact early morning chemistry involving the NO3 radical (Reactions R6–R9 below), conversion
NO2+O3→NO3+O2 (R6)
NO3+NO2↔N2O5 (R7)
ACPD
11, 29251–29282, 2011The Morning NOx maximum in the forest atmosphere
boundary layer
M. Alaghmand et al.
Title Page
Abstract Introduction
Conclusions References
Tables Figures
◭ ◮
◭ ◮
Back Close
Full Screen / Esc
Printer-friendly Version
Interactive Discussion
Discussion
P
a
per
|
Dis
cussion
P
a
per
|
Discussion
P
a
per
|
Discussio
n
P
a
per
|
N2O5+aerosols→aerosol nitrate (R8)
NO3+BVOCs→RONO2 (R9)
of NOx to HNO3, and organic nitrates (cf. Perring et al., 2009). Indeed, we find that a very important source of daytime RONO2production results from NO3reaction with isoprene, at the UMBS site (Pratt et al., 2011). There can also be significant impacts
5
on the morning photochemistry, since the enhanced [NO2] and relatively large relative humidities present at that time can promote HONO production and thus larger OH production rates at sunrise. As chemical transport at night has been little studied, such processes should be investigated further, as part of organized field campaigns. Much light could be shed on this through vertical profile NOx measurements at night across
10
a sufficient scale (e.g. the Michigan lower peninsula), and through the full boundary layer, as well as high resolution numerical simulations that capture the aforementioned dynamics. Such data, along with regional scale estimates of soil NOx emissions, can then be used to evaluate and improve regional scale air quality models, such as CMAQ (cf. Smith and Mueller, 2011), to better represent the sunrise to noon component
15
of regional photochemical oxidant evolution, which is clearly impacted by nighttime surface-level NOxemission and transport. The proper treatment of the behavior of the surface level NOxin the nighttime and morning periods will require better understanding of mixing and transport in the stable nighttime boundary layer, which is a challenge that may need to include processes such as canopy-atmosphere coupling, not normally
20
treated in models of boundary layer turbulence (Steiner et al., 2011).
Supplementary material related to this article is available online at: http://www.atmos-chem-phys-discuss.net/11/29251/2011/
acpd-11-29251-2011-supplement.pdf.
ACPD
11, 29251–29282, 2011The Morning NOx maximum in the forest atmosphere
boundary layer
M. Alaghmand et al.
Title Page
Abstract Introduction
Conclusions References
Tables Figures
◭ ◮
◭ ◮
Back Close
Full Screen / Esc
Printer-friendly Version
Interactive Discussion
Discussion
P
a
per
|
Dis
cussion
P
a
per
|
Discussion
P
a
per
|
Discussio
n
P
a
per
|
Acknowledgements. We (PBS) gratefully acknowledge support by the National Science Foun-dation grant, No. ATM0542701, and EPA (STAR Grant R833750).
References
Apel, E. C., Riemer, D. D., Hills, A., Baugh, W., Orlando, J., Faloona, I., Tan, D., Brune, W., Lamb, B., Westberg, H., Carroll, M. A., Thornberry, T., and Geron, C. D.: Measurement and
5
interpretation of isoprene fluxes and isoprene, methacrolein, and methyl vinyl ketone mixing ratios at the PROPHET site during the 1998 Intensive, J. Geophys. Res., 107, D3, 4034, doi:10.1029/2000JD000225, 2002.
Banta, R. M., Senff, C. J., White, A. B., Trainer, M., McNier, R. T., Valente, R. J., Mayor, S. D., Alvarez, P. J., Michael Hardesty, R., Parrish, D., and Fehsenfeld, F. C.: Daytime buidup
10
and nighttime transport of urban ozone in the boundary layer during a stagnation episode, J. Geophys. Res., 103, D17, 22, 519–22,544, 1998.
Carroll, M. A., McFarland, M., Ridley, B. A., and Albritton, D. L.: Ground-based nitric oxide measurements at Wallops Island Virginia, J. Geophys. Res., 90, 12, 12,853–12,860, 1985. Carroll, M. A., Shepson, P. B., and Bertman, S. B.: Overview of the Program for Research on
15
Oxidants: PHotochemistry, Emissions, and Transport (PROPHET) Summer 1998 Measure-ments Intensive, J. Geophys. Res., 106, 24,275–24,288, 2001.
Costa, A. W., Michalski, G., Alexander, B., and Shepson, P. B.: Analysis of Atmospheric In-puts of Nitrate to a Temperate Forest Ecosystem from∆17O Isotope Ratio Measurements, Geophys. Res. Lett., 38, L15805, doi:10.1029/2011GL047539, 2011.
20
Day, D. A., Farmer, D. K., Goldstein, A. H., Wooldridge, P. J., Minejima, C., and Cohen, R. C.: Observations of NOx, PPNs, PANs, and HNO3 at a Rural Site in the California Sierra Nevada Mountains: summertime diurnal cycles, Atmos. Chem. Phys., 9, 4879–4896, doi:10.5194/acp-9-4879-2009, 2009.
Dentener, F. J. and Crutzen P. J.: A 3-dimensional model of the global ammonia cycle, J. Atmos.
25
Chem., 19, 331–369, 1994.
ACPD
11, 29251–29282, 2011The Morning NOx maximum in the forest atmosphere
boundary layer
M. Alaghmand et al.
Title Page
Abstract Introduction
Conclusions References
Tables Figures
◭ ◮
◭ ◮
Back Close
Full Screen / Esc
Printer-friendly Version
Interactive Discussion
Discussion
P
a
per
|
Dis
cussion
P
a
per
|
Discussion
P
a
per
|
Discussio
n
P
a
per
|
Demerjian, K. L., and Mackay, G. L.: Intercomparison of NO2measurement techniques, J. Geophys. Res., 95, 3579-3597, 1990.
Finlayson-Pitts, B. J., Wingen L. M., Sumner, A. L., Syomin, D., and Ramazan, K. A.: The het-erogeneous hydrolysis of NO2in laboratory systems and in outdoor and indoor atmospheres: An integrated mechanism, Phys. Chem. Chem. Phys, 5, 223− −242, 2003.
5
Galloway, J. N., Townsend, A. R., Erisman, J. W., Bekunda, M., Cai, Z., Freney, J. R., Martinelli, L. A., Seitzinger, S. P., and Sutton, M. A.: Transformation of the nitrogen cycle: Recent trends, questions, and potential solutions, Science, 320, 889–892, 2008.
Gough, C. M., C. S. Vogel, K. H. Harrold, George, K., and Curtis, P. S.: The legacy of harvest and fire on ecosystem carbon storage in a north temperate forest, Glob. Change Biol., 13,
10
1935–1949, 2007.
Hastie, D. R., Shepson, P. B., Berman, R. and Sharma, S.: The Influence of the Nocturnal Boundary Layer on the Concentration of Secondary Trace Species at Dorset, Ontario, Atmos. Environ., 27A, 533–541, 1993.
Kondo, Y., Ziereis, H., Koike, M., Kawakami, S., Gregory, G. L., Sachse, G. W., Singh, H. B.,
15
Davis, D. D., and Merrill, J. T.: Reactive nitrogen over the Pacific Ocean during PEM-West A, J. Geophys. Res., 101, 1809–1828, 1996.
Kley, D. and McFarlan, M.: Chemiluminescence detector for NO and NO2, Atmos. Technol., 12, 63–69, 1980.
Lin, X., Trainer, M., and Liu, S. C.: On The Nonlinearity Of The Tropospheric Ozone, J. Geophys.
20
Res., 93, 15879–15888, 1988.
Lockwood, A. L., Filley, T. R., Rhodes, D., and Shepson, P. B.: Foliar uptake of atmospheric organic nitrates, Geophys. Res. Lett., 35, L15809, doi:10.1029/2008GL034714, 2008. Magnani, F., Mencuccini, M., Borghetti, M., Lankreijer, H., Law, B. E., Lindroth, A., Lousta, D.,
Manca, G., Moncrieff, J. B., Rayment, M., Tedeschi, V., Valentini, R., and Grace, J.: The
25
human footprint in the carbon cycle of temperate and boreal forests, Nature, 447, 848–852, 2007.
Martin, R. S., Westberg, H., Allwine, E., Ashman, L., Farmer, J. C., and Lamb, B.: Measure-ment of isoprene and its atmospheric oxidation products in a central Pennsylvania Deciduous Forest, J. Atmos. Chem., 13, 1–32, 1991.
30
McGaughey, G. R., Desai, N. R., Allen, D. T., Seila, R. L., Lonneman, W. A., Fraser, M. P., Harley, R. A., Pollack, A. K., Ivy, J. M., and Price, J. H.: Analysis of motor vehicle emissions in a Houston tunnel during the Texas Air Quality Study 2000, Atmos. Environ., 38, 3363–
ACPD
11, 29251–29282, 2011The Morning NOx maximum in the forest atmosphere
boundary layer
M. Alaghmand et al.
Title Page
Abstract Introduction
Conclusions References
Tables Figures
◭ ◮
◭ ◮
Back Close
Full Screen / Esc
Printer-friendly Version
Interactive Discussion
Discussion
P
a
per
|
Dis
cussion
P
a
per
|
Discussion
P
a
per
|
Discussio
n
P
a
per
|
3372, 2004.
Neuman, J. A., Nowak, J. B., Zheng, W., Flocke, F., Ryerson, T. B., Trainner, M., Holloway, J. S., Parrish, D. D., Frost, G., J., Peischl, J., Atlas, E. L., Bahreini, R., Wollny, A. G., and Fehsenfeld, F. C.: Relationship between photochemical ozone production in Houston, Texas. J. Geophys. Res., 114, D00F08, doi:10.1029/2008JD011688, 2009.
5
The Nicks et al. authors are: Nicks Jr, D. K., Holloway, J. S., Ryerson, T. B., Dissly, R. W., Parrish, D. D., Frost, G. J., Trainer, M., Donnelly, S. G., Schauffler, S., Atlas, E. Z., Hbler, G, Sueper, D. T., and Fehsenfeld, F. C. : Fossil-fueled power plants as a source of atmospheric carbon monoxide. J. Environ. Monit., 5, 35–39, 2003.
Norby, R. J., Warren, J. M., Iversen, C. M., Medlyn, B. E., and McMurtrie, R. E.: CO2
enhance-10
ment of forest productivity constrained by limited nitrogen availability, Proc. Nat. Acad. Sci., available at: www.pnas.org/cgi/doi/10.1073/pnas.1006463107, 2010.
Ollinger, S. V., Aber, J. D., Reich, R. B., and Freuder, R. J.: Interactive effects of nitrogen deposition, tropospheric ozone, elevated CO2and land use history on the carbon dynamics of northern hardwood forests, Global Change Biol., 8, 545–562, 2002.
15
Penner, J. E., Atherton, C. S., Dignon, J., Ghan, S. J., Walton, J. J., and Hameed, S.: Tro-pospheric Nitrogen - A 3-Dimensional Study Of Sources, Distributions, And Deposition, J. Geophys. Res., 96, 959–990, 1991.
Perring, A. E., Wisthaler, A., Graus, M., Wooldridge, P. J., Lockwood, A. L., Mielke, L. H., Shep-son, P. B., Hansel, A., and Cohen, R. C.: A product study of the isoprene+NO3 reaction,
20
Atmos. Chem. Phys., 9, 4945–4956, doi:10.5194/acp-9-4945-2009, 2009.
Pippin M. R., Thornberry, T. D., Town, M. S., Carroll, M. A., and Sillman, S.: Seasonal variations of PAN, PPN, and O3 at the upper Midwest PROPHET site. J. Geophys. Res., 106, 24451– 24465, 2001.
Parrish, D. D., Buhr, M. P., Trainer, M., Norton, R. B., Shimshock, J. P., Fehsenfeld, F. C., Anlauf,
25
K. G., Bottenheim, J. W., Tang, Y. Z., Wiebe, H. A., Roberts, J. M., Tanner, R. L., Newman, L., Bowersox, V. C., Olszyna, K. J., Bailey, E. M., Rodgers, M. O., Wang, T., Berresheim, H., Roychowdhury, U. K., and Demerjiani, K. L.: The total reactive oxidized nitrogen levels and the partitioning between the individual species at six rural sites in eastern north America, J. Geophys. Res., 98, 2927–2939, 1993.
30
ACPD
11, 29251–29282, 2011The Morning NOx maximum in the forest atmosphere
boundary layer
M. Alaghmand et al.
Title Page
Abstract Introduction
Conclusions References
Tables Figures
◭ ◮
◭ ◮
Back Close
Full Screen / Esc
Printer-friendly Version
Interactive Discussion
Discussion
P
a
per
|
Dis
cussion
P
a
per
|
Discussion
P
a
per
|
Discussio
n
P
a
per
|
Ridley, B. A. and Grahek, F. E., Small, A.: Low Flow, High-Sensitivity Reaction Vessel For NO Chemiluminescence Detectors, J. Atmos. and Ocean. Technol., 7, 307–311, 1990.
Ridley, B. A. and Howlett, L. C., An instrument for nitric oxide measurements in the stratosphere, Rev. Sci. Instrum., 45, 742–746, 1974.
Ridley, B. A., Carroll, M. A., and Gregory, G. L.: Measurements of nitric oxide in the boundry
5
layer and free troposphere over the pacific., J. Geophys. Res., 92, 12, 2025–2047, 1987. Ridley, B. A., Shetter, J. D., Walega, J. G., Madronich, S., Elsworth, C. M., Grahek, F. E.,
Fehsenfeld, F. C., Norton, R. B., Parrish, D. D., H ¨ubler, G., Buhr, M., Williams, E. J., Allwine, E. J., and Westberg, H. H.: The behavior of some organic nitrates at Boulder and Niwot Ridge, Colorado, J. Geophys. Res., 95, 13949–13961, 1990.
10
Ridley, B. A., Madronic, S., Chatfield, R. B., Walega, J. G., Shetter, R. E., Carroll, M. A., and Montzka, D. D.: Measurements and Model Simulations of the Photostationary State During the Mauna Loa Observatory Photochemistry Experiment: Implications for Radical Concentrations and Ozone Production and Loss Rates, J. Geophys. Res., 97, 10375–10388, 1992.
15
Rollins, A. W., Smith, J. D., Wilson, K. R., and Cohen, R. C.: Real Time In Situ Detection of Organic Nitrates in Atmospheric Aerosols, Environ. Sci. Technol., 44, 5540–5545, 2010. Sakamaki, F., Hatakeyama, S., and Akimoto, H.: Formation Of Nitrous-Acid And Nitric-Oxide In
The Heterogeneous Dark Reaction Of Nitrogen-Dioxide And Water-Vapor In A Smog Cham-ber, Int. J. Chem. Kinet., 15, 1013–1029, 1983.
20
Singh, M. P., Mcnider, R. T., and Lin, J. T.: An Analytical Study Of Diurnal Wind- Structure Variations In The Boundary-Layer And The Low-Level Nocturnal Jet, Bound.-Lay. Meteorol., 63, 397–423, 1993.
Smith, S. N. and Mueller, S. F.: Modeling natural emissions in the Community Multiscale Air Quality (CMAQ) ModelI: building an emissions data base, Atmos. Chem. Phys., 10, 4931–
25
4952, doi:10.5194/acp-10-4931-2010, 2010.
Steiner, A. L., Pressley, S. N., Botros, A., Jones, E., Chung, S. H., and Edburg, S. L.: Analysis of coherent structures and atmosphere-canopy coupling strength during the CABINEX field campaign: implications for atmospheric chemistry, Atmos. Chem. Phys. Discuss., 11, 21013– 21054, doi:10.5194/acpd-11-21013-2011, 2011.
30
Thompson, A. M.: The Oxidizing Capacity Of The Earths Atmosphere – Probable Past And Future Changes, Science, 256, 1157–1165, 1992.
Thornberry T., Carroll, M. A., Keeler, G. J., Silman, S., Bertman, S. B., Pippin, M. R., Ostling,
ACPD
11, 29251–29282, 2011The Morning NOx maximum in the forest atmosphere
boundary layer
M. Alaghmand et al.
Title Page
Abstract Introduction
Conclusions References
Tables Figures
◭ ◮
◭ ◮
Back Close
Full Screen / Esc
Printer-friendly Version
Interactive Discussion
Discussion
P
a
per
|
Dis
cussion
P
a
per
|
Discussion
P
a
per
|
Discussio
n
P
a
per
|
K., Grossenbacher, J. W., Shepson, P. B., Cooper, O. R., Moody, J. L., and Stockwell, W. R.: Observation of reactive oxidized nitrogen and speciation of NOy during the PROPHET summer 1998 intensive, J. Geophys. Res., 106, 24359–24386, 2001.
Wildt, J., Kley, D., Rockel, A., Rockel, P., and Segschneider, H. J.: Emission of NO from several hgher plant species. J. Geophys. Res., 12, D5, 5919–5927, 1997.
5
Zhou, X., Civerolo, K., Dai, H., Huang, G., Schwab, J., and Demerjian, K.: Summertime ni-trous acid chemistry in the atmospheric boundary layer at a rural site in New York State, J. Geophys. Res., 107, 4590, doi:10.1029/2001JD001539, 2002.
Zhou, X. L., Zhang, N., TerAvest, M., Hou, J., Tang, D.,. Bertman, S, Alaghmand, M., Shepson, P. B., Carroll, M. A., Griffith, S., and Stevens, P.: Nitric Acid Photolysis on the Forest Canopy
10
ACPD
11, 29251–29282, 2011The Morning NOx maximum in the forest atmosphere
boundary layer
M. Alaghmand et al.
Title Page
Abstract Introduction
Conclusions References
Tables Figures
◭ ◮
◭ ◮
Back Close
Full Screen / Esc
Printer-friendly Version
Interactive Discussion
Discussion
P
a
per
|
Dis
cussion
P
a
per
|
Discussion
P
a
per
|
Discussio
n
P
a
per
|
Fig. 1.Diurnal variation of NOxfrom 24 June through 26 July 2008 at the PROPHET site and the morning NOxpeak observation.
ACPD
11, 29251–29282, 2011The Morning NOx maximum in the forest atmosphere
boundary layer
M. Alaghmand et al.
Title Page
Abstract Introduction
Conclusions References
Tables Figures
◭ ◮
◭ ◮
Back Close
Full Screen / Esc
Printer-friendly Version
Interactive Discussion
Discussion
P
a
per
|
Dis
cussion
P
a
per
|
Discussion
P
a
per
|
Discussio
n
P
a
per
|
Fig. 3. Observed NO, NO2and ozone concentrations, and calculated steady-state NO, for 2 July 2008.
ACPD
11, 29251–29282, 2011The Morning NOx maximum in the forest atmosphere
boundary layer
M. Alaghmand et al.
Title Page
Abstract Introduction
Conclusions References
Tables Figures
◭ ◮
◭ ◮
Back Close
Full Screen / Esc
Printer-friendly Version
Interactive Discussion
Discussion
P
a
per
|
Dis
cussion
P
a
per
|
Discussion
P
a
per
|
Discussio
n
P
a
per
|
Fig. 5.Diurnal variation of CO, NOxand radiation observed in summer 2001 at the PROPHET site.
ACPD
11, 29251–29282, 2011The Morning NOx maximum in the forest atmosphere
boundary layer
M. Alaghmand et al.
Title Page
Abstract Introduction
Conclusions References
Tables Figures
◭ ◮
◭ ◮
Back Close
Full Screen / Esc
Printer-friendly Version
Interactive Discussion
Discussion
P
a
per
|
Dis
cussion
P
a
per
|
Discussion
P
a
per
|
Discussio
n
P
a
per
|
Fig. 7.Observed radiation, friction velocity, [NOx], [PAN] and [O3] for 20 July 2001.
ACPD
11, 29251–29282, 2011The Morning NOx maximum in the forest atmosphere
boundary layer
M. Alaghmand et al.
Title Page
Abstract Introduction
Conclusions References
Tables Figures
◭ ◮
◭ ◮
Back Close
Full Screen / Esc
Printer-friendly Version
Interactive Discussion
Discussion
P
a
per
|
Dis
cussion
P
a
per
|
Discussion
P
a
per
|
Discussio
n
P
a
per
|
Fig. 9.Radiation, particle number density, [NOx] and [O3] observed on 1 July 2008.
ACPD
11, 29251–29282, 2011The Morning NOx maximum in the forest atmosphere
boundary layer
M. Alaghmand et al.
Title Page
Abstract Introduction
Conclusions References
Tables Figures
◭ ◮
◭ ◮
Back Close
Full Screen / Esc
Printer-friendly Version
Interactive Discussion
Discussion
P
a
per
|
Dis
cussion
P
a
per
|
Discussion
P
a
per
|
Discussio
n
P
a
per
|
Fig. 11. Histogram for the frequency of the magnitude of the NOx concentration gradient be-tween 34m and 6m above ground level, during early morning hours, summer 2009.
ACPD
11, 29251–29282, 2011The Morning NOx maximum in the forest atmosphere
boundary layer
M. Alaghmand et al.
Title Page
Abstract Introduction
Conclusions References
Tables Figures
◭ ◮
◭ ◮
Back Close
Full Screen / Esc
Printer-friendly Version
Interactive Discussion
Discussion
P
a
per
|
Dis
cussion
P
a
per
|
Discussion
P
a
per
|
Discussio
n
P
a
per
|
-90 -88 -86 -84 -82 -80 -78
40 42 44 46
#
L
L
L
L
L
# L L L L L
1500
1000
500 34
06 00 18 12
08/08
06
NOAA HYSPLIT MODEL
Backward trajectory ending at 1100 UTC 08 Aug 98
EDAS Meteorological Data
S
o
u
rce
#
a
t
45.5
8
N
84
.8
0 W
M
e
ters
AG
L
This is not a NOAA product. It was produced by a web user. Job ID: 303940 Job Start: Thu Jul 7 01:34:09 UTC 2011 Source 1 lat.: 45.58 lon.: -84.80 height: 34 m AGL Trajectory Direction: Backward Duration: 30 hrs Vertical Motion Calculation Method: Isentropic Meteorology: 0000Z 01 Aug 2098 - EDAS
Fig. 13.24-h. back trajectory for the early morning of 8 August 1998.

![Fig. 7. Observed radiation, friction velocity, [NO x ], [PAN] and [O 3 ] for 20 July 2001.](https://thumb-eu.123doks.com/thumbv2/123dok_br/18430001.361998/26.918.101.605.118.507/fig-observed-radiation-friction-velocity-pan-o-july.webp)
![Fig. 9. Radiation, particle number density, [NO x ] and [O 3 ] observed on 1 July 2008.](https://thumb-eu.123doks.com/thumbv2/123dok_br/18430001.361998/28.918.100.613.120.508/fig-radiation-particle-number-density-o-observed-july.webp)