J
OURNAL OFN
ANO-
ANDE
LECTRONICP
HYSICS А А-
АVol.
7
No 4, 04088(4pp) (2015)
Том
7
№
4, 04088(4cc) (2015)
2077-6772/2015/7(4)04088(4)
04088-1
2015
Sumy State University
Structural Phase Transition in CdSb + 3 % MnSb Composite at a High Hydrostatic Pressure
R.G. Dzhamamedov
1, A.Ju. Mollayev
1,*, A.V. Kochura
2, P.V. Abakumov
2, R.K. Arslanov
1,
S.F. Marenkin
3,4, M.B. Dobromyslov
51
Amirkhanov Institute of Physics, Dagestan Scientific Center, Russian Academy of Sciences,
94, Yaragskogo St., 367003 Makhachkala, Dagestan, Russia
2South-West State University, Regional Centre of Nanotechnology,
94, 50 let Octyabrya St., 305040 Kursk, Russia
3
Institute of General and Inorganic Chemistry of Russian Academy of Sciences,
31, Leninskii Pr., 119991 Moscow, Russia
4
Moscow Institute of Steel and Alloys (National University of Science and Technology),
4, Leninskii Pr., 119049 Moscow, Russia
5
Pacific National University, 136, Tikhookeanskaya St., 680035 Khabarovsk, Russia
(Received 02 October 2015; published online 24 December 2015)
In CdSb + 3 % MnSb composite, structural properties have been studied, specific resistance and Hall co-efficient RH are measured at a high hydrostatic pressure of up to P ≤ 9 GPa. An irreversible structural phase transition is found at barometric dependencies p(P) and RH(P). From our experimental data, barometric de-pendencies of carrier concentration and their mobility are calculated. On the basis of the heterophase struc-ture – effective medium model, characteristic points and parameters of the phase transition, and also dynam-ics of variation of the initial phase volume C1 as a function of pressure are computed. The latter dependence is in agreement with the investigation results of Raman scattering before and after application of pressure.
Keywords: Magnetic composite, Cadmium antimonide, Spintronic materials, Hydrostatic pressure,
Transport properties
PACS numbers: 81.40.Rs, 81.40.Vw, 75.50.Pp, 78.30.Hv
*
[email protected]
1.
INTRODUCTION
Semiconducting compounds doped with 3d-metalls
are the promising materials for magnetoelectronics
(spintronics) [1]. Depending on the doping element, its
atoms can both replace the cation vacancies in a base
semiconductor and form interstitial defects. In this case,
the state of a diluted magnetic semiconductor is
imple-mented. However, if the limit of solubility is surpassed,
phase layering in the lattice of a base semiconductor
may occur, which results in the formation of micro- or
nanoscale magnetic inclusions (clusters). Diluted
mag-netic semiconductor In
1 –хMnxSb with nanoscale
inclu-sions of ferromagnetic semimetal MnSb with Courier
temperature of around 600 K [2] is an example when
both cases given above are realized. A similar situation
occurs for semiconductors of the group
A
IIB
V, where
B Sb, doped with manganese. The present work
con-tinues that research [5-8] at high hydrostatic pressures
up to 9 GPa.
Earlier, in works [7, 8], undoped single crystal
sam-ples
p-CdSb were studied. The samples were oriented
along crystallographic directions [001] (sample No 1) and
[010] (sample No 2). Specific electrical resistance
ρ and
Hall coefficient R
Hwas measured at high hydrostatic
pressure P 7 GPa at elevation and drop off of pressure
within the range of room temperatures. At dependencies
(P) and RH(P), structural phase transitions were found.
In
sample
No 1,
a
reversible
semiconductor-semiconductor phase transition was observed and in
sample No 2 an irreversible phase transition
accompa-nied by the matter decomposition occurred. X-ray study
of the samples after loading has shown that the
de-formed sample No 1 oriented along [001] produced at
Laue pattern continuous rings with sharp maxima
–
polycrystal with tex
ture. For sample №2, the swing
curve consisted from a number of peaks that
correspond-ed to the reflection off individual blocks. Relative
disori-entation of these blocks was ~ 1-1.50, indicating
consid-erable impairment of the sample quality.
We have investigated structural and electrical
prop-erties of composite sample CdSb + 3 % MnSb at a high
hydrostatic pressure of up to 9 GPa in the range of room
temperature.
2.
EXPERIMANTAL DETAILS
Original crystals were prepared with directional
crystallization according to Bridgeman from polycrystal
CdSb + 3 % MnSb ingots, which were produced
before-hand by alloying of antimonides cadmium and
manga-nese. The samples were cut from the central part of the
crystal and then underwent chemical-mechanical
polish-ing with abrasive particles whose size was not greater
than 20 nm.
G. D
ZHAMAMEDOV,
A.J
U. M
OLLAYEV,
ET AL.
J. NANO- ELECTRON. PHYS.
7
, 04088 (2015)
04088-2
power of 50 mW. The spot of a focused light at the
sam-ple surface was around 500 nm in diameter. The spectral
resolution was 0.8 cm
– 1.
The installation for measuring kinetic coefficients
at hydrostatic pressures
P 9 GPa was a high-
pres-sure device such as toroid [9], which was upgraded to
concurrently measure several kinetic coefficients.
In order to concurrently measure specific resistance
and Hall effect a many-turn solenoid [10] was used,
which made it possible to produce a magnetic field
H 5 kOe. A fluoroplastic capsule with a volume of
80 mm
3was applied as a working cell, which had
12 electric inputs. That made it possible to measure
specific resistance, Hall effect, and control pressure at
compression and decompression. A manganin
manome-ter was calibrated by using fixed points (Bi, Tl, etc.)
Samples were prepared as parallelepipeds with sizes of
2.8 0.7 0.5 mm. As a medium transferring pressure,
a mixture of methanol and ethanol (4 : 1) hydrostatic
up to 10 GPa was used [11]. To determine to what
ex-tent the medium was hydrostatic, two identical
single-crystal samples n-Ge with
1.75
Ω∙cm were put in a
measuring cell perpendicular to each other. The
quan-tity
was measured as a function of pressure up to
9 GPa at 300 K. Both samples revealed that at a fixed
pressure the values of specific resistance did not
coin-cide when the pressure was elevated and lowered. This
fact indicates that there were not axis strengths that
had been observed earlier in the range 4-5 GPa when
as a transfer medium
n-penthane-isoamyl alcohol was
used. In addition to that, these data about dependence
R(P) corroborate that the pressure was rather
hydro-static and shear stresses were absent.
Contacts for measuring electrical properties were
made by soldering with solders at the basis of tin. The
error in measuring resistance, Hall effect and pressure
was not greater than 3 %, 3.5 % and 3 %, respectively.
3.
RESULTS AND DISCUSSION
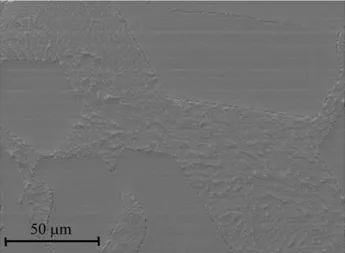
Typical images of the sample surface obtained with
SEM are given in Fig. 1.
Clearly seen are defects of the sample structure as
cracks and volume inclusions with a nonhomogeneous
distribution. These inclusions are both of point and
needle-like shape with the smallest side of 0.5-1 m.
EDXS has revealed that the areas without defects
con-sisted only of Cd and Sb atoms in virtually equal
pro-portions. Within the area of inclusions in EDXS
spec-tra, peaks were appeared corresponding to Mn atoms.
Distribution maps of Cd, Sb, Mn in the area with
inclusions (Fig. 2) measured with EDXS demonstrate
the excessive content of Mn in the areas where there
are fewer Cd atoms. In doing so, the distribution of Sb
atoms is more uniform with a little more content in the
areas where many Mn atoms occur. Therefore,
inclu-sions most likely present the phase of MnSb
1 + (
0),
as it was found earlier in eutectic compositions
InSb-MnSb [12]. It should be noted that InSb-MnSb
1 + is a
ferro-magnetic semimetal with the highest Courier
tempera-ture (TC) among compounds Mn-V that reaches 585 K
for MnSb [13]. In this case, a decrease in Sb content
(
0) results in a decrease in TC
[14], whereas at
0
TC does not change [12].
Fig. 1– SEM image of the sample surface for CdSb + 3 % MnSb
Fig. 2– Element distribution at the fraction of the sample
surface for CdSb + 3 % MnSb having inclusions. Image for Sb content is provided after graphical processing in order to com-pare areas where the content of Sb is little excessive, big Mn content and the absence of Cd
The samples under investigation, therefore, should
most likely have ferromagnetic properties with
TC 585
К.
Crystal lattice of CdSb belongs to the orthorhombic
system (spatial group
Pbca) and has 16 atoms in the
elementary cell. In
point of the Brillouin zone,
48 normal vibration modes stand out [15]:
Г
6(A
g+ B
1g+ B
2g+ B
3g+ A
u+ B
1u+ B
2u+ B
3u)
of which 24 are RS-active. Earlier, at experimental
study of RS-spectra for single crystals CdSb, 22 modes
were found: A
g(37.5, 53, 61, 82, 107 and 173 cm
– 1);
B
1g(53, 66 and 178 cm
– 1); B
2g(53, 107 and 179 cm
– 1)
and
B
3g(49, 61, 70, 128, 154 and 171 cm
– 1) [16].
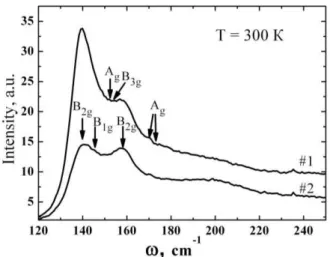
Raman spectra of CdSb + 3 % MnSb sample before
application of 8 GPa pressure and after that are shown
in Fig.3. Because of features of the experimental device,
one was able to measure them only at
100 cm
– 1. In
S
TRUCTURALP
HASET
RANSITION INC
DS
B+ 3 % M
NS
BC
OMPOSITE…
J. NANO- ELECTRON. PHYS.
7
, 04088 (2015)
04088-3
than 1-2 cm
– 1) compared to the values given above for
an undoped single crystal. This fact is in agreement
with the results of [17] where such frequency change of
phonons was explained by the replacement of Cd atoms
with lighter Zn atoms. For CdSb + 3 % MnSb sample,
the situation is most likely similar and part of Mn
at-oms replaces Cd atat-oms, forming this way solid solution
of CdxMn
1 –xSb. At Raman spectra of the sample beforeand after pressure application identical modes are
ob-served. However, the spectrum intensity after pressure
application is reduced; oscillator strength changes and
a broad weak maximum appears around 200 cm
– 1.
Thus, the sample crystallinity was likely lowered and it
went a partial phase layering. There was irreversible
phase transition, which is indicated by the fact that
after pressure application the Raman spectrum
ampli-tude is decreased.
Fig. 3 –Raman spectra for CdSb + 3 % MnSb sample:
#1 – before 8GPa pressure application; #2 – after application. Arrows indicate phonon modes observed at both spectra
Experimental barometric dependencies of specific
resistance
and the Hall coefficient
RH are given in
Fig. 4a. Barometric dependencies of carrier
concentra-tions p(P) and mobility
(P) at room temperatures
cal-culated with consideration for and R
Hfor the
compo-site CdSb + 3 % MnSb are depicted in Fig. 4b.
It is seen from Fig. 4a that specific resistance is almost
constant up to pressure
P
≈
1.2 GPa and then increases
three-fold. At a pressure about 2 GPa, resistance reaches
its maximum and then begins to decrease with various
barometric coefficients and turns lower by almost 2 orders
of magnitude. In the saturation region, specific resistance
equals
≈
7.4∙10
– 5Oh
m∙cm, i.e. metal conductivity o
c-curs. Whereas at atmospheric pressure
≈
0,1 Oh
m·cm,
i.e. semiconductor-to-metal phase transition takes place.
At depressurization, specific resistance at P
≈
1 GPa
is virtually constant but then increases. Initial values
of resistance before and after load application are not
the same, which is indicative of the fact that
irreversi-ble structural phase transition occurred accompanied
by the partial layering of phases. At depressurization,
hysteresis is observed, which is typical for first -order
phase transitions.
Fig. 4 –Barometric dependencies: a) of reduced to
atmospher-ic pressure specifatmospher-ic resistance and Hall coeffatmospher-icient (black sym-bols – increase in pressure, open – depressurization); b) con-centration (open symbols) and mobility (black symbols) at pressure elevation
Hall coefficient (Fig. 4a) varies weakly to a pressure
P
≈
2 GPa and then sharply decreases by more than
two orders of magnitude and at
P
≈
6,7 GPa reaches
saturation. At depressurization, hysteresis is also
ob-served.
In the saturation region, the carrier concentration
≈
7.5∙
10
20cm
– 3, which is characteristic of metals. The
values of Hall coefficient before and after pressure
ap-plication do not coincide, which supports the conclusion
that in p-CdSb + 3 % MnSb irreversible
semiconductor-to-metal phase transition occurred. At
depressuriza-tion, hysteresis is observed.
Fig. 4b shows barometric dependencies of
concen-tration p(P) and mobility
(P) at room temperatures. It
is seen from Fig. 5 that at atmospheric pressure
p
≈
3.7∙10
18cm
– 1and up to pressures
P
≈
1.4 GPa is
nearly constant. Then with pressure increasing, p also
increases and at
P 7 GPa reaches saturation. In the
saturation region
p
7.5∙10
20сm
– 1, which once again
supports the conclusion about phase transition being
semiconductor-metal.
The mobility value
that at atmospheric pressure
is equal to 17.3 cm
2/V·s decreases with pressure i
n-creasing and in the minimum at
P 4.2 GPa equals
1 cm
2/V·s, i.e. becomes lower by 17
-fold. Then mobility
increases again and at P 7 GPa becomes greater by 2
orders of magnitude and reaches saturation.
By using experimental values of the origin
b andthe end of the phase transition
e, at pressure elevationand depressurization P
b, P
e according to the ideasgiv-en in [18-23] and the procedure proposed in [20] some
characteristic points and phase transformation
param-eters at high pressure have been calculated.
Table 1 –Parameters characterizing phase transition at high
pressures in p-CdSb + MnSb (3 % Mn)
P
b,
GPa
Pe,
GPa
GPa
Pо,
Pоm
GPa
Ph.f.
GPa
Pb
,
GPa
Pe
,
GPa
Pо
,
GPa
Pоm
GPa
Ph.f.
GPa
Ph.t
GPa
G. D
ZHAMAMEDOV,
A.J
U. M
OLLAYEV,
ET AL.
J. NANO- ELECTRON. PHYS.
7
, 04088 (2015)
04088-4
Fig. 5 – Volume fraction of the initial phase C1 as a function
of pressure at compression and decompression for
р-CdSb + MnSb (3 % Mn)
From the model heterophase structure
–
effective
medium [19], we have calculated dynamics of changes
in the volume fraction of the initial phase
C
1versus
pressure. At
PH
–
C
1 1 and 2 0 and atPK
–
C1 0
and
2 1. Here 1and
2are relative volumes of
phases
C
1 V1/(V
1 + V2),
C
2 V2/(V
1 + V2),
C
1 + C2 1,where V
1is the initial phase volume,
V
2is the volume
of the produced phase. Depicted in Fig. 5 is the
de-pendence of the volume fraction of the initial phase
C
1(P) on the pressure at its elevation and
depressuriza-tion for the sample
p-CdSb + 3 % MnSb. It should be
noted that the ratio of
C
1before the cycle of pressure
application and after is in qualitative agreement with
the ratio of Raman spectra intensities (Fig. 3). After
pressure application, both the values of
C
1and
spec-trum intensity decrease.
4.
CONCLUSION
Measurements of structural features, Raman
spec-tra, Hall’s coefficient and specific resistance at pressure
elevation and depressurization at room temperatures
in
p-CdSb + 3 % MnSb composite have revealed an
ir-reversible structural phase transition. Barometric
de-pendencies of mobility and carrier concentration have
been calculated. From the model heterophase
struc-ture- effective medium, characteristic points and
pa-rameters of phase transition, and also the volume of
the initial phase C1 as a function of pressure have been
computed.
The reported study was funded in part by RFBR
ac-cording to the research project No 13-02-01105-
а
.
REFERENCES
1. V.A. Ivanov, T.G. Aminov, V.M. Novotortsev, V.T. Kalinnikov, Russ. Chem. Bull.53, 2357 (2004). 2. A.V. Kochura B. Aronzon, K.G. Lisunov, A.V. Lashkul,
A. Sidorenko, R. De Renzi, S.F. Marenkin, M. Alam, A.P. Kuzmenko, E. Lahderanta, J. Appl. Phys. 113, 083905 (2013).
3. S.F. Marenkin, V.M. Trukhan, I.V. Fedorchenko, T.V. Shoulkavaya, Russ. J. Inorg. Chem. 59, 355 (2014). 4. A.V. Kochura, S.F. Marenkin, A.D. Izotov, P.N. Vasilev,
P.V. Abakumov, A.P. Kuzmenko, Inorg. Mater. 51, 754 (2015).
5. A.Yu. Mollaev, Fizika i Tehnika Visokikh Davlenii 14, 34 (2004).
6. A.Yu. Mollaev, L.A. Saipulaeva, R.K. Arslanov, A.N. Babushkin, Inorg. Mater.50, 861 (2014).
7. A.Yu. Mollaev, R.K. Arslanov, R.G. Dzhamamedov, S.F. Marenkin, S.A. Varnavskii, Inorg. Mater. 41, 217 (2005).
8. A.Yu. Mollaev, R.K. Arslanov, R.G. Dzhamamedov, S.F. Marenkin, S.A. Varnavskii, Fizika i Tehnika Visokikh Davlenii 14, 132 (2004).
9. L.G. Khvostantsev, L.P. Vereshagin, A.P. Novikov, High Temp. High Pressure 9, 637 (1977).
10.A.Yu. Mollaev, L.A. Saipulaeva, R.K. Arslanov, S.F. Marenkin, Inorg. Mater. 37, 327 (2001).
11.G.J. Piermarini, S. Block, J.D. Barnett, J. Appl. Phys.44, 5377 (1973).
12.V.M. Novotortsev, A.V. Kochura, S.F. Marenkin, I.V. Fedorchenko, S.V. Drogunov, A. Lashkul, E. Lahderanta, Russ. J. Inorg. Chem. 56, 1951 (2011). 13.W.J. Takei, D.E. Cox, G. Shirane, Phys. Rev. 129, 2008
(1963).
14.I. Teramoto, A.M.J.G. Van Run, J. Phys. Chem. Solids29, 347 (1968).
15.D. Houde, J. Lefaivre, S. Jandl, E. Arushanov, Sol. St. Comm. 41, 325 (1982).
16.D.M. Triches, S.M. Souza, J.C. de Lima, T.A. Grandi, C.E.M. Campos, A. Polian, J.P. Ltie, F. Baudelet, J.C. Chervin. J. Appl. Phys.106, 013509 (2009).
17.D.V. Smirnov, D.V. Mashovets, S. Pasquier, J. Leotin, P. Puech, G. Landa, Yu.V. Roznovan, Semicond. Sci. Technol. 9, 333 (1994).
18.A.L. Roitburd, Phys.-Usp.17, 326 (1974). 19.A.L. Roitburd, Phys. Solid State 25, 33 (1983).
20.A.Yu. Mollaev, R.K. Arslanov, R.I. Akhmedov, L.A. Saipulaeva, Fizika i Tehnika Visokikh Davlenii 4, 66 (1994).
21.A.L. Roitburd, Phys. Solid State 26, 2025 (1984).
22.V.N. Kozlov, G.R. Umarov, A.A. Firsov, Fizika i Tehnika Visokikh Davlenii 23, 9 (1986).