Investigation of model fit and score scale
comparability in international assessments
Maria Elena Oliveri
1& Matthias von Davier
2Abstract
This study used item response data from 30 countries who participated in the Programme for Inter-national Student Assessment (PISA). It compared reduction of proportion of item misfit associated with alternative item response theory (IRT; multidimensional and multi-parameter Rasch and 2 parameter logistic; 2PL) models and linking (mean-mean IRT vs. Lagrangian multiplier and con-current calibration) approaches to those con-currently used by PISA to conduct score scale calibrations. The analyses are conducted with the general diagnostic model (GDM), which is a modeling frame-work that contains all IRT models used in the paper as special cases. The paper also investigated whether the use of an alternative score scale (i.e., a scale that includes the use of international and a subset of country-specific parameters) as compared to the use of solely international parameters for country score scale calibrations led to improvement of fit. Analyses were conducted using discrete mixture distribution IRT as well as multiple group (M-)IRT models. As compared to a scale that uses all international parameters, substantial improvement of fit was obtained using the concurrent calibration linking approach with the multi-group 2PL model allowing for partially-unique country parameters.
Key words: international large-scale assessments, item response theory, general diagnostic model, trends
1
Correspondence concerning this article should be addressed to: Maria Elena Oliveri, PhD ABD, Uni-versity of British Columbia, Vancouver, BC, Canada; email: [email protected]
2
Large-scale assessments (LSAs) of educational outcomes are administered to collect data about educational systems, to inform policies, to support curriculum implementation and educational decision-making. In particular, international LSAs (ILSAs), such as the Programme for International Student Assessment (PISA), Trends in International Mathematics and Science Study (TIMSS), and the Progress in International Reading Literacy Study (PIRLS), are administered across multiple countries and languages to collect information regarding how the academic skills of student groups from one coun-try compare to that of student groups from other countries (Cook, 2006). Moreover, test results from these assessments are used to make inferences regarding the distribution of competencies in policy relevant subgroups at various stages of their education; for exam-ple, test results from PISA are used to make inferences regarding student skills and abili-ties as the members of the target population are getting ready to enter the workforce. However, making inferences based on results of ILSAs and comparing these across countries requires that these results are indeed comparable. Comparability refers to the extent to which the assessments used to measure examinees’ skills tap into the same skills, and provide measures on the same scale that have similar levels of uncertainty. The requirement that results are comparable and are reported on the same scale is some-times referred to as scalar equivalency. Scalar equivalence is obtained when scores have the same measurement unit and origin in all populations (Van de Vijver & Tanzer, 2004). Several factors, including the diversity of examinees’ cultural backgrounds, test-takers’ competency levels in the language of testing and familiarity with test content and format may affect the comparability of measures derived from the observed responses to a test. These factors can influence comparability within countries across subpopulations such as the ones defined by gender or language proficiency. Results of populations compared across countries may also be affected, and potentially to a larger extent, since it can be conjectured that differences in cultural background and familiarity with the assessment material may vary even more across countries participating in the assessment. Previous research has also shed light on issues of curriculum coverage and how curricular non-coverage may affect scale scores in TIMSS (Hencke, Rutkowski, Neuschmidt, & Gon-zalez, 2009). In addition, the adaptation of measures and the inclusion of idiomatic ex-pressions, vocabulary and words that are of differential difficulty for the various popula-tions taking the assessment may also affect comparability (Allalouf, 2003; Ercikan 2002; Ercikan & Koh, 2005; Gierl & Khaliq, 2001). These factors can lead to differential item functioning (DIF) and item misfit for individual country-by-item pairings; the presence of these sources of error should be taken into account when creating an international scale that is used for comparisons across countries.
computer generations ago, a composite of sub-samples of students from each country (e.g., N=500) was used to create an international sample with which individual country’s proficiency distributions were calculated (OECD, 2006). Recent cycles of most interna-tional assessments, however, use the whole sample collected in each country, and utilize senate-weights to ensure equal contribution of each country (OECD, 2006). In either case (i.e., whether the entire sample or sub-samples of students are used for creating profi-ciency distributions), these procedures assume that the international sample and the re-sulting international item parameters represent sufficiently well how items function in each of the participating countries. While some findings from previous studies question the tenability of this assumption across all countries (e.g., Ercikan & Gonzalez, 2008) there are also studies that show the stability of cross-country comparisons based on selec-tions based on experts’ judgments of the appropriateness of the items in relation to coun-try-specific curricula (Hencke et al. 2009).
It is unreasonable to assume that all items will fit in all countries since effects of cultural differences, glitches in translations, and other factors cannot be ignored. The question becomes how much item-level misfit is tolerable, and if misfit is found that appears to have an effect on the estimation of distributions, whether and how this can be remedied. Previous research conducted using a national large-scale assessment of mathematics administered to 15 year-old students suggests that the assumption that all items in the measure function equally across all subpopulations is too strong (von Davier & Yama-moto, 2004). Findings from the study conducted by von Davier and Yamamoto (2004) suggest that rather than constraining all item parameters to be equal across the three subpopulations examined in their study, to accommodate empirical evidence that some items function differently in the components of the composite population, the difficulty and other parameters of a small subset of items should be allowed to differ across sub-populations. This approach still leaves the vast majority of items with intact equality constraints across groups. Translating this approach to international assessments adminis-tered to 60 or more countries requires that tools that allow the estimation of these types of partial constraints across multiple populations be in place.
The present study builds upon previous research which suggests that using international parameters for all the items does not always result in accurate representations of individ-ual country parameters (Cook, 2006; Ercikan & Gonzalez, 2008). Moreover, it follows guidelines established by professional standards such as the International Test Commis-sion Guidelines (ITC, 2000) and the Standards for Educational and Psychological Test-ing (American Educational Research Association [AERA], American Psychological Association [APA], National Council on Measurement in Education [NCME], & Joint Committee on Standards for Educational and Psychological Testing (U.S.), 1999), which indicate that separate score scales based upon separate country calibrations should be created if measurement invariance across diverse examinee groups cannot be established. To this end, this study will examine two research questions:
2. Does the use of a more general IRT (e.g., a three-dimensional 2 parameter-logistic) model, as compared to PISA’s use of a separate unidimensional Rasch model for each scale lead to a reduction in country-level item misfit?
To investigate these two research questions we will compare a selection of models in terms of the amount of item-misfit found, ranging from a multidimensional Rasch and multi-parameter IRT model with international item parameters to models with partially country-specific parameters and multidimensional IRT (MIRT) models that utilize coun-try-level information to guide classification into groups with the same set of item pa-rameters. This cascade of increasingly complex models is used to evaluate the expected reduction of misfit associated with selecting between the use of multi-parameter and single parameter IRT and country-specific versus international item parameters. Analyses designed to answer these research questions will be conducted using data from across 30 countries, the members of the Organization for Economic Co-Operation and Develop-ment (OECD), who participated in PISA 2006. The data collected in PISA 2006 span across the three assessed content areas: mathematics, reading and science. The develop-ment of these three content areas’ proficiency scales was conducted using the Mixed-Coefficients Multinomial Logit Model (MCMLM; Adams & Wu, 2007), an extension of the Rasch model (Rasch, 1960/1980). Previous studies suggest that the Rasch model results in less accurate estimates of fit, especially if a test contains both multiple-choice (Divgi, 1986) and constructed-response (Fitzpatrick, Link, Yen, Burket, Ito, & Sykes, 1996) items. We therefore propose the use of more flexible item response models such as the 2PL model (Lord & Novick, 1968) or multidimensional (mixture) models (von Davier, 2005; von Davier, DiBello, & Yamamoto, 2006; Mislevy, Levy, Kroopnick, & Rutstein, 2008) to the MCMLM model currently used by PISA.
data in the cognitive items as well as in the grouping variables (von Davier & Yama-moto, 2004).
About PISA
Since 1998, PISA has been designed and implemented by a consortium led by the Aus-tralian Council for Educational Research (ACER) under the direction of OECD. PISA is cooperatively managed and directed by the OECD member countries as well as an in-creasing number of non-member countries referred to as partner economies. PISA as-sesses 15-year-old students because at this age students are approaching the end of com-pulsory education in most participating countries.
PISA is conducted on a three-year cycle; the first survey took place in 2000. Each cycle assesses students in Mathematics, Science and Reading, while one area is chosen as the major domain and it is given greater emphasis, the remaining two areas are assessed as ‘minor domains’. Minor domains are assessed less thoroughly, but are carried across assessment cycles by utilizing a subset of the items dedicated to the domain that is kept intact in order to ensure linkage across cycles. In PISA 2006 the major focus was on science; in addition to the more thorough coverage of the science domain with an in-creased number of cognitive items, a number of questionnaire items aimed at exploring student attitudes to science were embedded in the cognitive part of the test.
The focus of PISA is on the assessment of students’ ability to apply the skills and knowl-edge they have acquired at school to understand, interpret or solve challenges to which they may be exposed in real-life. In addition, PISA collects information on social, cul-tural, economic and educational factors that are associated with students’ achievement by administering a 20-30 minute background questionnaire to students. Moreover, informa-tion from schools is also collected as school principals complete a short quesinforma-tionnaire regarding various aspects of organization and educational school contexts. This informa-tion is collected to facilitate a detailed study of factors within and between countries that are associated with varying levels of reading, mathematical and scientific literacy among the 15-year-old students of each country (Turner & Adams, 2007).
and background variables in LSAs can be found in Mislevy, Beaton, Kaplan & Sheehan (1992), Adams, Wu and Carstensen (2007) and von Davier, Sinharay, Oranje and Beaton (2006).
Sampling Design. A two-stage stratified sampling design was used in PISA to randomly select schools and students in each participating country. In the first stage, approximately 150 schools per country were randomly sampled using probability-proportional-to-size sampling. In the second stage, 35 eligible students were randomly sampled from within each selected school. In total, each country assessed approximately 4,500 students (Turner & Adams, 2007).
Proficiency Scale. In PISA, the Rasch model was used to develop proficiency scales and report students’ achievement. Specifically, the intention of each of the PISA scales is to measure a single underlying trait, wherein the only difference between items measuring the trait lies in their relative difficulty. That is, students responding correctly to more difficult items are seen to be located at a higher end of the scale and those responding correctly only to easier items can be placed towards the lower end of the scale continuum (Turner & Adams, 2007). The operational analysis of the PISA data was conducted with the software Conquest (Wu, Adams, Wilson, & Haldane, 2007), an implementation of the MCMLM (Adams, Wilson, & Wu, 1997), which is an extension of the Rasch model (Rasch, 1960).
Translation and Verification of Instruments. Before the PISA 2006 assessment took place, 81 national versions in 42 languages were developed, which were then adminis-tered to approximately 4,500 students in each of the 57 participating countries (Turner & Adams, 2007). Consequently, adaptation and translation procedures are an important focus of the PISA assessment. Efforts to achieve comparability include developing source versions of all materials in English and French prior to the development of na-tional versions, having each country submit their own nana-tional version, review and com-ment on the material being developed. Moreover, cognitive laboratories are conducted to field-test the material and obtain feedback from students in various countries regarding item interpretation. Statistical analyses (e.g., the use of item-by-country analyses) are also conducted to evaluate the material and detect items functioning differentially across countries (OECD, 2006).
Table 1:
List of participating OECD countries and respective three-letter country code
Australia AUS France FRA Mexico MEX
Austria AUT United Kingdom GBR The Netherlands NLD
Belgium BEL Greece GRC Norway NOR
Canada CAN Hungary HUN New Zealand NZL
Switzerland CHE Ireland IRL Poland POL
Czech Republic CZE Iceland ISL Portugal PRT
Germany DEU Italy ITA Slovak Republic SVK
Denmark DNK Japan JPN Sweden SWE
Spain ESP Korea KOR Turkey TUR
Finland FIN Luxembourg LUX United States USA
Procedures
This study sought to investigate two key research questions. One question was whether the use of a more general IRT (e.g., a three-dimensional 2PL) model, as compared to ACER’s use of a separate unidimensional Rasch model for each scale leads to a reduc-tion in item misfit. The second quesreduc-tion was whether the use of a quasi-internareduc-tional scale that includes the use of international and a subset of country-specific parameters, as compared to the use of international parameters, leads to improvement of fit, while not giving up a comparable international scale, when calibrating the data across countries. To examine these objectives we conducted a multi-stage process that consisted of four steps.
Step One: Modeling and Estimation. In the first step, we estimated five simple structure three-dimensional general diagnostic models (von Davier, 2005a; Xu & von Davier, 2006); wherein each dimension represented a single content area (science, mathematics and read-ing) and each item was associated with only one of the scales. The first two models were single-group Rasch and 2PL IRT models conducted using the joint set of data provided by the 30 countries. In this baseline model, no country differences were assumed. The next models were 30-group models utilizing three dimensional Rasch and 2PL models linked using concurrent calibration by means of the Lagrangian multiplier approach (see von Davier & von Davier, 2007), wherein the strength of the restriction of item parameters can be controlled. Thus, Rasch and 2PL models that incorporate complete parameter restriction (i.e., the use of a scale with international parameters wherein all items are assumed equal) to Rasch and 2PL models that allow for partially-unique-to-country parameters (i.e., use of a scale with large proportions of common items in conjunction with a subset of partially-unique-to-country parameters) to models without parameter constraints (other than the ones needed to remove scale indeterminacy) can be estimated. In addition, we specifically cali-brated a hierarchical extension of the 2PL MIRT model (von Davier, 2007), which extends the hierarchical latent class analysis (LCA) model (Vermunt, 2003) to a mixture 2PL IRT model using partially-unique-to-country parameters.
can estimate multiple group data or multiple populations (as in the case of estimating models using data from multiple countries) as well as enable the use of Lagrangian mul-tipliers (see, for example, Aitchison & Silvey, 1958; Glas, 1999; von Davier & von Davier, 2007) for linking using different degrees of parameter constraints. Moreover, the
mdltm software enables the specification of a Q-matrix; a design matrix specifying the association between items and skill dimensions. We used this feature to specify the scale to which each analyzed item belonged; for example, if an item was measured in the mathematics scale, then the item by skill association was signified by a 1-entry in the Q-matrix, while there are 0-entries for the reading and science scale. In so doing, we were able to estimate all available data and address some of the challenges associated with estimating data that is missing by design (i.e., matrix samples) encountered when esti-mating examinee response variables using large-scale assessments such as ILSAs. The mdltm software uses the expectation-maximization (EM) algorithm (Dempster, Laird, & Rubin, 1977) for parameter estimation. The EM algorithm can be utilized in incomplete data settings when only some variables are observed and others (e.g., latent class membership) are unobserved. The EM algorithm is less computationally intensive than alternative estimation methods such as the Markov Chain Monte Carlo (MCMC), and has also been shown to estimate the mixture distribution Rasch model (von Davier, 1994, 2001) stably without encountering multiple maxima when multiple starting values have been used (von Davier & Yamamoto, 2004).
Step Two: Evaluation of Model Fit. In the next step, we compared model fit estimates across the above mentioned models using the following indices: (1) the Akaike Informa-tion Criterion (AIC; Akaike, 1974), (2) the Bayesian InformaInforma-tion Criterion (BIC; Schwarz, 1978). The relatively best fitting model was determined using the small-est values on these indices. According to Schwarz (1978), the BIC is a minimum dis-crepancy index that penalizes the addition of model parameters with a term that depends on the sample size; in this way, the index is assumed to ensure that the model with mini-mal BIC represents the relatively best-fitting model. The penalty term of the BIC takes the sample-size into account so that over-parameterization due to large samples, which is a problem with the AIC (Akaike, 1974), is less of a problem for the BIC. The log-penalty index is obtained by dividing the AIC by the number of observations in the sample, and thus also contains a penalty term, and the average log likelihood per observation. More rigorous approaches to testing model data fit based on re-simulation and bootstrapping techniques are available (von Davier, 1997; Muthén, 2008); however, such approaches are computationally expensive and become increasingly more difficult to use with large data sets as the ones found in ILSAs.
a perfect fit of the model to the data. On the other hand, models with RMSEA > 0.1 have poor fit and should be rejected. In this study we used the RMSEA > 0.1 criterion to iden-tify poorly fitting item characteristic curves.
The last step involved examining the degree of agreement between each of these three forms of calibration and ability estimates. A high agreement of estimates (group means, correlations between ability variables) between models with and without unique item parameters would indicate a non-substantial change of group-level ability distributions; whereas substantial disagreement between model-based estimates indicates a more sig-nificant effect of ignoring the misfit.
Results
The results of this study are organized as follows. First, we present results of model com-parisons followed by results of country-by-item fit analyses. Last, we summarize results of correlations of population quantities derived from the calibration based on international parameters, versus the calibration with partially country-specific parameters.
Model Comparisons. Table 2 shows the number of parameters, log-likelihood (-2* LogLike), AIC and BIC estimates for each of the analyzed models: the first two models presented in Table 2 are the single-group three-dimensional Rasch and 2PL models. Results of the comparison of these two models using the AIC and BIC criteria and the (-2*LogLike) indicate improved fit and smaller deviance for the 2PL model. Findings associated with improved fit associated with the 2PL model are consistent with previous research (Divgi, 1986; Fitzpatrick et al., 1996). Given the improved fit of the 2PL over the Rasch model, this model was used for subsequent estimations of the 3-dimensional models shown at the bottom of Table 2 (2PL MIRT, 2PL multi-group model with inter-national parameters and 2PL multi-group model using unique country-specific parame-ters for very poorly functioning items i.e., RMSEA > 0.1). Estimations of these three models resulted in lower values in the log-likelihood, AIC and BIC fit statistics for the 3-dimensional 2PL model that allows for some unique-to-country parameters.
Table 2:
Comparison of overall fit for models sorted by number of populations & estimated parameters
Model # of pars LogLike AIC BIC
SG Rasch 203 -7669845.835 15340097.670 15342216.990 SG 2PL 396 -7586440.506 15173673.012 15177807.252 Mixture Rasch 407 -7582173.808 15165161.616 15169410.696 Mixture 2PL 793 -7534188.419 15069962.838 15078241.758 MG Rasch 493 -7649892.913 15300771.826 15305918.746 MG 2PL 686 -7568195.652 15137763.304 15144925.144 Part. unique MG 2PL 2139 -7493004.635 14990287.270 15012618.430
Table 2 also shows a mixture model with unique parameters for each of two latent popu-lations. It is interesting to note that the 2-class mixture 3-dimensional 2PL (Mixture 2PL in the table) is the second best fitting model when comparing models using the informa-tion criteria. Among all models compared, the best fitting one is the 2PL model with multiple populations and partially-unique parameters. This model is also the most com-plex contender in terms of the numbers of parameters required, while it maintains about 87%-88% of item parameters intact across countries. An IRT link that assumes on aver-age 167 out of 179 identical item parameters across countries is in terms of the con-straints needed a much stronger restriction than that required by equating methods, which is usually carried out by equating two statistics of the sample of item parameters to take on the same values, or by shifting the parameters with a 2-parameter linear function to match test characteristic curves.
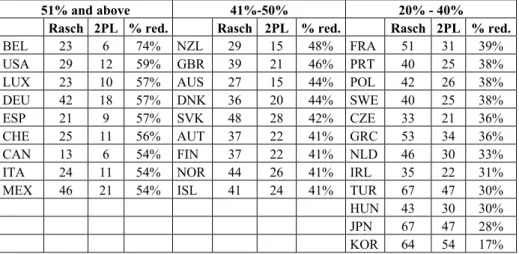
Country-by-Item Fit Statistics. Analyses of country-by-item fit statistics are presented in three exhibits. First, Table 3 presents results of country-by-item analyses conducted to examine improvement of item level fit (% reduction) associated with the use of the 2PL as compared to the Rasch model and reported for each of the 30 countries assessed by PISA. These analyses were conducted using the RMSEA > 0.1 criteria. Results shown in Table 3 indicate that improvement of fit occurred for each of the 30 countries; ranging from 17% to 74% improvement. For example, results shown in columns 2 and 3 of Table 3, illustrate that there were 23 items that showed misfit for Belgium when using the Rasch model, as compared to 6 items when using the 2PL model; similar reductions were also found in the number of misfitting items in the United States (i.e., from 29 to 12 misfitting items). Moreover, as shown by the percentage of items no longer showing misfit (column 4), there were large reductions in number of misfitting items including 74% for Belgium and 59% for the United States. This percentage was calculated by
Table 3:
Improvement of fit associated with using a 2PL versus a Rasch model for each country
51% and above 41%-50% 20% - 40%
Rasch 2PL % red. Rasch 2PL % red. Rasch 2PL % red. BEL 23 6 74% NZL 29 15 48% FRA 51 31 39% USA 29 12 59% GBR 39 21 46% PRT 40 25 38% LUX 23 10 57% AUS 27 15 44% POL 42 26 38% DEU 42 18 57% DNK 36 20 44% SWE 40 25 38% ESP 21 9 57% SVK 48 28 42% CZE 33 21 36% CHE 25 11 56% AUT 37 22 41% GRC 53 34 36% CAN 13 6 54% FIN 37 22 41% NLD 46 30 33% ITA 24 11 54% NOR 44 26 41% IRL 35 22 31% MEX 46 21 54% ISL 41 24 41% TUR 67 47 30%
HUN 43 30 30%
JPN 67 47 28%
KOR 64 54 17%
subtracting the number of misfitting items using PISA’s original calibration model from the 2PL model (i.e., for Belgium there were 23 items using the Rasch model subtracted from 6 using the 2PL model) divided by the total number of misfitting items using the Rasch model (i.e., 23).
We also conducted analyses to examine the proportion of items that had improvement of fit across countries using a 2PL versus a Rasch model. Results presented in Table 4 show five items that had the greatest reduction of misfit; all of these items are in the science content area. To illustrate, item “S521Q02” showed improved fit for 90% of countries (i.e., 3 as compared to 29 countries; see column 4) when a 2PL (column 3) instead of a Rasch model (column 2) was used for item calibration. This type of reductions in the number of countries for which items misfit may lead to lower rates of item deletions. Second, analyses of item level misfit were conducted to investigate proportion of misfit for each of the three content areas assessed by PISA. Results of our analyses indicate that reading had the highest proportion of items (18%), science had the second largest proportion (14%) and mathematics had the least (8%). This finding of a higher propor-tion of misfit for the reading scale is consistent with previous research, which suggests that reading literacy depends on the quality of translations and other factors more than international comparisons using translated mathematics and science items (Grisay, Gon-zalez, & Monseur, 2008).
Third, analyses were conducted to examine the proportion of items in each of the 30 countries that had misfit (RMSEA > 0.1); these items were used in the calibration of the
quasi-international scale, wherein the majority of items were common international parameters and the proportion of items shown in Table 5 were unique-to-country pa-rameters. Results shown in Table 5 are arranged by order of countries having the least proportion of items with RMSEA > 0.1 (e.g., Canada and Belgium with 3% of misfitting items; see columns 1-3) to the countries having the greatest proportion of misfitting items (e.g., Korea with 30% of misfitting items; see columns 10-12). These results indicate that in the calibration of the quasi-international scale, over 80% of items were common across countries for a large proportion (90%) of countries. These results highlight the benefits of using a quasi-international scale that can be developed utilizing a majority of common items and a minority of unique-country parameters.
Table 4:
Improvement of item fit using a 2PL versus a Rasch model
# and % of countries for which item had RMSEA > 0.1
Item
Rasch model 2PL model
% of countries for which item no longer
showed misfit
S521Q02 29 (97%) 3 (10%) 90%
S519Q02T 23 (77%) 4 (13%) 83%
S527Q03T 22 (73%) 6 (20%) 73%
S466Q05 25 (83%) 10 (33%) 60%
Table 5:
Number and percentage of unique-country parameters (out of total of 179 items)
Below 10% 10% to 14% 15% to 20% Above 20%
AUS 15 8% SWE 25 14% GRC 34 19% KOR 54 30% NZL 15 8% PRT 25 14% FRA 31 17% JPN 47 26% USA 12 7% ISL 24 13% NLD 30 17% TUR 47 26%
CHE 11 6% AUT 22 12% HUN 30 17%
ITA 11 6% FIN 22 12% SVK 28 16%
LUX 10 6% IRL 22 12% POL 26 15%
ESP 9 5% MEX 21 12% NOR 26 15%
BEL 6 3% GBR 21 12%
CAN 6 3% CZE 21 12%
DNK 20 11%
DEU 18 10%
Moreover, results of these analyses indicate that three countries (Korea, Japan and Tur-key) have above 25% misfitting items. These results are consistent with previous re-search (Grisay et al., 2008), which show that national versions of PISA 2000 and PIRLS 2001 assessments translated into non-Indo European languages (e.g., Chinese, Japanese, Korean and Turkish) had the highest proportions of DIF. Similarly, a previous study conducted using PISA 2001 (Grisay & Monseur, 2007) also found lower item equiva-lence in item difficulty across Asian countries (e.g., Japan, Korea and Hong Kong).
Agreement of country mean estimates across the three PISA domains. In order to assess the effect of using partially-unique parameters, we conducted a comparison of country mean estimates for the three PISA scales: Science, Mathematics and Reading. Recall that the Science scale was the major domain in PISA 2006, represented by more than 100 items among the 178 items used in this study. Recall also that the number of misfitting items was smaller in Science and Mathematics compared to the Reading scale. The fol-lowing Figure 1 depicts a comparison between country means obtained for the Science scale with all international parameters, versus partially-unique parameters. The correla-tion between the estimates across the 30 OECD countries is > 0.997.
Figure 2 shows the agreement between country means estimated for the Reading scale using either all international parameters, or partially country-specific parameters. The correlation between these estimates is > 0.987.
Figure 3 shows the agreement between country means estimated for the Mathematics scale using either all international parameters, or partially country-specific parameters. The correlation between these estimates is > 0.997.
Figure 1:
Correlation of Country Mean Estimates based on International and Partially-Unique Item Parameters in Science
Figure 2:
Figure 3:
Correlation of Country Mean Estimates based on International and Partially-Unique Item Parameters in Mathematics
of the big picture, the country results will be affected only to a very small extent by moving from a model with all international item parameters to a model that improves within country fit by allowing a subset of items to carry country specific parameters.
Conclusions
between reducing item misfit and maintaining model parsimony by assuming unique parameters only if there is sufficient evidence that an item functions differently from the international ‘average’ in one or more countries.
Given the key decisions for which international LSAs are used, an examination of cur-rent approaches to obtain comparable and accurate estimates of students’ abilities is important. To this end, this study sought to examine two questions. That is, whether using a more general IRT (2PL) model will help reducing item-level misfit associated with the currently used MCMLM model and whether a quasi-international scale that includes the use of high proportions of international (common) parameters and a subset of unique-to-country parameters can be used for comparisons. Our analyses indicate that the use of a more general 2PL model leads to improved fit (see Table 2, and Tables 3 and 4 for improvement of global fit and item-level fit estimates, respectively). Similarly, our results indicate that we obtain improved fit with the use of a scale that allows a small number of unique-to-country parameters while maintaining on average 80% or more international parameters per country as compared to a scale using solely international parameters (see Table 2); moreover, our results indicate that this alternative procedure leads to proficiency scales defined by a set of item parameters with a substantially re-duced proportion of misfit.
A main contribution of this study is that it empirically examines an array of models to estimate an internationally comparable scale for PISA data. These explorations enabled us to assess model data fit utilizing a range of extensions of multidimensional models and identifies specific ways in which current methods utilizing extensions of the Rasch model can be improved to obtain more accurate estimates of population characteristics by im-proving model-data fit. The proposed approach also enables using a model and estima-tion procedure that can be conjectured to improve confidence regarding the measurement of students’ abilities across countries by minimizing the number of items that expose misfit in international comparisons. In particular, based upon our results we propose the use of a more general 2PL model for item calibration. We also recommend the use of a quasi-international scale that involves a large number of parameters common to all coun-tries, yet allows for some unique-to-country parameters for very poorly fitting items (i.e., RMSEA > 0.1). This procedure has to our knowledge not yet been examined with inter-national assessments such as PISA. The approach presented herein is not dissimilar to approaches described in Yamamoto & Kirsch (1998) and in von Davier & Yamamoto (2004). A quasi-international scale may be preferable as well to the use of proficiency scales that are individual for each country. Country-specific scales would require partici-pating countries to collect larger samples to reduce standard errors associated with item parameters.
item difficulties within language groups (e.g., different versions administered in German) such studies should be conducted using groups of test versions in a specific language (Grisay et al., 2008).
Further studies should be considered using models that incorporate developments in IRT to identify hierarchical dependencies among subsets of items. Such model extensions may provide a framework wherein different sources of DIF may be disentangled. For instance, multi-level IRT (Kamata & Cheong, 2007; Park & Bolt, 2008) as well as hier-archical multidimensional diagnostic models (von Davier, 2007) can be used to decom-pose item responses across several levels (item, unit, student and country), which enables identification of common patterns underlying examinees’ item responses.
References
Adams, R. J., Wilson, M., & Wu, M. (1997). Multilevel item response models: An approach to errors in variables regression. Journal of Educational and Behavioral Statistics, 22(1), 47-76.
Adams, R. & Wu. M. (2007). The mixed-coefficients multinomial logit model: A generalized form of the Rasch model. In M. von Davier & C. H. Carstensen: Multivariate and mixture distribution Rasch models: Extensions and applications (pp. 57-76). New York: Springer. Adams, R., Wu. M, & Carstensen, C. H. (2007). Application of multivariate Rasch models in
international large-scale educational assessments. In M. von Davier & C. H. Carstensen: Multivariate and mixture distribution Rasch models: Extensions and applications (pp. 271-280). New York: Springer.
Aitchison, J., & Silvey, S. D. (1958). Maximum likelihood estimation of parameters subject to restraints. Annals of Mathematical Statistics, 29, 813-829.
Akaike, H. (1974). A new look at the statistical model identification. IEEE Transactions on Automatic Control, 19 (6), 716-723.
Allalouf, A. (2003). Revising Translated DIF Items as a Tool for Improving Cross-Lingual Assessment.Applied Measurement in Education, 16, 55-73
American Educational Research Association, American Psychological Association, National Council on Measurement in Education, & Joint Committee on Standards for Educational and Psychological Testing (1999). Standards for educational and psychological testing. Washington DC: American Educational Research Association.
Bock, R. D., & Zimowski, M. F. (1997). Multiple group IRT. In W. J. van der Linden & R. K. Hambleton (Eds.), Handbook of modern item response theory. New York: Springer-Verlag.
Divgi, D. R. (1986). Does the Rasch model really work for multiple choice items? Not if you look closely. Journal of Educational Measurement, 23 (4), 283-298.
Ercikan, K. (2002). Disentangling sources of differential item functioning in multilanguage assessments. International Journal of Testing, 4, 199-215.
Ercikan, K., & Gonzalez, E. (2008, March).Score scale comparability in international as-sessments. Paper presented at the annual meeting of the National Council on Measure-ment in Education, New York, USA.
Ercikan, K., & Koh, K. (2005). Construct Comparability of the English and French versions of TIMSS. International Journal of Testing, 5, 23-35.
Fitzpatrick, A. R., Link, V. B., Yen, W. M., Burket, G. R., Ito, K., & Sykes, R. C. (1996). Scaling Performance assessments: A comparison of one-parameter and two-parameter partial credit models. Journal of Educational Measurement, 33 (3), 291-314.
Gierl, M. J., & Khaliq, S. N. (2001). Identifying sources of differential item and bundle func-tioning on translated achievement tests: a confirmatory analysis. Journal of Educational Measurement, 38 (2), 164-187.
Gilula, Z., & Haberman, S. J. (1994). Conditional log-linear models for analyzing categorical panel data. Journal of the American Statistical Association, 89, 645-656.
Glas, C. A.W. (1999). Modification indices for the 2-PL and the nominal response model. Psychometrika, 64, 273-294.
Grisay, A., Gonzalez, E., & Monseur, C. (2009). Equivalence of item difficulties across national versions of the PIRLS and PISA reading assessments. In M. von Davier & D. Hastedt (Eds.), IERI monograph series: Issues and methodologies in large scale assess-ments, Vol. 2.
Grisay, A., & Monseur, C. (2007). Measuring the equivalence of item difficulty in the various versions of an international test. Studies in Educational Evaluation, 33 (1), 69-86. Hencke, J., Rutkowski, L., Neuschmidt, O., & Gonzalez, E. (2009). Curriculum coverage and
scale correlation on TIMSS 2003. In M. von Davier & D. Hastedt (Eds.), IERI mono-graph series: Issues and methodologies in large scale assessments, Vol. 2.
ITC (2000). ITC Guidelines for adaptation. Retrieved on December 20 from: http://www. intestcom.org/test_adaptation.htm
Kamata, A., & Cheong, F. (2007). Multilevel Rasch model. In M. von Davier & C. H. Car-stensen (Eds.), Multivariate and mixture distribution Rasch models: Extensions and ap-plications (pp. 217–232). New York: Springer.
Kelderman, H., & Macready, G. B. (1990). The use of loglinear models for assessing differ-ential item functioning across manifest and latent examinee groups. Journal of Educa-tional Measurement, 27, 307-327.
Lord, F. M. & Novick, M. R. (1968). Statistical theories of mental test scores. Reading MA: Addison-Wesley Publishing Company.
Mislevy, R. J., Levy, R., Kroopnick, M., & Rutstein, D. (2008). Evidentiary foundations of mixture item response theory models. In G. R. Hancock & K. M. Samuelsen (Eds.), Ad-vances in latent variable mixture models (pp. 149-175). Charlotte, NC: Information Age Publishing.
Mislevy, R. J., & Verhelst, N. (1990). Modeling item responses when different subjects em-ploy different solution strategies. Psychometrika, 55, 195-215.
Muthén, B. (2008). Latent variable hybrids. In G. R. Hancock & K. M. Samuelsen (Eds.), Advances in latent variable mixture models (pp. 1-24). Charlotte, NC: Information Age Publishing.
Organization for Economic Co-Operation and Development (2006). PISA 2006 technical report. Retrieved on February 15from: http://www.oecd.org/document.html
Park, C., & Bolt, D. M. (2008). Application of multi-level IRT to investigate cross-national skill profiles on TIMSS 2003. IERI monograph series: Issues and methodologies in large-scale assessments (Vol. 1, pp. 71-96). Hamburg/Princeton NJ: IEA-ETS Research Insti-tute.
Rasch, G. (1960). Probabilistic models for some intelligence and attainment tests. Chicago: University of Chicago Press.
Rost, J. (1990). Rasch models in latent classes: An integration of two approaches to item analysis. Applied Psychological Measurement, 14, 271-282.
Rutkowski, L., Gonzalez, E., Joncas, M., & von Davier, M. (2010).International large-scale assessment data: Issues in secondary analysis and reporting. Educational Researcher, Vol. 39, no X, March 2010.
Schwarz, G. (1978). Estimating the dimension of a model. The Annals of Statistics, 6, 461-464.
Smit, J. A., Kelderman, H., & Van der Flier, H. (2000). The mixed Birnbaum model: Estima-tion using collateral informaEstima-tion. Methods of Psychological Research Online, 5, 1-13. Steiger, J. H. (1990). Structural model evaluation and modification: An interval estimation
approach. Multivariate Behavioral Research, 25, 173-180.
Turner, R., & Adams, R. J. (2007). The programme for international student assessment: An overview. Journal of Applied Measurement, 8 (3), 237-248.
Vijver, F. J. R. van de, & Tanzer, N. K. (2004). Bias and equivalence in cross-cultural as-sessment: an overview. European Review of Applied Psychology, 54 (2), 119-135. Vermunt, J. K. (2003). Multilevel latent class models. Sociological Methodology, 33,
213-239.
von Davier, M. (1994) WINMIRA – A Windows-Program for Analyses with the Rasch Model, with the Latent Class Analysis and with the Mixed Rasch Model, IPN Software, Institute for Science Education, Kiel, Germany.
von Davier, M. (2001) WINMIRA 2001 – A Windows-Program for Analyses with the Rasch Model, with the Latent Class Analysis and with the Mixed Rasch Model. Software: As-sessment Systems Corporation.
von Davier, M. (2005a). A General Diagnostic Model Applied to Language Testing Data. Research Report RR-05-16. ETS: Princeton, NJ.
von Davier, M. (2005b). mdltm: Software for the general diagnostic model and for estimating mixtures of multidimensional discrete latent traits models [Computer software]. Prince-ton, NJ: ETS.
von Davier, M. (2007). Hierarchical General Diagnostic Models. Research Report, RR-07-19. ETS: Princeton, NJ.
von Davier, M., DiBello, L., & Yamamoto, K. Y. (2006). Reporting test outcomes with mod-els for cognitive diagnosis (ETS Research Rep. No. RR-06-28). Princeton, NJ: ETS. von Davier, M., & Rost, J. (1995). Polytomous mixed Rasch models. In G. H. Fischer & I. W.
Molenaar (Eds.), Rasch models. Foundations, recent developments, and applications (pp. 371-379). New York: Springer.
von Davier, M. Sinharay, S., Oranje, A., & Beaton, A. (2006)Statistical procedures used in the National Assessment of Educational Progress (NAEP): Recent developments and fu-ture directions.In C.R. Rao & S. Sinharay (Eds.), Handbook of Statistics (Vol. 26): Psy-chometrics. Amsterdam: Elsevier.
von Davier, M., & von Davier, A. (2007). A Unified Approach to IRT Scale Linkage and Scale Transformations. Methodology, 3 (3), 115-124.
von Davier, M., & Yamamoto, K. (2004). Partially Observed Mixtures of IRT Models: An extension of the Generalized Partial Credit Model. Applied Psychological Measurement, 28 (6), 389-406.
Wu, M. L., Adams, R. J., Wilson, M. R., & Haldane, S. (2007). ACER ConQuest 2.0: Gen-eral item response modelling software [computer program manual]. Camberwell, VIC: ACER Press.
Xu, X., & von Davier, M. (2006). Cognitive Diagnosis for NAEP proficiency data. Research Report, RR-06-08. ETS: Princeton, NJ.