BGD
6, 1945–1978, 2009Model and validation of regional energy balance partitioning
F. Miglietta et al.
Title Page
Abstract Introduction
Conclusions References
Tables Figures
◭ ◮
◭ ◮
Back Close
Full Screen / Esc
Printer-friendly Version
Interactive Discussion Biogeosciences Discuss., 6, 1945–1978, 2009
www.biogeosciences-discuss.net/6/1945/2009/ © Author(s) 2009. This work is distributed under the Creative Commons Attribution 3.0 License.
Biogeosciences Discussions
Biogeosciences Discussionsis the access reviewed discussion forum ofBiogeosciences
Sensible and latent heat flux from
radiometric surface temperatures at the
regional scale: methodology and
validation
F. Miglietta1, B. Gioli1, Y. Brunet2, R. W. A. Hutjes3, A. Matese1, C. Sarrat4, and A. Zaldei1
1
IBIMET-CNR, Istituto di Biometeorologia, Consiglio Nazionale delle Ricerche, Via G. Caproni 8, 50145 Firenze, Italy
2
INRA, UR 1263 EPHYSE, BP 81, 33833 Villenave d’Ornon cedex, France
3
Alterra Greenworld, Duivendaal 2, 6700 AA Wageningen, The Netherlands
4
CNRM-GAME, M ´et ´eo-France, 42 avenue G. Coriolis, 31057 Toulouse, France
Received: 7 January 2009 – Accepted: 15 January 2009 – Published: 10 February 2009
Correspondence to: F. Miglietta ([email protected])
BGD
6, 1945–1978, 2009Model and validation of regional energy balance partitioning
F. Miglietta et al.
Title Page
Abstract Introduction
Conclusions References
Tables Figures
◭ ◮
◭ ◮
Back Close
Full Screen / Esc
Printer-friendly Version
Interactive Discussion
Abstract
The CarboEurope Regional Experiment Strategy (CERES) was designed to develop and test a range of methodologies to assess regional surface energy and mass ex-change of a large study area in the south-western part of France. This paper describes a methodology to estimate sensible and latent heat fluxes on the basis of net radi-5
ation, surface radiometric temperature measurements and information obtained from available products derived from the Meteosat Second Generation (MSG) geostationary meteorological satellite, weather stations and ground-based eddy covariance towers. It is based on a simplified bulk formulation of sensible heat flux that considers the de-gree of coupling between the vegetation and the atmosphere and estimates latent heat 10
as the residual term of net radiation. Estimates of regional energy fluxes obtained in this way are validated at the regional scale by means of a comparison with direct flux measurements made by airborne eddy-covariance. The results show an overall good matching between airborne fluxes and estimates of sensible and latent heat flux ob-tained from radiometric surface temperatures that holds for different weather conditions 15
and different land use types. The overall applicability of the proposed methodology to regional studies is discussed.
1 Introduction
Regional scale studies aimed at assessing mass and energy exchange between the surface and the atmosphere are important for improving current understanding of bio-20
geochemical cycles (Dolman et al., 2005). Regional flux estimations require the avail-ability of surface properties data, proper methodologies to scale from point and spatial observations to the region, and reliable methods to validate the results. One of the aims of the CarboEurope Regional Experiment Strategy (CERES) is to develop and test a range of methodologies to assess regional surface energy and mass exchange 25
BGD
6, 1945–1978, 2009Model and validation of regional energy balance partitioning
F. Miglietta et al.
Title Page
Abstract Introduction
Conclusions References
Tables Figures
◭ ◮
◭ ◮
Back Close
Full Screen / Esc
Printer-friendly Version
Interactive Discussion Surface energy balance of vegetated surfaces is controlled by a series of processes
occurring at different scales (Dirmeyer, 1994; Seth and Giorgi, 1996): (i) the organs (leaves) that exert a control on transpiration through stomatal regulation and affect net radiation by absorbing part of the photosynthetic active radiation, (ii) the canopy whose geometry and architecture controls the aerodynamic resistance and the air-surface 5
coupling (Jarvis and McNaughton, 1986), and (iii) the atmosphere that drives advec-tion, turbulence and the surface energy balance by controlling the amount of energy reaching the surface. The idea of closing the surface energy balance of vegetated surfaces (i.e. partitioning the measured net radiation into its components: sensible, la-tent and soil heat fluxes) on the basis of surface temperature measurements has been 10
proposed more than three decades ago (Monteith, 1973; Jackson et al., 1977). Since then, a number of studies have been performed and several methodologies have been suggested, including some dedicated models like TSEB (Norman et al., 1995), SEBAL (Bastiaanssen et al., 1995), SEBI (Roerink et al., 2000), and others (Vidal and Perrier, 1989; Choudhury and DiGirolamo, 1998; Granger, 2000; Boegh et al., 2002; Boegh 15
and Soeegrad, 2004; Crow et al., 2005).
One of the most critical aspects of all bulk formulations of sensible heat fluxH used in these studies is the difference between the radiometric and aerodynamic tempera-tures of the surface. The aerodynamic temperature is the air temperature extrapolated from some level in the surface layer down to the roughness length for heat, using the 20
temperature profile deduced from Monin-Obukhov similarity theory. The radiometric temperature is the canopy foliage temperature measured by thermal infrared remote sensing and averaged over the field of view of the thermometer. The advantage of using radiometric temperature is obvious as such information may be readily available over large areas by means of infrared remote sensing with aircraft or satellites.
25
BGD
6, 1945–1978, 2009Model and validation of regional energy balance partitioning
F. Miglietta et al.
Title Page
Abstract Introduction
Conclusions References
Tables Figures
◭ ◮
◭ ◮
Back Close
Full Screen / Esc
Printer-friendly Version
Interactive Discussion and dry or water-stressed vegetation (Kalma and Jupp, 1990). A number of solutions
have been proposed either to find a relationship between radiometric and aerodynamic temperatures or to account for the difference between them by introducing additional atmospheric resistance terms to heat transfer equations (Colaizzi et al., 2004). One of the most classical approaches involves the determination of the ratio between the 5
roughness length for momentum and the roughness length for heat (often referred to askB−1). However it has been shown in several occasions that since this term varies
with vegetation structure, density and weather conditions (Troufleau et al., 1997), only complex models can actually be used to predictkB−1(Massman, 1999). An alternative
approach was proposed by Boegh et al. (2004), who used an estimate of the degree 10
of coupling between the vegetation and the atmosphere to calculate vapour pressure at the surface and then derive an estimate of the additional atmospheric resistance.
One of the limits in common to all those methodologies is the possibility to validate experimentally the results. Validations based either on independent measurements of latent heat fluxes by lysimeters (Colaizzi et al., 2004) or on direct measurements of sen-15
sible and latent heat fluxes by eddy covariance (Boegh et al., 2004) cannot in fact take into account the large spatial variability of the fluxes that occurs at the regional scale. However the recent advent of a new generation of small research aircraft capable of measuring concurrently surface radiometric temperature and sensible and latent heat fluxes over large areas (Crawford et al., 1996) offers a new tool for such validation. 20
This type of aircraft is capable of making accurate energy exchange measurements while flying at low altitude over a region (Gioli et al., 2004). This provides crucial infor-mation on spatial patterns of latent and sensible heat fluxes that may finally be used for the validation of more indirect and readily applicable regional scale methodologies (Miglietta et al., 2007) as well as for the validation of regional surface fluxes modelling 25
frameworks (Sarrat et al., 2009).
Genera-BGD
6, 1945–1978, 2009Model and validation of regional energy balance partitioning
F. Miglietta et al.
Title Page
Abstract Introduction
Conclusions References
Tables Figures
◭ ◮
◭ ◮
Back Close
Full Screen / Esc
Printer-friendly Version
Interactive Discussion tion (MSG) geostationary meteorological satellite, weather stations and ground-based
eddy covariance towers. It is based on a simplified bulk formulation of sensible heat flux based on the work of Boegh et al. (2004), that considers the degree of coupling between the vegetation and the atmosphere and estimates latent heat as the resid-ual term of net radiation. The methodology was applied using data collected during 5
CERES in a study area in the south-west of France, in late spring and early summer 2005. Estimates of regional energy fluxes were validated at the proper scale by means of a comparison with direct flux measurements made by a Sky Arrow ERA (Environ-mental Research Aircraft) equipped with an airborne eddy-covariance system. The overall applicability of the proposed methodology to regional studies is discussed. 10
2 Materials and methods
2.1 The CERES study region
The CarboEurope Regional Experiment Strategy (CERES) is a pan European initiative aiming to produce aggregated regional estimates of the energy and carbon balance of a region, using atmospheric data at high spatial and temporal resolution, as well as 15
models (Dolman et al., 2006). For this, a strategically focussed regional field experi-ment was performed in south-west France in May and June 2005 with the objective of making both concentration measurements within and above the boundary layer and to couple those via a modelling/data assimilation framework to the flux measurements at the surface and within the boundary layer. The CERES region, in the south-western 20
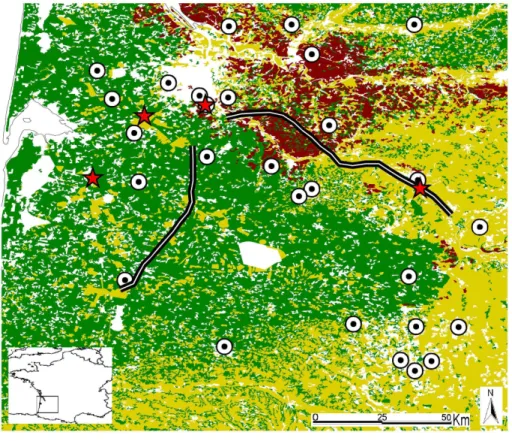
part of France, was instrumented with ground and air based measurements. The ex-perimental domain covers an area of about 250 by 150 km, and is bounded to the West by the Atlantic Ocean. The western half of the domain is dominated by the Landes forest (Fig. 1), mainly composed of pines (Pinus pinaster) plantations, managed as a commercial forest, with regular harvests and rotations. The other major landscape 25
BGD
6, 1945–1978, 2009Model and validation of regional energy balance partitioning
F. Miglietta et al.
Title Page
Abstract Introduction
Conclusions References
Tables Figures
◭ ◮
◭ ◮
Back Close
Full Screen / Esc
Printer-friendly Version
Interactive Discussion with the exception of the large “Bordeaux” vineyards, mostly east and north of the city
of Bordeaux. Both agricultural and forest land use is located on relatively flat areas, whereas the rest of the domain is mainly composed of gentle hills.
2.2 Airborne measurements
The Sky Arrow ERA (Environmental Research Aircraft) is a certified small aircraft 5
equipped with sensors to measure three-dimensional wind and turbulence together with gas concentrations and other atmospheric parameters at high frequency (Gioli et al., 2004). It has been used in this study to measure surface fluxes by airborne eddy covariance as well as air temperature and pressure, surface albedo, net radiation and radiometric surface temperature.
10
Flux measurements are made by the Mobile Flux Platform (MFP) which measures the velocity of air with respect to aircraft using a hemispheric 9-hole pressure sphere (Crawford and Dobosy, 1992). The actual wind components (horizontal U, V and vertical W) relative to the ground are calculated by introducing corrections for three-dimensional velocity, pitch, roll and heading of the aircraft made using a combination of 15
GPS velocity measurements and data from two sets of three orthogonal accelerome-ters mounted at the centre of gravity of the aircraft and in the centre of the hemisphere. The probe is equipped with a fast-response thermocouple that measures air tempera-ture with a response time of 0.02 s. Atmospheric densities of carbon dioxide and water vapour are sampled and recorded at 50 Hz by a LiCor 7500 (LiCor, Lincoln, Nebraska) 20
open-path infrared gas analyzer installed on the aircraft nose. Flux calculations are per-formed using the conventional eddy-covariance technique, and taking into account all the necessary corrections for open-path gas analyzers and aircraft motion. A detailed description of the flux computation procedure can be found in Gioli et al. (2004). Mea-surements of radiometric surface temperatures were made using a downward looking 25
BGD
6, 1945–1978, 2009Model and validation of regional energy balance partitioning
F. Miglietta et al.
Title Page
Abstract Introduction
Conclusions References
Tables Figures
◭ ◮
◭ ◮
Back Close
Full Screen / Esc
Printer-friendly Version
Interactive Discussion emissivity of the surface was inferred from literature data for pine forests, vineyards,
bare soil and irrigated crops, and was assumed to be equal to 0.985 (Hewison, 2001), 0.94 (Vall-llossera et al., 2003), 0.986 (Coll et al., 2002), 0.92 (Schmugge et al., 1991), for the four land cover types, respectively.
Incoming and reflected Photosynthetic Photon Flux Densities (PPFD) were mea-5
sured by an upward and a downward looking PPFD sensors (LI190, LiCor USA). Net radiation (Rn) was measured by a sensor placed on the tail of the aircraft (Q*7, REBS USA). Both incoming PPFD andRndata were cosine corrected on the basis of attidude angles of the aircraft that were measured using a vectorial, four antennas GPS.
The airborne campaign of CERES was made between 16 May and 26 June 2005. 10
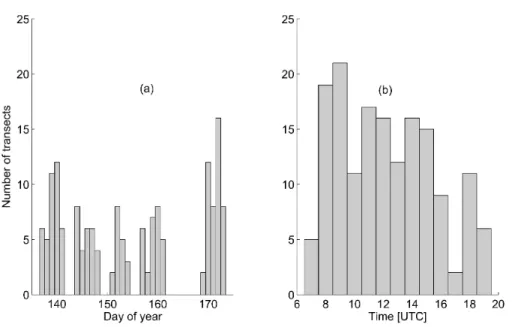
During this period, the aircraft operated fifty-four flights of approximately 2 h each that were repeated along two main tracks illustrated in Fig. 1. Western track was designed to go across the Landes pine forest, while eastern track crossed vineyard-dominated land use in its first half and maize-dominated arable land in its second half. All flights were made during five Intensive Observation Periods (IOP), at different times of the 15
day under both overcast and clear sky conditions. All flights were made at low altitude, ranging from 80 to 100 m above the surface. The overall distribution of the flights during the CERES campaign days and during the various times of the day is reported in Fig. 2. Flux measurements with airborne eddy covariance requires turbulent statistics to be computed over a proper distance, or in other words over a proper space window 20
capable of accounting for low frequency flux-carrying eddies. Based on cospectral analysis (Desjardins et al., 1989), this length was chosen to be equal to 4 km in the present study. This means that each individual flux data is associated with a flight segment of 4 km. In order to match flux measurements with airborne determinations of net radiation and radiometric temperature, the latter data originally sampled at high 25
frequency were also averaged over the same segments.
BGD
6, 1945–1978, 2009Model and validation of regional energy balance partitioning
F. Miglietta et al.
Title Page
Abstract Introduction
Conclusions References
Tables Figures
◭ ◮
◭ ◮
Back Close
Full Screen / Esc
Printer-friendly Version
Interactive Discussion is driven by the exchanges occurring at the surface and at the entrainment/subsidence
zone of the Planetary Boundary Layer (PBL). In convective situations, the sensible heat flux at the surface has always a positive sign while, very often, a negative heat flux may be observed at the entrainment (Stull, 1988). In general, assuming that the vertical variation ofH is linear (Driedonks and Tennekes, 1984; Senffet. al., 1994), the 5
rate of change inH with height depends on the height of the boundary layer and on the difference between the virtual temperature of the PBL and that of the free troposphere. In this study extrapolation of the sensible heat flux measured at the flight height to the surface was made assuming a constant ratio of 0.2 between the sensible heat flux at the surface and at the entrainment height (Stull, 1988):
10
K =−He/H0=0.2 (1)
whereHe is the flux at the entrainment height and H0 the flux at the surface that is
estimated from the airborne measured fluxes at the height of the flight, i.e. 100 m above the ground, assuming a linear vertical variation inH:
H0=(ziHa)/(zi−(1+K)za) (2)
15
whereza is the altitude at which the flux is actually measured (i.e. the flight altitude above the ground),zi is the height of the PBL,K the ratio between sensible heat flux at the surface and at the entrainment height, andHa the sensible heat flux measured at heightza.
In general, the flight strategy consisted in repeating twice a forest or an agricultural 20
transect. A vertical profile was flown between the two transects, and a standardized method was applied to determine the capping inversion of the PBLzi (Rampanelli and Zardi, 2004). Briefly, the method uses a smooth test curve approach and relationships between the mathematical parameters defining the curve and the measured physical variables defining the PBL. Whenever a vertical profile was not available, the flux diver-25
BGD
6, 1945–1978, 2009Model and validation of regional energy balance partitioning
F. Miglietta et al.
Title Page
Abstract Introduction
Conclusions References
Tables Figures
◭ ◮
◭ ◮
Back Close
Full Screen / Esc
Printer-friendly Version
Interactive Discussion 2.3 Satellite based measurements
Products based on the Meteosat Second Generation (MSG) satellite have been used in this study, once processed and made available by Eumetsat trough the Land Surface Analysis Satellite Applications Facility (LSA SAF). Land Surface Temperature (product name: LST) is the radiometric surface temperature over land, and is provided at 15-min 5
time resolution in clear sky conditions. Extensive validation of this product can be found in Trigo et al. (2008). Downwelling Surface Short-wave radiation Flux (product name: DSSF) is the radiative energy reaching the surface in the short wave spectral interval (0.3–4.0 µm), provided at 30-min time resolution. Downwelling Surface Longwave radi-ation Flux (product name: DSLF) is the irradiance reaching the surface in the thermal 10
infrared spectral interval (4–100 µm), provided at 30-min time resolution. Land surface albedo (product name: AL) is computed on a daily basis. More information on the prod-ucts and the retrieval algorithms can be found at LSA SAF (https://landsaf.meteo.pt). All products are processed and distributed at the same spatial resolution of the satellite platform, i.e. approximately 5 km over the study area.
15
Net radiation based on MSG satellite data has been derived from the shortwave and longwave incoming radiation, and surface albedo as:
Rn=(DSSF+DSLF)×(1−AL) (3)
2.4 Ground-based measurements
Ground-based measurements used in this study include water, energy and CO2fluxes 20
that were obtained using the eddy-covariance technique at flux stations and weather measurements performed in a network of meteorological stations. Basic instrumenta-tion and methods used in the flux stainstrumenta-tions have been standardised throughout the Eu-roflux and CarboEurope network (Aubinet et al., 2000). In brief, each eddy-covariance (EC) system consists of a 3-D sonic anemometer coupled with an open- or close-25
BGD
6, 1945–1978, 2009Model and validation of regional energy balance partitioning
F. Miglietta et al.
Title Page
Abstract Introduction
Conclusions References
Tables Figures
◭ ◮
◭ ◮
Back Close
Full Screen / Esc
Printer-friendly Version
Interactive Discussion CERES and four out of these nine stations were actually used in the present study.
These stations were located in Le Bray (44◦43′2′′N, 0◦46′9′′W) over a pine forest of
approximately 25 m height, in Couhins (44◦45′10′′N, 0◦33′34′′W) over a vineyard, in
Marmande (44◦27′N, 0◦11′E) over a maize crop that was planted in May and in Bilos
(44◦31′18′′N, 0◦53′45′′W) over a fallow with young pine seedlings. The geographical
5
location of those towers is shown in Fig. 1. Half-hourly flux measurements were made at each tower, along with a number of ancillary measurements such as incoming and reflected shortwave and longwave radiation, soil heat flux, soil temperature. Quality controls were made on the flux data as prescribed by Foken et al. (2004).
Air temperature, air humidity, wind speed and direction were measured on a hourly 10
basis by 28 automatic weather stations of the M ´et ´eo-France network. The geograph-ical distribution of these stations is shown in Fig. 1. Hourly data collected there were spatially interpolated by kriging to provide a database that could be used to calculate the approximate value of each parameter at the position and the passage time of the aircraft.
15
2.5 Bulk formulation of sensible heat flux from radiometric temperatures
In a bulk formulation, sensible heat flux can be assumed to be given by
H =ρCp(Ts−Ta)/rae (4)
whereρ and Cp are the density and specific heat of the moist air at the ground, Ts
is the radiometric surface temperature (◦C), T
a is the air temperature at the ground 20
level (◦C), andr
ae (s m−1) is the total resistance, given by the sum of the aerodynamic resistanceraand the additional resistance term that links radiometric and aerodynamic temperaturesrex. Radiometric temperatureTs can be obtained from several sources, including satellite imagery (Trigo et al., 2008). In the specific case of our study,Tswas directly measured by the aircraft and averaged over the same space window as that 25
BGD
6, 1945–1978, 2009Model and validation of regional energy balance partitioning
F. Miglietta et al.
Title Page
Abstract Introduction
Conclusions References
Tables Figures
◭ ◮
◭ ◮
Back Close
Full Screen / Esc
Printer-friendly Version
Interactive Discussion interpolation using kriging to produce an hourly gridded map of air temperature at 1 km
resolution. Linear time interpolation was also necessary to estimate temperature at the time and location of each airborne measured flux. OnceH is determined, latent heat fluxλE can be calculated according to:
λE =(ρCp/γ)(es−ea)/rae (5)
5
whereγis the psychrometric constant (0.066 kPa◦C−1),e
s the saturated vapour pres-sure at a fictitious surface corresponding to that seen by the radiometer (as the same resistanceraeis used in Eqs. 4 and 5) andeathe vapour pressure of the air above the canopy.
Considering thatλE=Rn−H−G,rae can be finally expressed as: 10
rae=ρCp[(Ts−Ta)+(es−ea)/γ˜](Rn−G) (6)
whereRnis the net radiation andGthe soil heat flux.
Following the approach of Boegh et al. (2004), we consider that the saturated vapour pressure at the surfacees varies frome∗s(the saturated vapour pressure at the surface temperature Ts) to ea as a function of the degree of coupling between the surface 15
and the atmosphere (Jarvis and McNaughton, 1986). When there is a good coupling between the surface and the air (Ω→0), es approaches ea, and when the surface is decoupled from the ambient (Ω→1) water vapour accumulates at the surface and es→e∗s. Accordingly,es can be estimated as:
es = Ωhs,maxes∗ +(1−Ω)ea (7)
20
wherehs,maxis the maximum upper limit for relative air humidity at surface (0.85–1.0).
Ωcan be calculated as proportional to the ratio between canopy rc and aerodynamic resistancesra:
BGD
6, 1945–1978, 2009Model and validation of regional energy balance partitioning
F. Miglietta et al.
Title Page
Abstract Introduction
Conclusions References
Tables Figures
◭ ◮
◭ ◮
Back Close
Full Screen / Esc
Printer-friendly Version
Interactive Discussion where∆is the slope of the saturated vapour pressure versus temperature curve,
cal-culated at the air temperature. The aerodynamic resistance can be calcal-culated as:
ra=u/u2∗ (9)
whereu∗ is the friction velocity (m s−1), anduthe mean wind speed (m s−1).
In the inertial sublayer Monin-Obukhov similarity theory applies and u∗ can be de-5
duced from:
uz =(u∗/k) ln
(z−zd)/z0
+ψM z/L (10)
whereuz is the wind speed measured at heightz,kthe von Karman’s constant (0.40),
z0the surface roughness length,zd the zero-plane displacement height,Lthe Obukhov stability length, andψM a dimensionless function that accounts for the change in curva-10
ture of the wind profile away from the neutral profile with larger stability or instability. For more informations onLand the form of theψM function, refer to Kaimal and Finnigan (1994). The surface parameters used in Eq. (10) can be estimated from basic informa-tion on surface vegetainforma-tion and land use properties, including canopy height that was assumed to be at 20 m for the forest, at 1.5 m for the vineyard and to vary with time 15
for the maize crops. An estimation of stability lengthL is required in Eq. (10), and of canopy resistancerc is required in Eq. (8), while spatially resolved estimates of such variables are not directly available. A solution is to use ground eddy-covariance sta-tions to computeLdirectly, whilerccan be obtained by inverting the Penman-Monteith equation on the basis of surface measurements of latent heat flux, net radiation, soil 20
heat flux and meteorology as:
rc=((∆(Rn−G)+ρcp(es−ea)/ra)/λE−∆−γ)ra/γ (11)
In this way, canopy resistance values that are measured by individual eddy-covariance towers on specific ecosystems can be uniformly attributed to the same land use class over the region. However, while this approach can be suited for a large and rather 25
BGD
6, 1945–1978, 2009Model and validation of regional energy balance partitioning
F. Miglietta et al.
Title Page
Abstract Introduction
Conclusions References
Tables Figures
◭ ◮
◭ ◮
Back Close
Full Screen / Esc
Printer-friendly Version
Interactive Discussion more complex land use patterns that actually include crops, vineyards, isolated trees
or small forest patches and bare soils. For instance, it cannot be simply assumed that the canopy resistance of an irrigated maize crop is representative of a region that is in fact dominated by maize fields, but where other land use types are also present. Ac-cordingly, the canopy resistance for the main three areas of the experimental domain, 5
dominated by forest, vineyard and maize, was calculated as a function of the relative mean fraction of land occupied by those land uses, as:
rci =c1rc,1+c2rc,2+c3rc,3+c4rc,4 (12)
where c1, c2, c3, c4 are the relative fractions of land occupied by crops trees (1),
maize (2), vineyards (3) and bare soils (4), respectively, and i=1,2,3 refers to the 10
experimental area dominated by forest, vineyard and maize, respectively.
Such relative contribution of the various land uses was estimated on the basis of a simple classification of the mean surface albedo measured by the aircraft in the eddy-covariance flux footprint, based on a detailed aerial photography that was acquired by another CERES team (M. Esposito, data not shown).
15
3 Results and discussion
The main results of this study are illustrated and discussed in two separate sections. In the first section, LSA SAF products of net radiation and surface temperature are compared with measurements made by the aircraft and, similarly, direct aircraft mea-surements of some critical parameters used in the estimation of energy fluxes are 20
compared with corresponding surface data obtained by interpolation of measurements made by the meteorological network and with some station parameters. In the second section, energy fluxes estimated from radiometric surface temperatures are compared with corresponding airborne eddy-covariance fluxes. The objective is twofold as the results shown in the first section provide a basis for using satellite and ground data 25
BGD
6, 1945–1978, 2009Model and validation of regional energy balance partitioning
F. Miglietta et al.
Title Page
Abstract Introduction
Conclusions References
Tables Figures
◭ ◮
◭ ◮
Back Close
Full Screen / Esc
Printer-friendly Version
Interactive Discussion section, provide initial validation of the bulk formulation of sensible heat flux described
above.
3.1 Consistency between satellite, airborne and ground data
3.1.1 Satellite products versus direct airborne measurements
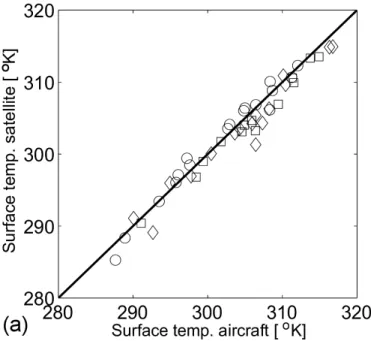
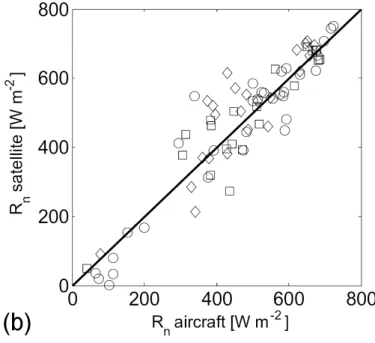
Airborne measurements of radiometric surface temperature are very consistent with 5
corresponding interpolated LSA SAF data, and similarly no major deviations are ob-served between airborne and satellite measurements of net radiation (Fig. 3). The relatively small differences observed are mainly attributable to the different footprint of the aircraft radiometers with respect to satellite pixels.
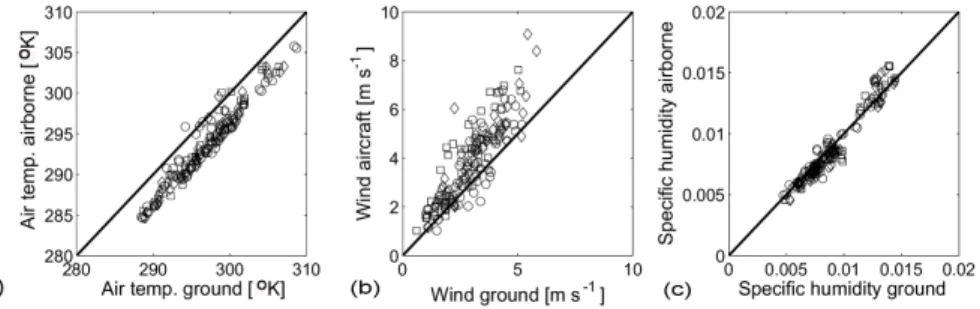
3.1.2 Aircraft measurements versus interpolated surface data 10
The air temperature that was directly measured by the aircraft at approximately 80 m above the ground compares well with spatially and temporally interpolated tures obtained from the ground weather network (Fig. 4a). As expected, air tempera-ture was lower at aircraft height than at the surface and inversions were observed at least in two occasions in the late afternoon under stable atmospheric conditions. The 15
wind-speed measured by the aircraft correlates well with the corresponding interpo-lated surface data, but the absolute values are, as expected, larger than at the ground (Fig. 4b). The difference is smaller for the forest than for the vineyard and arable land uses as a likely consequence of the fact that the vertical distance between the aircraft and the canopy surface was smaller over the forested area than elsewhere. The aircraft 20
has indeed always been flying at constant altitude relative to the ground. The specific humidity measured by the aircraft also matches the ground measurements (Fig. 4c).
BGD
6, 1945–1978, 2009Model and validation of regional energy balance partitioning
F. Miglietta et al.
Title Page
Abstract Introduction
Conclusions References
Tables Figures
◭ ◮
◭ ◮
Back Close
Full Screen / Esc
Printer-friendly Version
Interactive Discussion data made using the kriging technique adequately provides spatially and temporally
resolved information of ground parameters. This is an important prerequisite for the subsequent calculation of surface energy fluxes, as the proposed procedure requires both remotely sensed measurements of surface temperature and proper estimation of meteorological parameters at the surface.
5
3.2 Validation of the bulk formulation of sensible heat flux
It has been shown elsewhere that airborne eddy covariance can adequately estimate surface fluxes over homogeneous surfaces. Previous comparisons between aircraft and tower data provided extensive validation for this (Isaac et al., 2004; Gioli et al., 2004). Here, aircraft and tower data are compared in terms of energy balance closure 10
by selecting periods during which aircraft measurements were made in the vicinity of the towers or over comparable land use types during the various flights. The sum of latent (λE) and sensible (H) heat fluxes computed against net radiation from ground and tower data is illustrated in Table 1. Despite a reasonable match between the two data sources, the fractionof Rn explained byλE andH is in general lower for airborne 15
data. Such difference can be attributed to the fact that part of the flux associated with very high and very low frequency turbulence cannot be accounted for in airborne mea-surements, as a consequence of intrinsic limitations in the spectral resolution of the sensors and the size of the time window used for flux calculations. In addition, the cor-rections made for the vertical flux divergence of airborne fluxes are based on simplified 20
assumptions on heat entrainment occurring at the top of the PBL (de Arellano et al., 2005), and are independent of the variable jump in potential temperature between air masses in the PBL and in the free troposphere, that may be responsible for a variable magnitude of the divergence flux.
Canopy resistance (rc), as measured at the ground stations, increases over time 25
BGD
6, 1945–1978, 2009Model and validation of regional energy balance partitioning
F. Miglietta et al.
Title Page
Abstract Introduction
Conclusions References
Tables Figures
◭ ◮
◭ ◮
Back Close
Full Screen / Esc
Printer-friendly Version
Interactive Discussion of the experiment to a maximum of 280 m s−1at the end. A decrease inr
cfrom 249 to 202 m s−1is observed in the maize crop at Marmande, as a likely consequence of rapid
plant growth and the availability of water supplied to the crop by irrigation. The mean canopy resistance measured over the vineyard in Couhins remains rather constant throughout the season at a value close to 250 m s−1.
5
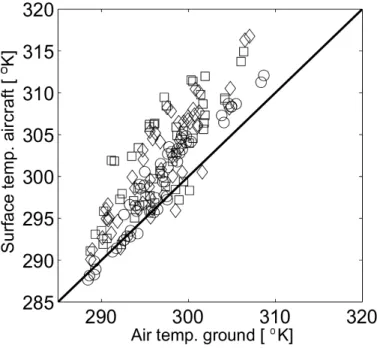
The radiometric temperatures measured by the aircraft vary significantly over time and space, as a function of surface properties, land use, air temperature and incom-ing radiation, and correlate well with air temperature measured by the ground station and interpolated over space and time (Fig. 5). The difference between the two vari-ables is in most cases a positive term, indicating that an upward positive heat flux from 10
the surface to the atmosphere is prevailing at the time of the flights. Exceptions are observed under stable conditions, especially in the late afternoon, when the surface temperature is lower than air temperature. However under these circumstances, when
H should in fact be a negative term, airborne eddy covariance measurements are not entirely reliable as the momentum flux is very low and possibly below a minimum tresh-15
old for meaningful flux calculation. Stable atmospheric conditions, possibly caused by strong subsidence associated with substantial stratification of the lower layer of the at-mosphere, may also lead to a complete “decoupling” between the actual surface fluxes and the turbulent fluxes at the height of the measurements. In those cases, the sensi-ble heat flux tends again to approach zero, while the surface-air temperature difference 20
remains positive. As those two conditions are not suited for airborne eddy-covariance measurements, periods with adequate turbulence and in which the surface-to-air tem-perature difference was positive are only considered.
The comparison between the energy fluxes deduced from the surface radiometric temperature (Hrae and λErae) and the corresponding values measured by airborne 25
BGD
6, 1945–1978, 2009Model and validation of regional energy balance partitioning
F. Miglietta et al.
Title Page
Abstract Introduction
Conclusions References
Tables Figures
◭ ◮
◭ ◮
Back Close
Full Screen / Esc
Printer-friendly Version
Interactive Discussion the same space window of 4 km. This implies that flux and radiometric footprints do
not exactly match and it may be speculated that when the aircraft flies against or with the wind, the radiometric footprint falls almost entirely within the flux footprint, whereas when the wind is perpendicular to the aircraft track this overlap may decrease to zero. However, the flight plans were generally designed as to avoid major landscape discon-5
tinuities. Hence, in the presence of a sufficiently homogeneous surface, the probability that flux and radiometric footprints have systematically different surface properties can be ruled out.
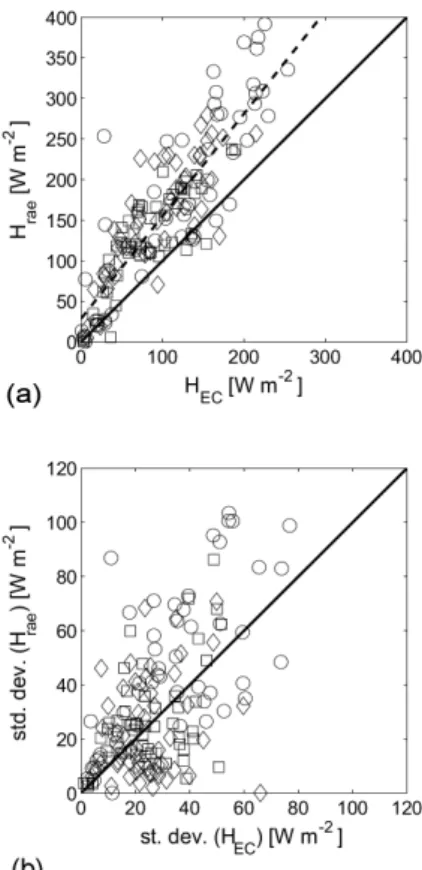
The results are shown in Figs. 6 and 7, where values averaged over entire flights and the corresponding standard deviations, are plotted in scatter diagrams. Hrae is 10
on average 36% larger than the corresponding value of HE C, but this discrepancy is consistent with the fraction difference betweenλE+H andRnthat is reported in Table 1 for ground and airborne fluxes. Accordingly, an underestimation ofHE C, rather than an overestimation ofHrae, is likely to account for the observed difference. Overall, the data shows substantial agreement for all three land use types considered here but the match 15
is better for the forest, possibly as a consequence of the fact that the forest was more homogeneous than the other two land use types. The spatial variability of observed and estimated fluxes is represented as the standard deviation of the elementary 4 km length computations across each transect over a predominant land use class (Fig. 6b); since the time taken by the aircraft to complete a transect is relatively small, typically less then 20
30 min, this variability is mostly a spatial rather than a temporal variability estimate. As the two methods show similar magnitudes of this variability, flight conditions where low spatial variability of eddy-covariance fluxes is observed show similarly low radiometric-based fluxes variability, and vice-versa. This reinforces the hypothesis that spatial lengths most responsible for the variability of surface energy exchanges are properly 25
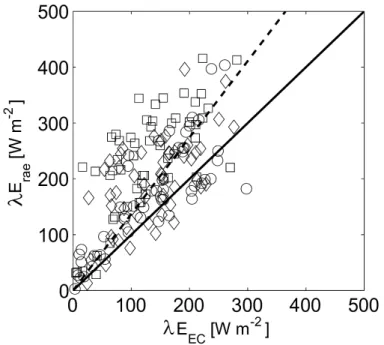
sampled and characterized. As for the sensible heat flux,λErae is generally larger than
λEE Cfor the three ecosystem types but again the observed difference can be explained as a consequence of incomplete energy balance closure.
BGD
6, 1945–1978, 2009Model and validation of regional energy balance partitioning
F. Miglietta et al.
Title Page
Abstract Introduction
Conclusions References
Tables Figures
◭ ◮
◭ ◮
Back Close
Full Screen / Esc
Printer-friendly Version
Interactive Discussion final parts of the experimental campaign despite a large variation in meteorological
con-ditions and in the surface properties associated with canopy development, especially in the agricultural areas of the region. This indicates that the proposed methodology and the quality of airborne and surface data are suitable to estimate sensible and latent heat fluxes over a range of conditions and a complex level of spatial scale.
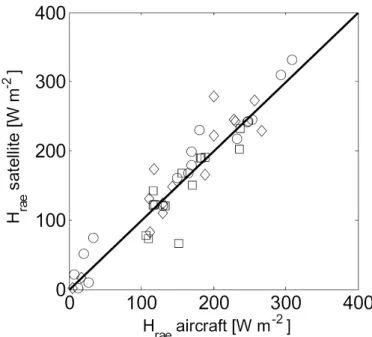
5
The possibility to use the proposed bulk formulation of sensible and latent heat fluxes for routinely regional applications is further reinforced by the comparison of sensible heat fluxes computed on the basis of airborne and satellite data. The data presented in Fig. 8 highlights that if airborne measurements of radiometric surface temperature and net radiation are substituted by LSA SAF products which are becoming freely available, 10
the results remain similar. This opens the possibility to work at scales that have been only rarely considered so far, in spite of their crucial importance for understanding atmosphere/biosphere interactions of the land surface (Mahrt and Vickers, 2004).
4 Conclusions
The data shown in this paper confirm the reliability of the proposed bulk formulation 15
to estimate sensible heat flux at the regional scale, using radiometric surface temper-atures as the main driver. The method used here, based on the work of Boegh et al. (2004), requires relatively simple inputs that include meteorological data at the surface, information on land use, estimates of canopy conductance, radiometric measurements of surface temperature and net radiation. Surface weather data (air temperature, wind 20
speed and air humidity) can be obtained from weather station networks and may be interpolated using proper spatialisation methodologies. The eddy-covariance tower network (http://daac.ornl.gov/FLUXNET/) can be used to obtain a rough estimate of canopy resistance for various land use types, a parameter required in the bulk formu-lation of the sensible heat flux. However, when flux towers are not available, resistance 25
BGD
6, 1945–1978, 2009Model and validation of regional energy balance partitioning
F. Miglietta et al.
Title Page
Abstract Introduction
Conclusions References
Tables Figures
◭ ◮
◭ ◮
Back Close
Full Screen / Esc
Printer-friendly Version
Interactive Discussion be a constant, as is made, for instance, in the standard FAO 56 methodology commonly
used to calculate crop evapotranspiration (Steduto et al., 1998).
The real novelty here is the possibility of doing extensive and robust validation of energy flux estimates using airborne eddy covariance. The comparison of totally in-dependent estimates ofH and λE can in fact provide unprecedented validation and, 5
more importantly, the validation can actually be made at the proper regional scale. In this light, our study extends and reinforces previous validation exercises that compared remote-sensing based estimates of energy fluxes with point measurement made by eddy covariance and lysimeters (Colaizzi et al., 2004; Boegh et al., 2004; Roerink et al., 2000). The overall good match betweenHrae/λErae andHE C/λEE Cholds across 10
the three land use types that have substantial differences in their properties and homo-geneity. This further supports the conclusion that the proposed methodology has the potential to be applied for both forest and agricultural areas. Such application is of im-portance to develop proper regional-scale investigations like the CarboEurope CERES experiment and offers new opportunities for the analysis and integration of other areas. 15
The availability of reliable regional information on latent heat flux offers, for instance, the opportunity to derive reliable estimates of the Gross Primary Productivity based on estimates of ecosystem water use efficiency, i.e. the amount of carbon assimilated per unit of water transpired. The increasing availability of spatially and temporally resolved radiometric measurements of surface temperature provided by the new generation of 20
geostationary meteorological satellites, combined with the increasing availability of de-tailed and updated land use maps and of the data from the global tower flux network is likely to extend the applicability of the proposed methodology. The advent of a new gen-eration of light and low-cost experimental aircraft capable of measuring surface fluxes at the regional scale provides, in addition, an important tool to validate flux estimation 25
under a wide range of conditions.
Bon-BGD
6, 1945–1978, 2009Model and validation of regional energy balance partitioning
F. Miglietta et al.
Title Page
Abstract Introduction
Conclusions References
Tables Figures
◭ ◮
◭ ◮
Back Close
Full Screen / Esc
Printer-friendly Version
Interactive Discussion nefond, M. Irvine, N. Jarosz, D. Garrigou, R. Burlett and S. Debesa are gratefully acknowledged
for their help with the measurements at the Le Bray, Bilos and Couhins sites.
References
Anderson, M. C., Norman, J. M., Kustas, W. P., Houborg, R., and Starks, P.: A thermal-based remote sensing technique for routine mapping of land-surface carbon, water and energy 5
fluxes from field to regional scales, Remote Sens. Environ., 112(12), 4227–4241, 2008. Aubinet, M., Grelle, A., Ibrom, A., Rannik, U., Moncrieff, J., Foken, T., Kowalski, A., Martin, P. H.,
Berbigier, P., Bernhofer, C., Clement, R., Elbers, J. A., Granier, A., Grunwald, T., Morgen-stern, K., Pilegaard, K., Rebmann, C., Snijders, W., Valentini, R., and Vesala, T.: Estimates of the Annual Net Carbon and Water Exchange of Forest: The EUROFLUX Methodology, 10
Adv. Ecol. Res., 30, 114–173, 2000.
Bange, J., Zittel, P., Spiess, T., Uhlenbrock, J., and Beyrich, F.: A new method for the determi-nation of area-averaged turbulent surface fluxes from low-level flights using inverse models, Bound. Lay. Meteorol., 119(3), 527–561, 2006.
Bastiaanssen, W. G. M., Noordman, E. J. M., Pelgrum, H., Davids, G., Thoreson, B. P., and 15
Allen, R. G.: SEBAL model with remotely sensed data to improve water-resources manage-ment under actual field conditions, J. Irrig. Drain. E. Asce, 131, 85–93, 2005.
Boegh, E., Soegaard, H., and Thomsen, A.: Evaluating evapotranspiration rates and surface conditions using Landsat TM to estimate atmospheric resistance and surface resistance, Remote Sens. Environ., 79(2–3), 329–343, 2002.
20
Boegh, E. and Soegaard, H.: Remote sensing based estimation of evapotranspiration rates, Int. J. Remote Sens., 25(13), 2535–2551, 2004.
Camps, A., Vall-llossera, N., and Duffo, N.: Performance of sea surface salinity and soil mois-ture retrieval algorithms with different auxiliary datasets in 2-D L-band aperture synthesis interferometric radiometers, IEEE T. Geosci. Remote, 43(5), 1189–1200, 2005.
25
Choudhury, B. J. and DiGirolamo, N. E.: A biophysical process-based estimate of global land surface evaporation using satellite and ancillary data – I. Model description and comparison with observations, J. Hydrol., 205(3–4), 164–185, 1998.
BGD
6, 1945–1978, 2009Model and validation of regional energy balance partitioning
F. Miglietta et al.
Title Page
Abstract Introduction
Conclusions References
Tables Figures
◭ ◮
◭ ◮
Back Close
Full Screen / Esc
Printer-friendly Version
Interactive Discussion and Modelling of Ecosystems for Sustainability, edited by: Wei Gao and Shaw, D. R., SPIE,
Bellingham, WA, 5544, 215–229, doi:10.1117/12.559503, 2004.
Coll, C., Caselles, V., Rubio, E., Valor, E., Sospedra, F., Baret, F., Prevot, L., and Jacob, F.: Temperature and emissivity extracted from airborne multi-channel data in the ReSeDA ex-periment, Agronomie, 22(6), 567–573, 2002.
5
Crawford, T. L. and Dobosy, R. J.: A sensitive fast response probe to measure turbulence and heat flux from any airplane, Bound. Lay. Meteorol., 59, 257–278, 1992.
Crawford, T. L., Dobosy, R. J., McMillen, R. T., Vogel, C. A., and Hicks, B. B.: Air-surface ex-change measurement in heterogeneous regions: extending tower observations with spatial structure observed from small aircraft, Glob. Change Biol., 2, 275–285, 1996.
10
Crow, W. T., Li, F. Q., and Kustas, W. P.: Intercomparison of spatially distributed models for predicting surface energy flux patterns during SMACEX, J. Hydrometeorol., 6(6), 941–953, 2005.
De Arellano J. V., Gioli B., Miglietta F., Jonker H. J. J., Baltink H. K., Hutjes R. W. A., and Holtslag A. A. M.: Entrainment process of carbon dioxide in the atmospheric boundary layer, 15
J. Geophys. Res. Atmos., 109(D18), D18110, doi:10.1029/2004JD004725, 2004.
Desjardins, R. L., MacPherson, J. I., Schuepp, P. H., and Karanji, F.: An evaluation of aircraft measurements of CO2, water vapour and sensible heat, Bound. Lay. Meteorol., 47, 55–69, 1989.
Desjardins, R. l., Hart, R. l., Macpherson, J. I., Schuepp, P. H., and Verma, S. B.: Aircraft-20
based and tower-based fluxes of carbon-dioxide, latent, and sensible heat, J. Geophys. Res. Atmos., 97(D17), 18477–18485, 1992.
Dirmeyer, P. A.: Vegetation as a Feedback Mechanism in Mid-Latitude Drought, J. Climate, 7, 1463–1483, 1994.
Dolman, A. J., Ronda, R., Miglietta, F., and Ciais, P.: Regional measurement and modelling of 25
carbon balances, SEB Exp. Biol. Ser., 93–108, 2005.
Dolman, A., Noilhan, J., Durand, P., Sarrat, C., Brut, A., Butet, A., Jarosz, N., Brunet, Y., Lous-tau, D., Lamaud, E., Tolk, L., Ronda, R., Miglietta, F., Gioli, B., Magliulo, E., Esposito, M., Gerbig, C., Koerner, S., Galdemard, P., Ramonet, M., Ciais, P., Neininger, B., Hutjes, R., Elbers, J., Warnecke, T., Landa, G., Sanz, M., Scholz, Y., and Facon, G.: CERES, the Car-30
boeurope Regional Experiment Strategy in: les Landes, South West France, May–Jun 2005, BAMS, 87, 1367–1379, 2006.
BGD
6, 1945–1978, 2009Model and validation of regional energy balance partitioning
F. Miglietta et al.
Title Page
Abstract Introduction
Conclusions References
Tables Figures
◭ ◮
◭ ◮
Back Close
Full Screen / Esc
Printer-friendly Version
Interactive Discussion boundary-layer, Bound. Lay. Meteorol., 30(1–4), 75–105, 1984.
Foken, T., Gckede, M., Mauder, M., Mahrt, L., Amiro, B. D., and Munger, J. W.: Post-field data quality control, in: Handbook of Micrometeorology: A Guide for Surface Flux Measurement and Analysis, edited by: Lee, X., Massman, W., and Law, B., Kluwer, Dordrecht, 181–208, 2004.
5
Gioli, B., Miglietta, F., De Martino, B., Hutjes, R. W. A., Dolman, H. A J., Lindroth, A., Schu-macher, M., Sanz, M. J., Manca, G., Peressotti, A., and Dumas, E. J.: Comparison between tower and aircraft-based eddy covariance fluxes in five European regions, Agr. Forest Mete-orol., 127(1–2), 1–16, 2004.
Granger, R. J.: Satellite-derived estimates of evapotranspiration in the Gediz basin, J. Hydrol., 10
229(1–2), 70–76, 2000.
Hewison, T. J.: Airborne measurements of forest and agricultural land surface emissivity at millimeter wavelengths, IEEE T. Geosci. Remote, 39(2), 393–400, 2001.
Isaac, P. R., McAneney, J., Coppin, P., and Hacker, J.: Comparison of aircraft and ground-based flux measurements during OASIS95, Bound. Lay. Meteorol., 110, 39–67, 2004.
15
Jarvis, P. G. and McNaughton, K. G.: Stomatal control of transpiration: scaling up from leaf to region, Adv. Ecol. Res., 15, 1–49, 1986.
Kaimal, J. C. and Finnigan, J. J.: Atmospheric Boundary Layer Flows – Their Structure and Measurement, Oxford University Press, New York, NY, 289, 1994.
Kalma, J. D. and Jupp, D. L. B.: Estimating evaporation from pasture using infrared thermometry 20
– evaluation of a one-layer resistance model, Agr. Forest Meteorol., 51(3–4), 223–246, 1990. Kustas, W. P., Choudhury, B. J., Moran, M. S., Reginato, R. D., Jackson, R. D., Gay, L. W., and
Weaver, H. L.: Determination of sensible heat flux over sparse canopy using thermal infrared data, Agr. Forest Meteorol., 44, 197–216, 1989.
Mahrt, L. and Vickers, D.: Bulk formulation of the surface heat flux, Bound. Lay. Meteorol., 110, 25
357–379, 2004.
Massman, W. J.: A model study of kB H-1 for vegetated surfaces using “localized near-field” Lagrangian theory, J. Hydrol., 223, 27–43, 1999.
Miglietta, F., Gioli, B., Hutjes, R. W. A., and Reichstein, M.: Net regional ecosystem CO2 ex-change from airborne and ground-based eddy covariance, land-use maps and weather ob-30
servations, Glob. Change Biol., 13(3), 548–560, 2007.
Monteith, J. L.: Principles of Environmental Physics, Edward Arnold, London, 1973.
BGD
6, 1945–1978, 2009Model and validation of regional energy balance partitioning
F. Miglietta et al.
Title Page
Abstract Introduction
Conclusions References
Tables Figures
◭ ◮
◭ ◮
Back Close
Full Screen / Esc
Printer-friendly Version
Interactive Discussion boundary layer, J. Appl. Meteorol., 43(6), 925–933, 2004.
Roerink, G. J., Su, Z., and Menenti, M.: S-SEBI: A simple remote sensing algorithm to estimate the surface energy balance, Phys. Chem. Earth Pt. B., 25(2), 147–157, 2000.
Sarrat, C., Noilhan, J., Lacarrre, P., Dolman, A. J., Gerbig, C., Elbers, J. A., Vellinga, O. S., Gioli, B., Miglietta, F., Neininger, B., Lauvaux, T., Ciais, P., Ramonet, M., Ceschia, E., and 5
Bonnefond, J. M.: Mesoscale modeling of the CO2interactions between the surface and the atmosphere applied to the April 2007 CERES field experiment, Biogeosciences Discuss., 6, 515–544, 2009,
http://www.biogeosciences-discuss.net/6/515/2009/.
Schmugge, T. J., Becker, F., and Li, Z.-L.: Spectral emissivity variations observed in airborne 10
surface temperature measurements, Remote Sens. Environ., 35, 95–104, 1991.
Senff, C., Bosenberg, J., and Peters, G.: Measurement of water-vapor flux profiles in the con-vective boundary-layer with lidar and radar-rass, J. Atmos. Ocean. Tech., 11, 1, 85–93, 1994. Seth, A. and Giorgi, F.: Three-dimensional model study of mesoscale circulations induced by
vegetation, J. Geophys. Res., 101, 7371–7391, 1996. 15
Steduto, P. and Hsiao, T. C.: Maize canopies under two soil water regimes – II. Seasonal trends of evapotranspiration, carbon dioxide assimilation and canopy conductance, and as related to leaf area index, Agr. Forest Meteorol., 89, 3–4, 185–200, 1998.
Stull, R. B.: An Introduction to Boundary Layer Meteorology, Kluwer Academic Publishers, Dordrecht, 1988.
20
Su, H. B., Schmid, H. P., Grimmond, C. S. B., Vogel, C. S., and Curtis, P. S.: Is flux divergence in the tower layer important In estimating annual nee using eddy-covariance measurements?, Conference on Agricultural and Forest Meteorology, Amer. Meterol. Soc., Paper NO. 2.7, Vancouver, Candada, 2004.
Trigo, I. F., Monteiro, I. T., Olesen, F., and Kabsch E.: An assessment of remotely sensed land 25
surface temperature, J. Geophys. Res., 113, D17108, doi:10.1029/2008JD010035, 2008. Troufleau, D., Lhomme, J. P., Monteny, B., and Vidal, A.: Sensible heat flux and radiometric
tem-perature over sparse sahelian vegetation. I. An experimental analysis of the kB-1 parameter, J. Hydrol., 188–189, 815–838, 1997.
Vall-llossera, M., Camps, A., Corbella, I., Torres, F., Duffo, N., Monerris, A., Sabia, R., Selva, D., 30
BGD
6, 1945–1978, 2009Model and validation of regional energy balance partitioning
F. Miglietta et al.
Title Page
Abstract Introduction
Conclusions References
Tables Figures
◭ ◮
◭ ◮
Back Close
Full Screen / Esc
Printer-friendly Version
Interactive Discussion Vidal, A. and Perrier, A.: Analysis of a simplified relation for estimating daily evapotranspiration
BGD
6, 1945–1978, 2009Model and validation of regional energy balance partitioning
F. Miglietta et al.
Title Page
Abstract Introduction
Conclusions References
Tables Figures
◭ ◮
◭ ◮
Back Close
Full Screen / Esc
Printer-friendly Version
Interactive Discussion
Table 1. The fraction of net radiationRnrepresented by the latent (λE) and sensible (H) heat fluxes computed for the three land cover classes. Only tower data corresponding to flight times have been used, while all aircraft data belonging to the land cover class have been used.
(H+λE)/Rn Tower Aircraft
Forest 0.72 0.59
Maize 0.74 0.49
BGD
6, 1945–1978, 2009Model and validation of regional energy balance partitioning
F. Miglietta et al.
Title Page
Abstract Introduction
Conclusions References
Tables Figures
◭ ◮
◭ ◮
Back Close
Full Screen / Esc
Printer-friendly Version
Interactive Discussion
BGD
6, 1945–1978, 2009Model and validation of regional energy balance partitioning
F. Miglietta et al.
Title Page
Abstract Introduction
Conclusions References
Tables Figures
◭ ◮
◭ ◮
Back Close
Full Screen / Esc
Printer-friendly Version
Interactive Discussion
BGD
6, 1945–1978, 2009Model and validation of regional energy balance partitioning
F. Miglietta et al.
Title Page
Abstract Introduction
Conclusions References
Tables Figures
◭ ◮
◭ ◮
Back Close
Full Screen / Esc
Printer-friendly Version
Interactive Discussion
BGD
6, 1945–1978, 2009Model and validation of regional energy balance partitioning
F. Miglietta et al.
Title Page
Abstract Introduction
Conclusions References
Tables Figures
◭ ◮
◭ ◮
Back Close
Full Screen / Esc
Printer-friendly Version
Interactive Discussion
BGD
6, 1945–1978, 2009Model and validation of regional energy balance partitioning
F. Miglietta et al.
Title Page
Abstract Introduction
Conclusions References
Tables Figures
◭ ◮
◭ ◮
Back Close
Full Screen / Esc
Printer-friendly Version
Interactive Discussion
BGD
6, 1945–1978, 2009Model and validation of regional energy balance partitioning
F. Miglietta et al.
Title Page
Abstract Introduction
Conclusions References
Tables Figures
◭ ◮
◭ ◮
Back Close
Full Screen / Esc
Printer-friendly Version
Interactive Discussion
BGD
6, 1945–1978, 2009Model and validation of regional energy balance partitioning
F. Miglietta et al.
Title Page
Abstract Introduction
Conclusions References
Tables Figures
◭ ◮
◭ ◮
Back Close
Full Screen / Esc
Printer-friendly Version
Interactive Discussion
BGD
6, 1945–1978, 2009Model and validation of regional energy balance partitioning
F. Miglietta et al.
Title Page
Abstract Introduction
Conclusions References
Tables Figures
◭ ◮
◭ ◮
Back Close
Full Screen / Esc
Printer-friendly Version
Interactive Discussion
BGD
6, 1945–1978, 2009Model and validation of regional energy balance partitioning
F. Miglietta et al.
Title Page
Abstract Introduction
Conclusions References
Tables Figures
◭ ◮
◭ ◮
Back Close
Full Screen / Esc
Printer-friendly Version
Interactive Discussion