AMTD
5, 6357–6386, 2012Water vapor isotopologues from
GOSAT
C. Frankenberg et al.
Title Page
Abstract Introduction
Conclusions References
Tables Figures
◭ ◮
◭ ◮
Back Close
Full Screen / Esc
Printer-friendly Version Interactive Discussion
Discussion
P
a
per
|
Dis
cussion
P
a
per
|
Discussion
P
a
per
|
Discussio
n
P
a
per
|
Atmos. Meas. Tech. Discuss., 5, 6357–6386, 2012 www.atmos-meas-tech-discuss.net/5/6357/2012/ doi:10.5194/amtd-5-6357-2012
© Author(s) 2012. CC Attribution 3.0 License.
Atmospheric Measurement Techniques Discussions
This discussion paper is/has been under review for the journal Atmospheric Measurement Techniques (AMT). Please refer to the corresponding final paper in AMT if available.
Water vapor isotopologues retrievals from
high resolution GOSAT short-wave
infrared spectra
C. Frankenberg1, D. Wunch2, G. Toon1, C. Risi3, R. Scheepmaker4, J.-E. Lee1, P. Wennberg2, and J. Worden1
1
Jet Propulsion Laboratory, California Institute of Technology, Pasadena, USA 2
California Institute of Technology, Pasadena, USA 3
LMD/IPSL, CNRS, Paris, France 4
SRON Netherlands Institute for Space Research, Utrecht, The Netherlands
Received: 11 July 2012 – Accepted: 20 August 2012 – Published: 6 September 2012 Correspondence to: C. Frankenberg (christian.frankenberg@jpl.nasa.gov)
AMTD
5, 6357–6386, 2012Water vapor isotopologues from
GOSAT
C. Frankenberg et al.
Title Page
Abstract Introduction
Conclusions References
Tables Figures
◭ ◮
◭ ◮
Back Close
Full Screen / Esc
Printer-friendly Version Interactive Discussion
Discussion
P
a
per
|
Dis
cussion
P
a
per
|
Discussion
P
a
per
|
Discussio
n
P
a
per
|
Abstract
Remote sensing of the isotopic composition of water vapor can provide valuable infor-mation on the hydrological cycle. Here, we demonstrate feasibility of retrievals of the relative abundance of HDO (the HDO / H2O ratio) from the Japanese GOSAT satellite. For this purpose, we use high spectral resolution nadir radiances around 6400 cm−1
5
(1.56 µm) to retrieve vertical column amounts of H2O and HDO. Retrievals of H2O correlate well with ECMWF (European Centre for Medium-Range Weather Forecasts) integrated profiles (r2=0.96). Typical precision errors in the retrieved column averaged deuterium depletion (δD) are 20–40 ‰. We validateδDagainst a TCCON (Total Car-bon Column Observing Network) ground-based station in Lamont, Oklahoma. Using
10
retrievals in very dry areas over Antarctica, we detect a small systematic offset in re-trieved H2O and HDO column amounts and take this into account for a bias-correction ofδD. Monthly averages of δD in the June 2009 to September 2011 time-frame are well correlated with TCCON (r2=0.79) and exhibit a slope of 0.98 (1.23 if not bias corrected). We also compare seasonal averages on the global scale with results from
15
the SCIAMACHY instrument in the 2003–2005 timeframe. Despite the lack of temporal overlap, seasonal averages in general agree well, with spatial correlations (r2) ranging from 0.62 in September through November to 0.83 in June through August. However, we observe higher variability in GOSAT δD, indicated by fitted slopes between 1.2 and 1.46. The discrepancies are likely related to differences in vertical sensitivities but
20
warrant further validation of both GOSAT and SCIAMACHY and an extension of the validation dataset.
1 Introduction
Significant uncertainties in current climate model predictions of future warming are associated with the hydrological cycle, such as water vapor and cloud feedbacks (Held
25
AMTD
5, 6357–6386, 2012Water vapor isotopologues from
GOSAT
C. Frankenberg et al.
Title Page
Abstract Introduction
Conclusions References
Tables Figures
◭ ◮
◭ ◮
Back Close
Full Screen / Esc
Printer-friendly Version Interactive Discussion
Discussion
P
a
per
|
Dis
cussion
P
a
per
|
Discussion
P
a
per
|
Discussio
n
P
a
per
|
cloud distribution are the largest source of spread in climate change projections (Bony and Dufresne, 2005; Bony et al., 2006).
Atmospheric general circulation models (GCMs) must therefore accurately simulate the processes that control tropospheric humidity and clouds correctly for their climate change predictions to be credible.
5
Measurements of stable isotopologues of water can provide key constraints on the processes controlling clouds and humidity because (1) the isotopic composition of wa-ter will change as the wawa-ter changes phase, (2) wawa-ter sources such as the ocean and plants have different isotopic signatures (or compositions), and (3) mixing pro-cesses will affect the isotopic composition of water differently than phase changes.
10
In the upper-troposphere, the water vapor isotopic composition can be measured by satellites (Kuang et al., 2003; Nassar et al., 2007; Steinwagner et al., 2010) or in-situ (Webster and Heymsfield, 2003; Sayres et al., 2010) and reflects the role of convec-tion in the transport of water in the upper-troposphere and through the tropopause (Moyer et al., 1996). In the mid-troposphere, the water vapor isotopic composition can
15
also be measured by satellite (Worden et al., 2007; Herbin et al., 2009; Schneider and Hase, 2011) and in-situ (Noone et al., 2011) and may give an indication about water cycle processes such as mixing of air masses (Galewsky and Hurley, 2010) or rain reevaporation (Worden et al., 2007). In the lower troposphere, the water vapor isotopic composition is sensitive to the origin of water vapor and precipitation, such as
continen-20
tal recycling (Salati et al., 1979; Gat and Matsui, 1991) or air mass origin (Tian et al., 2001). To draw inferences about these lower tropospheric processes, many studies have so far relied on the isotopic composition of precipitation (e.g., Salati et al., 1979; Gat and Matsui, 1991; Tian et al., 2001). However, precipitation is strongly affected by post-condensation processes that blur the original vapor signal (Stewart, 1975; Lee
25
AMTD
5, 6357–6386, 2012Water vapor isotopologues from
GOSAT
C. Frankenberg et al.
Title Page
Abstract Introduction
Conclusions References
Tables Figures
◭ ◮
◭ ◮
Back Close
Full Screen / Esc
Printer-friendly Version Interactive Discussion
Discussion
P
a
per
|
Dis
cussion
P
a
per
|
Discussion
P
a
per
|
Discussio
n
P
a
per
|
the possibility of exploiting the potential of water isotopes to better understand the lower tropospheric water budget, such as the role of continental recycling or convection in this budget (Risi et al., 2010). Owing to instrumental degradation, the current data-record of SCIAMACHY HDO so far only covers the years 2003 through 2005 and connection to the entire ENVISAT satellite was irreparably lost in April 2012.
5
Here, we retrieve the column averaged deuterium depletion of atmospheric water vapor using the Japanese Greenhouse gases Observing Satellite (GOSAT, Hamazaki et al., 2005; Kuze et al., 2009), which was launched on 23 January 2009 into a sun-synchronous orbit with a local overpass time of 13:00.≈10 000 soundings with 82 km2
circular spatial footprints are recorded daily, repeating a regularly spaced global
foot-10
print grid every 3 days. Spectra are recorded by the TANSO Fourier Transform Spec-trometer (FTS) onboard GOSAT. They enable independent retrievals of the total column amount of water vapor H2O and its heavy isotope HDO in the 1.56 µm spectral region. This potential for GOSAT has so far not been exploited. We will discuss the retrieval setup in Sect. 2, validate and bias-correct the retrievals against ground-based
obser-15
vations in Sect. 3 and show global results and first comparisons with SCIAMACHY in Sect. 4.
2 HDO/H2O retrieval setup from GOSAT
The column-averaged HDO abundance is often described in δ-notation, relative to standard mean ocean water (SMOW):
20
δD=1000 ‰· VCD(HDO)/VCD(H2O) Rs
−1
! ,
where VCD(HDO) and VCD(H2O) denote the vertical column densities of HDO and H2O, respectively. Rs (=3.1152×10−
4
AMTD
5, 6357–6386, 2012Water vapor isotopologues from
GOSAT
C. Frankenberg et al.
Title Page
Abstract Introduction
Conclusions References
Tables Figures
◭ ◮
◭ ◮
Back Close
Full Screen / Esc
Printer-friendly Version Interactive Discussion
Discussion
P
a
per
|
Dis
cussion
P
a
per
|
Discussion
P
a
per
|
Discussio
n
P
a
per
|
proportional to total precipitable water, a term more commonly used in hydrological sciences.
Our basic retrieval approach forδDlargely follows retrievals from SCIAMACHY (e.g., Frankenberg et al., 2005a, 2008, 2009) using the IMAP-DOAS (Iterative Maximum a Posteriori – Differential Optical Absorption Spectroscopy) algorithm (Frankenberg
5
et al., 2005b) with instrument specific adaptions and ECMWF meteorological data for pressure, temperature and a priori humidity profiles. CO2is the only interfering species and the disk-integrated solar line-list is adapted from the full-physics CO2 retrievals used for GOSAT (originally developed for TCCON retrievals). The main difference with respect to the original IMAP-code is that we fit the spectra directly without taking the
10
logarithm (however, as we use an iterative solver, the results are virtually identical). The continuum baseline is fitted with a 2nd order polynomial.
For the HDO a priori profile, we use a simplistic formulation, scaling the H2O ECMWF prior profile with a pressure-dependent scaling factor, linearly varying from 0.9 at the surface to 0.5 at 50 hPa (i.e., a priorδDof−100 ‰ close to the surface and−500 ‰ in
15
the stratosphere). In the state vector (both for HDO and H2O), we include 10 retrieval layers, which are equidistant in pressure. The a priori covariance (1σ) was chose to be 15 % for all layers but the lowest, where 1500 % as 1σ ensures that the retrieval is ef-fectively unconstrained. HDO and H2O are treated as independent species without any side-constraints (besides the similarity in the prior profile) imposed on the HDO−H2O
20
functional relationship in the a priori covariance matrix. For the retrieval ofδDwe use nadir radiance spectra measured in the short-wave infrared, viz. in the spectral range around 6400 cm−1 (1.56 µm). The high spectral resolution of the TANSO FTS (2.5 cm maximum path difference resulting in 0.4 cm−1 unapodized spectral resolution) allows to retrieve weak HDO and H2O lines in the aforementioned spectral range. Similar to
25
AMTD
5, 6357–6386, 2012Water vapor isotopologues from
GOSAT
C. Frankenberg et al.
Title Page
Abstract Introduction
Conclusions References
Tables Figures
◭ ◮
◭ ◮
Back Close
Full Screen / Esc
Printer-friendly Version Interactive Discussion
Discussion
P
a
per
|
Dis
cussion
P
a
per
|
Discussion
P
a
per
|
Discussio
n
P
a
per
|
in the near infrared. An exemplary spectral fit using data near Lamont (Oklahoma) is shown in Fig. 1.
In the spectral fit, the weak CO2 band around 6340 cm− 1
is included as it partially overlaps with HDO and H2O lines. Even though spectral residuals (differences between modeled and measured radiances) are gaussian and devoid of outliers, the reducedχ2
5
value is significantly higher than 1, mostly caused by low frequency variations in the continuum (see upper panel). The Jacobians with respect to total column changes in HDO and H2O can be seen in the lower panel. As for spectroscopic parameters, we use CO2 absorption coefficient tables (including line-mixing effects) generated for the ACOS (Atmospheric CO2Observations from Space) and Orbiting Carbon
Obser-10
vatory (OCO-2) projects (Thompson et al., 2012). HDO and H2O cross sections are calculated based on the line-list used for TCCON (Total Carbon Column Observing Network, Wunch et al., 2011a) using pure Voigt line-shapes. The TCCON H2O and HDO linelist contains the Toth (2005) and Jenouvrier et al. (2007) lines, with several additional empirically determined lines that have subsequently been assigned
ground-15
state energies by Iouli Gordon (personal communication, 2010). All cross sections are pre-calculated as on-line calculations are computationally expensive. As rigid treat-ment of water self-broadening is not easily feasible, we use of an effective pressure peff=pECMWF(1+4VMR(H2O)) , where VMR denotes volume mixing ratio and where we assume a ratio of the self to air-broadening coefficient of about 5. Under this
as-20
sumption, the calculated line-shape is identical with one using self and air broadening parameters separately (which would, however, require one more dimension in the cross section lookup-tables, see Appendix A for the derivation of the effective pressure).
2.1 Quality filtering
We filter all retrievals based on a set of quality criteria, similar to O’Dell et al. (2012):
25
– χ2<3
AMTD
5, 6357–6386, 2012Water vapor isotopologues from
GOSAT
C. Frankenberg et al.
Title Page
Abstract Introduction
Conclusions References
Tables Figures
◭ ◮
◭ ◮
Back Close
Full Screen / Esc
Printer-friendly Version Interactive Discussion
Discussion
P
a
per
|
Dis
cussion
P
a
per
|
Discussion
P
a
per
|
Discussio
n
P
a
per
|
– relative error in retrieved HDO column<15 %
– passed simple cloud filter (fitted O2column amount>90 % of ECMWF O2column amount)
– fitted H2O column>70 % of ECMWF prior – 0.96<CO2ratio<1.04
5
– 0.8<H2O ratio<1.2
The CO2and H2O ratios are from IMAP-DOAS retrievals using the weak and strong CO2 bands. These retrievals have been performed under a non-scattering assump-tion and any strong deviaassump-tion from this hypothesis leads to a divergence in retrieved abundances in the two bands. We found them to be particularly valuable in detecting
10
strongly scattering scenes, including the detection of low-level clouds that can impact the retrieval accuracy.
2.2 Bias correction
Systematic errors in spectroscopy and instrumental effects can bias both the H2O and HDO vertical column densities. Errors in line-strengths typically result in constant
mul-15
tiplicative biases while errors in line-shape (e.g., pressure broadening) can create bi-ases which depend on both viewing geometry (mostly airmass) and total H2O column amount as these determine the degree of saturation in Nadir-looking short-wave spec-tra. Constant multiplicative biases in the respective column densities will lead to a shift in δD and are not too worrisome as the variability in δD is unchanged and overall
20
shifts are easy to calibrate out. Offsets in the retrieved column densities, however, can result in shifts that actually depend on the total amount of the retrieved columns. To investigate whether offsets are apparent in retrieved H2O and HDO column amounts, we extracted all land-only retrievals south of 60◦S where the a priori ECMWF column amount was below 8×10²¹mole cm−2, i.e., a very dry atmosphere. This ensures a good
AMTD
5, 6357–6386, 2012Water vapor isotopologues from
GOSAT
C. Frankenberg et al.
Title Page
Abstract Introduction
Conclusions References
Tables Figures
◭ ◮
◭ ◮
Back Close
Full Screen / Esc
Printer-friendly Version Interactive Discussion
Discussion
P
a
per
|
Dis
cussion
P
a
per
|
Discussion
P
a
per
|
Discussio
n
P
a
per
|
fit of the intercept without a wet atmosphere dominating the slope fit, hence also the in-tercept. We then determined the offset by a least squares fit to a first order polynomial, based on the ECMWF and retrieved column densities.
Results are shown in Fig. 2. We observe a significant negative offset for HDO and a small positive offset for H2O. A bias correctedδD′reads
5
δD′ =1000 ‰· c1·VCD(HDO)+1.4×10
21
c2·VCD(H2O)−4.6×10²⁰ 1 Rs
−1
! ,
with potential multiplicative errorsci in both vertical columns (caused by errors in line intensity and not quantified in this study). The negative offset in HDO would, if un-corrected, result in unphysical δD values and also lead to depletions approaching
−1000 ‰ for column densities around 5×10²¹mole cm−2. In other words, the slope
10
in a Rayleigh curve (δDvs. H2O) would be biased too steep, potentially affecting the interpretation of the results. We have neither found the root cause of the offset bias nor investigated the impact of erroneous broadening coefficients, which can lead to similar bias structures. Further complications may arise from the fact that both of these error terms can depend on the observed airmass, i.e., on season and latitude. However, the
15
validation exercise in the following section will provide confidence that our simple bias correction yields very good agreement with ground-based observations over Lamont, Oklahoma.
3 Validation against up-looking FTS over Lamont, Oklahoma
For this proof of concept study, we chose a single TCCON station to validate GOSAT
20
AMTD
5, 6357–6386, 2012Water vapor isotopologues from
GOSAT
C. Frankenberg et al.
Title Page
Abstract Introduction
Conclusions References
Tables Figures
◭ ◮
◭ ◮
Back Close
Full Screen / Esc
Printer-friendly Version Interactive Discussion
Discussion
P
a
per
|
Dis
cussion
P
a
per
|
Discussion
P
a
per
|
Discussio
n
P
a
per
|
(Wunch et al., 2010) but HDO results from TCCON itself are so far unvalidated. Re-trieval windows for all datasets used in this study are listed in Tables 1–2. For GOSAT and TCCON, there is a strong overlap of the retrieval windows in the 6300–6400 cm−1 range.
We use the official TCCON GFIT algorithm to retrieve column amounts from high
5
resolution up-looking near-infrared spectra. The GFIT retrieval scales an a priori profile, preserving its original shape. The H2O a priori profile is interpolated from NCEP 6-hourly data to the latitude, longitude, date, and local solar noon time at the site. The HDO a priori profile is generated from the NCEP H2O profile using an empirically-derived isotopic fractionation equation of HDO=H2OVMR0.16(8.0+log(H2OVMR)). At
10
the tropopause (H2OVMR=3×10⁻⁶) this equation gives HDO/H2O=0.4, whereas in the humid lower troposphere (H2OVMR=1×10−
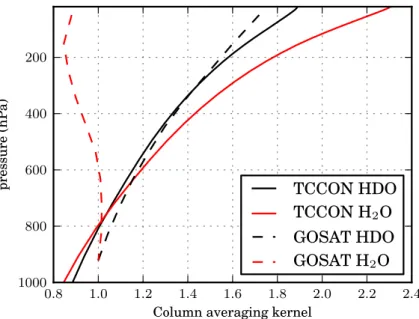
2
) the equation gives HDO/H2O=0.96. Owing to the overlap in retrieval windows, column averaging kernels for HDO are very similar for TCCON and GOSAT (see Fig. 3). Averaging kernels for H2O should ideally have little impact on retrieved columns as the a priori profile (NCEP for TCCON and
15
ECMWF for GOSAT) is relatively close to the truth as multiple sonde measurements per day over Lamont are assimilated into the numerical weather forecast fields. For TCCON and GOSAT H2O retrievals, their respective averaging kernels are substantially different. For TCCON, the column averaging kernel resembles the one for HDO with increasing sensitivity at lower pressures. This is mainly related to the fact that very
20
weak lines are fitted in a column scaling retrieval. For GOSAT, the H2O kernels are close to unity throughout the column while the HDO kernel is very close to TCCON.
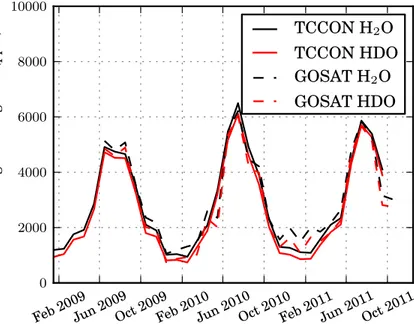
Figure 4 shows a time-series of retrieved HDO (scaled byRs) and H2O column densi-ties from GOSAT and the Lamont TCCON station with overlap from June 2009 through September 2011. Both columns are not bias corrected as it would hardly make a
dif-25
ference at this scale. Even though water vapor is highly variable and the coincidence criterion (±3◦) is not very stringent, the overall seasonal cycle shape as well as the
AMTD
5, 6357–6386, 2012Water vapor isotopologues from
GOSAT
C. Frankenberg et al.
Title Page
Abstract Introduction
Conclusions References
Tables Figures
◭ ◮
◭ ◮
Back Close
Full Screen / Esc
Printer-friendly Version Interactive Discussion
Discussion
P
a
per
|
Dis
cussion
P
a
per
|
Discussion
P
a
per
|
Discussio
n
P
a
per
|
summer peaks in 2010 and 2011 as well as the flat plateau for three consecutive months in 2009 are well reproduced. Values span a large dynamic range from about 0.1 % column averaged mixing ratio in winter to more than 0.6 % in summer (individual retrievals can approach 1 %).
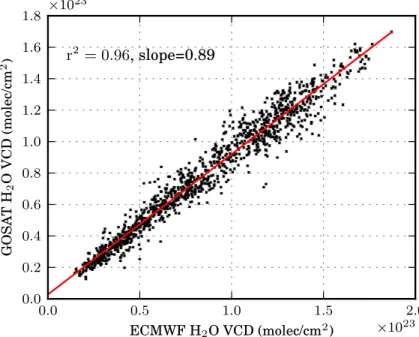
Figure 5 shows a scatterplot of (not bias-corrected) GOSAT vs. ECMWF H2O vertical
5
columns using all individual retrievals over Lamont (≈1400 soundings). The retrievals
are well correlated (r2=0.96) albeit with a slope significantly smaller than unity, sug-gesting that H2O is low-biased by about 10 % (resulting in a 100 ‰ high bias in δD′ caused by H2O; any additional errors in the HDO line-strength are difficult to quantify). Figure 6 shows the time-series ofδDmonthly means (and bias correctedδD′). It is
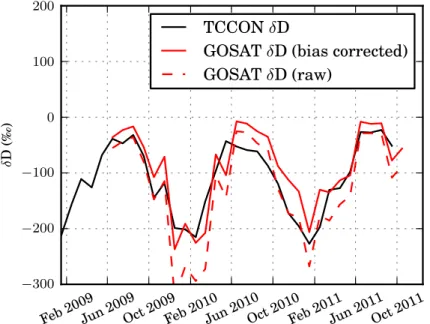
10
obvious that the raw retrievals (owing to the offset) lead to a depletion in winter that is too strong while the bias corrected δD′ exhibits similar magnitudes compared to
TCCON. The overall shape of the seasonal cycle is extremely well reproduced in 2009 and early 2010, even showing unique month-to-month variability such as in October to November 2009 (with a sudden increase in δD even though the columnar water
15
amount decreased). In the second half of 2010 and early 2011, the correlation seems to decrease somewhat with GOSAT showing a distinct single minimum in the winter of 2010/2011. However, potential sampling biases (due to the large coincidence criteria) can also result in mismatches between the satellite and the ground-based FTS. Also, both datasets exhibit an overall high-bias as depletions around−50–0 ‰ in summer are
20
unphysical over Lamont. Hence, we focus instead on variability rather than accuracy of absolute values.
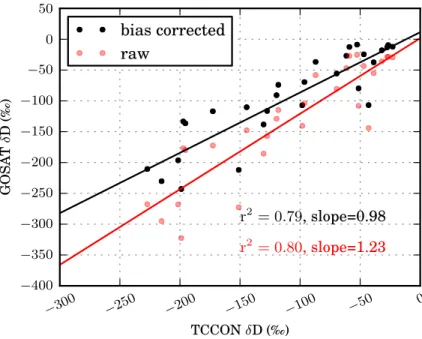
Looking at the overall correlation between GOSAT and TCCON, we find a correlation coefficientr2 of 0.79 and a slope of the linear fit of 0.98. Figure 7 shows the linear fit to the monthly averages. The raw retrievals are still very well correlated with TCCON
25
AMTD
5, 6357–6386, 2012Water vapor isotopologues from
GOSAT
C. Frankenberg et al.
Title Page
Abstract Introduction
Conclusions References
Tables Figures
◭ ◮
◭ ◮
Back Close
Full Screen / Esc
Printer-friendly Version Interactive Discussion
Discussion
P
a
per
|
Dis
cussion
P
a
per
|
Discussion
P
a
per
|
Discussio
n
P
a
per
|
independent datasets and that more rigorous validation work, such as in Schneider et al. (2010), both on the TCCON and GOSAT side, will be necessary on top of more sensitivity studies related to the retrieval setup as well as choice of spectroscopic pa-rameters.
4 Intercomparisons with SCIAMACHY
5
SCIAMACHY is currently the only independent satellite dataset we can directly com-pare with as it also measures in the short-wave infrared (hence has a similar sensi-tivity). Unfortunately, currently available SCIAMACHY retrievals do not coincide in time with GOSAT as detector degradation makes SCIAMACHY retrievals after 2005 com-plicated. An extension of the dataset is planned but so far, we can only compare the
10
two datasets regarding the spatial distribution ofδD at seasonal time-scales. For this particular comparison, we use recently improved SCIAMACHY retrievals from Scheep-maker et al. (2012).
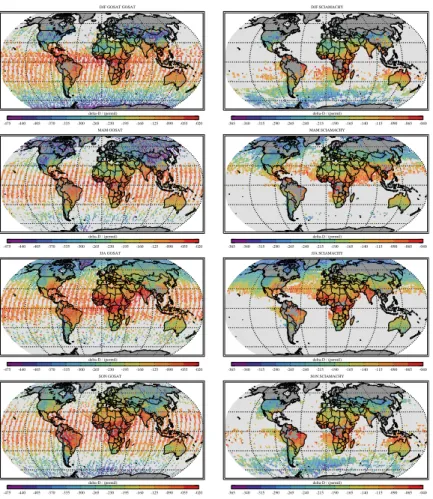
Figure 8 shows global averages for December–February (DJF), March–May (MAM), June–August (JJA) and September–November (SON). For GOSAT, we relaxed the
fil-15
ter criteria (esp. the CO2 and H2O ratio) to achieve high coverage in the tropics but most regions are hardly affected by this relaxation. One can see that the GOSAT glint viewing geometry over subtropical oceans results in a much higher data-yield. Over the oceans at higher latitudes, GOSAT takes regular Nadir observations and retrievals are so far only possible over low cloud layers having passed the simple filter (similar to
20
SCIAMACHY which does not have a dedicated glint mode).
Overall, the spatial patterns as well as the seasonal variations are very similar but a different value range for SCIAMACHY was chosen as δD variability is somewhat lower in SCIAMACHY. This manuscript is of a technical nature but some aspects of the global distribution are worth discussing here: in boreal summer, highestδD(larger
25
AMTD
5, 6357–6386, 2012Water vapor isotopologues from
GOSAT
C. Frankenberg et al.
Title Page
Abstract Introduction
Conclusions References
Tables Figures
◭ ◮
◭ ◮
Back Close
Full Screen / Esc
Printer-friendly Version Interactive Discussion
Discussion
P
a
per
|
Dis
cussion
P
a
per
|
Discussion
P
a
per
|
Discussio
n
P
a
per
|
et al., 1993) because transpiration is a non-fractionating process, which can result in lower atmospheric depletions than over oceans. Other aspects of the distribution and its application in studies of hydrological cycles are extensively discussed in, e.g., Berkelhammer et al. (2011); Lee et al. (2009); Risi et al. (2012a,b); Lee et al. (2012).
Also noteworthy from a more technical viewpoint is the fact that GOSAT retrievals
5
are very reliable over the oceans using the glint viewing geometry and also over land over some snow and ice areas such as Greenland. Both snow and ice have much lower surface albedos in the 2.3 µm range, making SCIAMACHY retrievals over these surface types problematic.
The lower variability of SCIAMACHY is apparent in Fig. 9: while correlation coeffi
-10
cients (r2) of seasonal grid box averages vary between 0.65 in SON and 0.83 in JJA, the slopes vary between 1.20 and 1.46, showing that both datasets are strongly cor-related but show a somewhat different variability in δD. Without the bias correction already applied to the GOSAT data, this discrepancy would increase by an additional 25 %. One prime candidate for the discrepancies with SCIAMACHY is the averaging
15
kernel for HDO for both GOSAT and TCCON. The column averaging kernels for HDO can well exceed unity while they are close to unity for SCIAMACHY. This can amplify both the latitudinal gradients as well as the seasonal amplitude in both GOSAT and TCCON (which compare well with each other as averaging kernels are similar) but not SCIAMACHY.
20
Despite the need for further research, the comparison with SCIAMACHY has shown that both datasets are well correlated even though they use entirely independent spec-trometers and spectral regions. Apart from the aforementioned averaging kernels, spectroscopy, detector artifacts, differences in cloud filtering as well as spatial and temporal mismatches can all be causes for the current discrepancies. More validation
25
AMTD
5, 6357–6386, 2012Water vapor isotopologues from
GOSAT
C. Frankenberg et al.
Title Page
Abstract Introduction
Conclusions References
Tables Figures
◭ ◮
◭ ◮
Back Close
Full Screen / Esc
Printer-friendly Version Interactive Discussion
Discussion
P
a
per
|
Dis
cussion
P
a
per
|
Discussion
P
a
per
|
Discussio
n
P
a
per
|
5 Conclusions
We have retrieved HDO and H2O vertical column densities using short-wave infrared spectra from the Japanese GOSAT satellite. Column averaged deuterium depletions δDof atmospheric water vapour are retrieved with a precision that allows interpretation of single measurements (20–40 ‰). The enhanced precision, application of a different
5
fitting window and small time-overlap is complementary to previous results from the SCIAMACHY instrument, which ceased operations in April 2012 and used the 2.3 µm range for HDO/H2O retrievals. We compared GOSAT results against observations from the ground-based up looking Fourier Transform Spectrometer site in Lamont (Okla-homa) and find a very good agreement in the timing and amplitude of the δD
sea-10
sonal cycle. Seasonal averages on the global scale also compare very well with the SCIAMACHY instrument, albeit with higher variability observed with GOSAT (poten-tially caused by differences in vertical sensitivity). While more sensitivity studies and validation exercises are warranted, we show that global retrievals of the composition of water vapour isotopologues from GOSAT are feasible and can provide a new
bench-15
mark for studies related to the hydrological cycle.
Appendix A
Derivation of effective pressure to include self-broadening effects
Under the assumption that the H2O self-broadening coefficient is about 5 times larger than the air-broadening coefficient, the effective broadening coefficient in air (with H2O)
20
reads:
γ=X γniVMR(ni)
(A1)
AMTD
5, 6357–6386, 2012Water vapor isotopologues from
GOSAT
C. Frankenberg et al.
Title Page
Abstract Introduction
Conclusions References
Tables Figures
◭ ◮
◭ ◮
Back Close
Full Screen / Esc
Printer-friendly Version Interactive Discussion
Discussion
P
a
per
|
Dis
cussion
P
a
per
|
Discussion
P
a
per
|
Discussio
n
P
a
per
|
=γair(1−VMR(H2O))+5γairVMR(H2O) (A3)
=γair(1+4VMR(H2O)) (A4)
Since the actual width of the line is the product ofγ with air pressure, a multiplication of the pressure with (1+4VMR(H2O) and subsequent use of justγair leads to a good
5
approximation of the final line-shape without the need to compute the self-broadening part explicitly.
Acknowledgements. Part of the research described in this paper was carried out by the Jet Propulsion Laboratory, California Institute of Technology, under a contract with the National Aeronautics and Space Administration. GOSAT Level 1B products (spectral data) were
pro-10
vided by the GOSAT Project (JAXA, NIES, and Ministry of the Environment Japan). US funding for TCCON comes from NASAs Terrestrial Ecology Program (NNX08A186G), the Orbiting Car-bon Observatory Program (NAS7-03001), the DOE/ARM Program and the Atmospheric CO2 Observations from Space Program. RS was funded by the Netherlands Space Office as part of the User Support Programme Space Research under project GO-AO/16.
15
References
Berkelhammer, M., Risi, C., Kurita, N., and Noone., D.: The moisture source sequence for the Madden-Julian Oscillation as derived from satellite retrievals of HDO, J. Geophys. Res., 116, D24101, doi:10.1029/2010JD015209, 2011. 6368
Bony, S. and Dufresne, J.: Marine boundary layer clouds at the heart of tropical
20
cloud feedback uncertainties in climate models, Geophys. Res. Lett., 32, L20806, doi:10.1029/2005GL023851, 2005. 6359
Bony, S., Colman, R., Kattsov, V. M., Allan, R., Bretherton, C., Dufresne, J.-L., Hall, A., Halle-gatte, S., Holland, M., Ingram, W., Randall, D., Soden, D., Tselioudis, G., and Webb, M.: How well do we understand and evaluate climate change feedback processes?, J. Climate, 19,
25
3445–3482, 2006. 6359
AMTD
5, 6357–6386, 2012Water vapor isotopologues from
GOSAT
C. Frankenberg et al.
Title Page
Abstract Introduction
Conclusions References
Tables Figures
◭ ◮
◭ ◮
Back Close
Full Screen / Esc
Printer-friendly Version Interactive Discussion
Discussion
P
a
per
|
Dis
cussion
P
a
per
|
Discussion
P
a
per
|
Discussio
n
P
a
per
|
Butz, A., Guerlet, S., Hasekamp, O., Schepers, D., Galli, A., Aben, I., Frankenberg, C., Hart-mann, J. M., Tran, H., Kuze, A., Keppel-Aleks, G., Toon, G., Wunch, D., Wennberg, P., Deutscher, N., Griffith, D., Macatangay, R., Messerschmidt, J., Notholt, J., and Warneke, T.: Toward accurate CO2and CH4observations from GOSAT, Geophys. Res. Lett., 38, L14812, doi:10.1029/2011GL047888, 2011. 6364
5
Frankenberg, C., Meirink, J. F., van Weele, M., Platt, U., and Wagner, T.: Assessing methane emissions from global space-borne observations, Science, 308, 1010–1014, doi:10.1126/science.1106644, 2005a. 6361
Frankenberg, C., Platt, U., and Wagner, T.: Iterative maximum a posteriori (IMAP)-DOAS for retrieval of strongly absorbing trace gases: Model studies for CH4 and CO2 retrieval from
10
near infrared spectra of SCIAMACHY onboard ENVISAT, Atmos. Chem. Phys., 5, 9–22, doi:10.5194/acp-5-9-2005, 2005b. 6361
Frankenberg, C., Bergamaschi, P., Butz, A., Houweling, S., Meirink, J. F., Notholt, J., Pe-tersen, A. K., Schrijver, H., Warneke, T., and Aben, I.: Tropical methane emissions: A revised view from SCIAMACHY onboard ENVISAT, Geophys. Res. Lett., 35, L15811,
15
doi:10.1029/2008GL034300, 2008. 6361
Frankenberg, C., Yoshimura, K., Warneke, T., Aben, I., Butz, A., Deutscher, N., Griffith, D., Hase, F., Notholt, J., Schneider, M., Schrijver, H., and Rockmann, T.: Dynamic processes governing lower-tropospheric HDO/H2O ratios as observed from space and ground, Science, 325, 1374–1377, doi:10.1126/science.1173791, 2009. 6359, 6361
20
Galewsky, J. and Hurley, J. V.: An advection-condensation model for subtropical water vapor isotopic ratios, J. Geophys. Res., 115, D16116, doi:10.1029/2009JD013651, 2010. 6359 Gat, J. R. and Matsui, E.: Atmospheric water balance in the Amazon Basin: an isotopic
evapo-transpiration model, J. Geophys. Res., 96, 13179–13188, 1991. 6359
Hamazaki, T., Kaneko, Y., Kuze, A., and Kondo, K.: Fourier transform spectrometer
25
for greenhouse gases observing satellite (GOSAT), P. Spie. Is. & T. Elect. Im., 5659, doi:10.1117/12.581198, 2005. 6360
Held, I. M. and Soden, B. J.: Robust responses of the hydrological cycle to global warming, J. Climate, 19, 5686–5699, 2006. 6358
Herbin, H., Hurtmans, D., Clerbaux, C., Clarisse, L., and Coheur, P.-F.: H162 O and HDO
mea-30
AMTD
5, 6357–6386, 2012Water vapor isotopologues from
GOSAT
C. Frankenberg et al.
Title Page
Abstract Introduction
Conclusions References
Tables Figures
◭ ◮
◭ ◮
Back Close
Full Screen / Esc
Printer-friendly Version Interactive Discussion
Discussion
P
a
per
|
Dis
cussion
P
a
per
|
Discussion
P
a
per
|
Discussio
n
P
a
per
|
Jenouvrier, A., Daumont, L., R ´egalia-Jarlot, L., Tyuterev, V. G., Carleer, M., Vandaele, A. C., Mikhailenko, S., and Fally, S.: Fourier transform measurements of water vapor line parame-ters in the 4200–6600 cm−1
region, J. Quant. Spectrosc. Ra., 105, 326–355, 2007. 6362 Kuang, Z., Toon, G. C., Wennberg, P. O., and Yung, Y. L.: Measured HDO/H2O ratios across
the tropical tropopause, Geophys. Res. Lett., 30, 1372, doi:10.1029/2003GL017023, 2003.
5
6359
Kuze, A., Suto, H., Nakajima, M., and Hamazaki, T.: Thermal and near infrared sensor for carbon observation Fourier-transform spectrometer on the Greenhouse Gases Observing Satellite for greenhouse gases monitoring, Appl. Optics, 48, 6716–6733, 2009. 6360 Lee, J.-E., Fung, I., DePaolo, D. J., and Otto-Bliesner, B.: Water isotopes during the Last Glacial
10
Maximum: New general circulation model calculations, J. Geophys. Res., 113, D19109, doi:10.1029/2008JD009859, 2008. 6359
Lee, J., Pierrehumbert, R., and Swann, A.: Sensitivity of stable water isotopic val-ues to convective parameterization schemes, Geophys. Res. Lett., 36, L23801, doi:10.1029/2009GL040880, 2009. 6368
15
Lee, J.-E., Risi, C., Fung, I., Worden, J., Scheepmaker, R. A., Lintner, B., and Frankenberg, C.: Asian monsoon hydrometeorology from TES and SCIAMACHY water vapor isotope mea-surements and LMDZ simulations: Implications for speleothem climate record interpretation, J. Geophys. Res., 117, D15112, doi:10.1029/2011JD017133, 2012. 6368
Morino, I., Uchino, O., Inoue, M., Yoshida, Y., Yokota, T., Wennberg, P. O., Toon, G. C.,
20
Wunch, D., Roehl, C. M., Notholt, J., Warneke, T., Messerschmidt, J., Griffith, D. W. T., Deutscher, N. M., Sherlock, V., Connor, B., Robinson, J., Sussmann, R., and Rettinger, M.: Preliminary validation of column-averaged volume mixing ratios of carbon dioxide and methane retrieved from GOSAT short-wavelength infrared spectra, Atmos. Meas. Tech., 4, 1061–1076, doi:10.5194/amt-4-1061-2011, 2011. 6364
25
Moyer, E. J., Irion, F. W., Yung, Y. L., and Gunson, M. R.: ATMOS stratospheric deuterated wa-ter and implications for troposphere-stratosphere transport, Geophys. Res. Lett., 23, 2385– 2388, doi:10.1029/96GL01489, 1996. 6359
Nassar, R., Bernath, P. F., Boone, C. D., Gettelman, A., McLeod, S. D., and Rinsland, C. P.: Variability in HDO/H2O abundance ratios in the tropical tropopause layer, J. Geophys. Res.,
30
112, D21305, doi:10.1029/2007JD008417, 2007. 6359
AMTD
5, 6357–6386, 2012Water vapor isotopologues from
GOSAT
C. Frankenberg et al.
Title Page
Abstract Introduction
Conclusions References
Tables Figures
◭ ◮
◭ ◮
Back Close
Full Screen / Esc
Printer-friendly Version Interactive Discussion
Discussion
P
a
per
|
Dis
cussion
P
a
per
|
Discussion
P
a
per
|
Discussio
n
P
a
per
|
Van Pelt, A., and Wright, J. S.: Properties of air mass mixing and humidity in the subtropics from measurements of the D/H isotope ratio of water vapor at the Mauna Loa Observatory, J. Geophys. Res., 116, D22113, doi:10.1029/2011JD015773, 2011. 6359
O’Dell, C. W., Connor, B., B ¨osch, H., O’Brien, D., Frankenberg, C., Castano, R., Christi, M., Eldering, D., Fisher, B., Gunson, M., McDuffie, J., Miller, C. E., Natraj, V., Oyafuso, F.,
Polon-5
sky, I., Smyth, M., Taylor, T., Toon, G. C., Wennberg, P. O., and Wunch, D.: The ACOS CO2 retrieval algorithm – Part 1: Description and validation against synthetic observations, Atmos. Meas. Tech., 5, 99–121, doi:10.5194/amt-5-99-2012, 2012. 6362
Parker, R., Boesch, H., Cogan, A., Fraser, A., Feng, L., Palmer, P., Messerschmidt, J., Deutscher, N., Griffith, D., Notholt, J., Wennberg, P., and Wunch, D.: Methane
observa-10
tions from the Greenhouse Gases Observing SATellite: comparison to ground-based TCCON data and model calculations, Geophys. Res. Lett., 38, L15807, doi:10.1029/2011GL047871, 2011. 6364
Randall, D., Wood, R., Bony, S., Colman, R., Fichefet, T., Fyfe, J., Kattsov, V., Pitma, A., Shukla, J., Srinivasan, J., Sumi, R. S. A., and Taylor, K.: Climate Change 2007: The Physical
15
Science Basis, Contribution of Working Group I to the Fourth Assessment Report of the In-tergovernmental Panel on Climate Change, chap. Climate model and their evaluation, edited by: Solomon, S., Qin, D., Manning, M., Chen, Z., Marquis, M., Averyt, K. B., Tignor, M. and Miller, H. L., Cambridge University Press, Cambridge, UK and New York, NY, USA, 2007. 6358
20
Risi, C., Bony, S., and Vimeux, F.: Influence of convective processes on the isotopic composition (δ18O andδD) of precipitation and water vapor in the tropics: 2. physical interpretation of the amount effect, J. Geophys. Res., 113, D19306, doi:10.1029/2008JD009943, 2008. 6359 Risi, C., Bony, S., Vimeux, F., and Jouzel, J.: Water-stable isotopes in the LMDZ4
gen-eral circulation model: model evaluation for present-day and past climates and
applica-25
tions to climatic interpretations of tropical isotopic records, J. Geophys. Res., 115, D12118, doi:10.1029/2009JD013255, 2010. 6360
Risi, C., Noone, D., Worden, J., Stiller, G., Kiefer, M., Funke, B., Walker, K., Bernath, P., Schneider, M., Wunch, D., Sherlock, V., Deutscher, N., Griffith, D., Wennberg, P., Strong, K., Smale, D., Mahieu, E., Barthlott, S., Hase, F., Garc´ıa, O., Notholt, J., Warneke, T.,
30
AMTD
5, 6357–6386, 2012Water vapor isotopologues from
GOSAT
C. Frankenberg et al.
Title Page
Abstract Introduction
Conclusions References
Tables Figures
◭ ◮
◭ ◮
Back Close
Full Screen / Esc
Printer-friendly Version Interactive Discussion
Discussion
P
a
per
|
Dis
cussion
P
a
per
|
Discussion
P
a
per
|
Discussio
n
P
a
per
|
vapor isotopologues: 1. comparison between models and observations, J. Geophys. Res., 117, D05303, doi:10.1029/2011JD016621, 2012a. 6368
Risi, C., Noone, D., Worden, J., Stiller, G., Kiefer, M., Funke, B., Walker, K., Bernath, P., Schnei-der, M., Bony, S., Lee, J., Brown, D., and Sturm, C.: Process-evaluation of tropospheric hu-midity simulated by general circulation models using water vapor isotopic observations: 2.
5
using isotopic diagnostics to understand the mid and upper tropospheric moist bias in the tropics and subtropics, J. Geophys. Res., 117, D05304, doi:10.1029/2011JD016623, 2012b. 6368
Salati, E., Dall’Olio, A., Matsui, E., and Gat, J. R.: Recycling of water in the Amazon Basin: an isotopic study, Water Resour. Res., 15, 1250–1258, 1979. 6359
10
Sayres, D. S., Pfister, L., Hanisco, T. F., Moyer, E. J., Smith, J. B., St Clair, J. M., O’Brien, A. S., Witinski, M. F., Legg, M., and Anderson, J. G.: Influence of convection on the water isotopic composition of the tropical tropopause layer and tropical stratosphere, J. Geophys. Res., 115, D00J20, doi:10.1029/2009JD013100, 2010. 6359
Scheepmaker, R. A., Frankenberg, C., Galli, A., Schrijver, H., Fally, S., Deutscher, N.,
15
Wunch, D., Warneke, T., and Aben, I.: Improved water vapour spectroscopy in the 4174– 4300 cm−1
region and its impact on SCIAMACHYs HDO/H2O measurements, Atmos. Meas. Tech., submitted, 2012. 6367
Schneider, M. and Hase, F.: Optimal estimation of tropospheric H2O andδDwith IASI/METOP, Atmos. Chem. Phys., 11, 11207–11220, doi:10.5194/acp-11-11207-2011, 2011. 6359
20
Schneider, M., Toon, G. C., Blavier, J.-F., Hase, F., and Leblanc, T.: H2O and δD profiles remotely-sensed from ground in different spectral infrared regions, Atmos. Meas. Tech., 3, 1599–1613, doi:10.5194/amt-3-1599-2010, 2010. 6367
Steinwagner, J., Fueglistaler, S., Stiller, G., von Clarmann, T., Kiefer, M., Borsboom, P.-P., van Delden, A., and Rockmann, T.: Tropical dehydration processes constrained by the
seasonal-25
ity of stratospheric deuterated water, Nat. Geosci., 3, 262–266, 2010. 6359
Stewart, M. K.: Stable isotope fractionation due to evaporation and isotopic exchange of falling waterdrops: applications to atmospheric processes and evaporation of lakes, J. Geophys. Res., 80, 1133–1146, 1975. 6359
Thompson, D. R., Benner, D. C., Brown, L. R., Crisp, D., Devi, V. M., Jiang, Y., Natraj, V.,
30
AMTD
5, 6357–6386, 2012Water vapor isotopologues from
GOSAT
C. Frankenberg et al.
Title Page
Abstract Introduction
Conclusions References
Tables Figures
◭ ◮
◭ ◮
Back Close
Full Screen / Esc
Printer-friendly Version Interactive Discussion
Discussion
P
a
per
|
Dis
cussion
P
a
per
|
Discussion
P
a
per
|
Discussio
n
P
a
per
|
Tian, L., Masson-Delmotte, V., Stievenard, M., Yao, T., and Jouzel, J.: Tibetan Plateau summer monsoon northward extent revealed by measurements of water stable isotopes, J. Geophys. Res., 106, 28081–28088, 2001. 6359
Toth, R. A.: Measurements of positions, strengths and self-broadened widths of H2O from 2900 to 8000 cm? 1: line strength analysis of the 2nd triad bands, J. Quant. Spectrosc. Ra., 94,
5
51–107, doi:10.1016/j.jqsrt.2004.08.042, 2005. 6362
Webster, C. and Heymsfield, A.: Water isotope ratios D/H,18O/16O,17O/16O in and out of clouds map dehydration pathways, Science, 302, 1742–1745, doi:10.1126/science.1089496, 2003. 6359
Worden, J., Noone, D., and Bowman, K.: Importance of rain evaporation and continental
con-10
vection in the tropical water cycle, Nature, 445, 528–532, doi:10.1038/nature05508, 2007. 6359
Wunch, D., Toon, G. C., Wennberg, P. O., Wofsy, S. C., Stephens, B. B., Fischer, M. L., Uchino, O., Abshire, J. B., Bernath, P., Biraud, S. C., Blavier, J.-F. L., Boone, C., Bow-man, K. P., Browell, E. V., Campos, T., Connor, B. J., Daube, B. C., Deutscher, N. M., Diao, M.,
15
Elkins, J. W., Gerbig, C., Gottlieb, E., Griffith, D. W. T., Hurst, D. F., Jim ´enez, R., Keppel-Aleks, G., Kort, E. A., Macatangay, R., Machida, T., Matsueda, H., Moore, F., Morino, I., Park, S., Robinson, J., Roehl, C. M., Sawa, Y., Sherlock, V., Sweeney, C., Tanaka, T., and Zondlo, M. A.: Calibration of the Total Carbon Column Observing Network using aircraft pro-file data, Atmos. Meas. Tech., 3, 1351–1362, doi:10.5194/amt-3-1351-2010, 2010. 6365
20
Wunch, D., Toon, G. C., Blavier, J. F. L., Washenfelder, R. A., Notholt, J., Connor, B. J., Grif-fith, D. W. T., Sherlock, V., and Wennberg, P. O.: The Total Carbon Column Observing Net-work, Philos. T. Roy. Soc. A, 369, 2087–2112, 2011a. 6362
Wunch, D., Wennberg, P. O., Toon, G. C., Connor, B. J., Fisher, B., Osterman, G. B., Franken-berg, C., Mandrake, L., O’Dell, C., Ahonen, P., Biraud, S. C., Castano, R., Cressie, N.,
25
Crisp, D., Deutscher, N. M., Eldering, A., Fisher, M. L., Griffith, D. W. T., Gunson, M., Heikki-nen, P., Keppel-Aleks, G., Kyr ¨o, E., Lindenmaier, R., Macatangay, R., Mendonca, J., Messer-schmidt, J., Miller, C. E., Morino, I., Notholt, J., Oyafuso, F. A., Rettinger, M., Robinson, J., Roehl, C. M., Salawitch, R. J., Sherlock, V., Strong, K., Sussmann, R., Tanaka, T., Thomp-son, D. R., Uchino, O., Warneke, T., and Wofsy, S. C.: A method for evaluating bias in global
30
AMTD
5, 6357–6386, 2012Water vapor isotopologues from
GOSAT
C. Frankenberg et al.
Title Page
Abstract Introduction
Conclusions References
Tables Figures
◭ ◮
◭ ◮
Back Close
Full Screen / Esc
Printer-friendly Version Interactive Discussion
Discussion
P
a
per
|
Dis
cussion
P
a
per
|
Discussion
P
a
per
|
Discussio
n
P
a
per
|
Table 1.Retrieval windows for HDO and H2O used for GOSAT and SCIAMACHY. GOSAT (cm−1
) SCIAMACHY (cm−1 )
AMTD
5, 6357–6386, 2012Water vapor isotopologues from
GOSAT
C. Frankenberg et al.
Title Page
Abstract Introduction
Conclusions References
Tables Figures
◭ ◮
◭ ◮
Back Close
Full Screen / Esc
Printer-friendly Version Interactive Discussion
Discussion
P
a
per
|
Dis
cussion
P
a
per
|
Discussion
P
a
per
|
Discussio
n
P
a
per
|
Table 2.Retrieval windows for HDO and H2O used for TCCON (center frequencies±range, interfering species in brackets).
TCCON H2O (cm−1
) TCCON HDO (cm−1
) 4565.20±1.250 (H2O CH4CO2) 4054.60±3.30 (H2O CH4) 4571.75±1.250 (H2O CH4CO2) 4116.10± 8.00 (H2O CH4) 4576.85±0.950 (H2O CH4) 4212.45±1.90 (H2O CH4) 4611.05±1.100 (H2O CH4) 4232.50±11.00 (H2O CH4CO) 4622.00±1.150 (H2O CO2) 6330.05±45.50 (H2O CO2) 4699.35±2.000 (H2O CO2N2O) 6377.40±50.20 (H2O CO2) 6076.90±1.975 (H2O CH4CO2HDO)
6099.35±0.475 (H2O CO2HDO) 6125.85±0.725 (H2O CH4CO2HDO) 6177.30±0.415 (H2O CH4CO2HDO) 6255.95±1.800 (H2O CO2HDO) 6301.35±3.950 (H2O CO2HDO) 6392.45±1.550 (H2O HDO) 6401.15±1.150 (H2O HDO CO2)
AMTD
5, 6357–6386, 2012Water vapor isotopologues from
GOSAT
C. Frankenberg et al.
Title Page
Abstract Introduction
Conclusions References
Tables Figures
◭ ◮
◭ ◮
Back Close
Full Screen / Esc
Printer-friendly Version Interactive Discussion
Discussion
P
a
per
|
Dis
cussion
P
a
per
|
Discussion
P
a
per
|
Discussio
n
P
a
per
|
−1.0 −0.5 0.0 0.5 1.0
∆
ra
d
ia
n
ce
×10−8
meas-mod,χ2
=2.53, SNR=443
2.0 2.5 3.0 3.5 4.0 4.5 5.0 5.5 6.0
R
a
d
ia
n
ce
/
(W
cm
−
2
sr
−
1
cm
−
1)
×10−7
measured modeled
6320 6340 6360 6380 6400 6420 6440
wavenumber / cm−1 −1.2
−1.0 −0.8 −0.6 −0.4 −0.2 0.0 0.2
J
a
cob
ia
n
×10−30
∂F/∂H2O
∂F/∂HDO
slope=1.59
AMTD
5, 6357–6386, 2012Water vapor isotopologues from
GOSAT
C. Frankenberg et al.
Title Page
Abstract Introduction
Conclusions References
Tables Figures
◭ ◮
◭ ◮
Back Close
Full Screen / Esc
Printer-friendly Version Interactive Discussion
Discussion
P
a
per
|
Dis
cussion
P
a
per
|
Discussion
P
a
per
|
Discussio
n
P
a
per
|
−0.2 0.0 0.2 0.4 0.6 0.8 1.0
ECMWF H2O VCD (molec/cm2) ×10 22 −0.8
−0.6
−0.4
−0.2
0.0
0.2
0.4
0.6
0.8
1.0
G
O
S
A
T
H
2
O
(H
D
O
)
V
C
D
(m
ol
ec
/c
m
2)
×1022
offset for H2O=4.60e+20
offset for HDO=-1.40e+21 75
50
25
AMTD
5, 6357–6386, 2012Water vapor isotopologues from
GOSAT
C. Frankenberg et al.
Title Page
Abstract Introduction
Conclusions References
Tables Figures
◭ ◮
◭ ◮
Back Close
Full Screen / Esc
Printer-friendly Version Interactive Discussion
Discussion
P
a
per
|
Dis
cussion
P
a
per
|
Discussion
P
a
per
|
Discussio
n
P
a
per
|
0.8 1.0 1.2 1.4 1.6 1.8 2.0 2.2 2.4
Column averaging kernel
200
400
600
800
1000
p
res
su
re
(h
P
a
)
TCCON HDO
TCCON H2O
GOSAT HDO
GOSAT H2O
AMTD
5, 6357–6386, 2012Water vapor isotopologues from
GOSAT
C. Frankenberg et al.
Title Page
Abstract Introduction
Conclusions References
Tables Figures
◭ ◮
◭ ◮
Back Close
Full Screen / Esc
Printer-friendly Version Interactive Discussion
Discussion
P
a
per
|
Dis
cussion
P
a
per
|
Discussion
P
a
per
|
Discussio
n
P
a
per
|
Feb200 9 Jun 2
009 Oct 2
009 Feb201
0 Jun 2
010 Oct 2
010 Feb201
1 Jun 2
011 Oct 2
011
0 2000 4000 6000 8000 10000
col
u
m
n
a
v
er
a
g
ed
m
ix
in
g
ra
ti
o
(p
p
m
) TCCON H2O
TCCON HDO
GOSAT H2O
GOSAT HDO
AMTD
5, 6357–6386, 2012Water vapor isotopologues from
GOSAT
C. Frankenberg et al.
Title Page
Abstract Introduction
Conclusions References
Tables Figures
◭ ◮
◭ ◮
Back Close
Full Screen / Esc
Printer-friendly Version Interactive Discussion
Discussion
P
a
per
|
Dis
cussion
P
a
per
|
Discussion
P
a
per
|
Discussio
n
P
a
per
|
0.0 0.5 1.0 1.5 2.0
ECMWF H2O VCD (molec/cm2) ×10 23
0.0
0.2
0.4
0.6
0.8
1.0
1.2
1.4
1.6
1.8
G
O
S
A
T
H
2
O
V
C
D
(m
ol
ec
/c
m
2)
×1023
r2= 0.96, slope=0.89
AMTD
5, 6357–6386, 2012Water vapor isotopologues from
GOSAT
C. Frankenberg et al.
Title Page
Abstract Introduction
Conclusions References
Tables Figures
◭ ◮
◭ ◮
Back Close
Full Screen / Esc
Printer-friendly Version Interactive Discussion
Discussion
P
a
per
|
Dis
cussion
P
a
per
|
Discussion
P
a
per
|
Discussio
n
P
a
per
|
Feb200 9 Jun 2
009 Oct 2
009 Feb201
0 Jun 2
010 Oct 2
010 Feb201
1 Jun 2
011 Oct 2
011 −300
−200 −100
0 100 200
δ
D
(‰)
TCCONδD
GOSATδD (bias corrected)
GOSATδD (raw)
AMTD
5, 6357–6386, 2012Water vapor isotopologues from
GOSAT
C. Frankenberg et al.
Title Page
Abstract Introduction
Conclusions References
Tables Figures
◭ ◮
◭ ◮
Back Close
Full Screen / Esc
Printer-friendly Version Interactive Discussion
Discussion
P
a
per
|
Dis
cussion
P
a
per
|
Discussion
P
a
per
|
Discussio
n
P
a
per
|
−30
0
−25
0
−20
0
−15
0
−10
0
−50
0
TCCONδD (‰) −400
−350 −300 −250
−200
−150
−100
−50
0 50
G
O
S
A
T
δ
D
(‰)
r2 = 0.79, slope=0.98
r2 = 0.80, slope=1.23 bias corrected
raw
AMTD
5, 6357–6386, 2012Water vapor isotopologues from
GOSAT
C. Frankenberg et al.
Title Page
Abstract Introduction
Conclusions References
Tables Figures
◭ ◮
◭ ◮
Back Close
Full Screen / Esc
Printer-friendly Version Interactive Discussion
Discussion
P
a
per
|
Dis
cussion
P
a
per
|
Discussion
P
a
per
|
Discussio
n
P
a
per
|
-475 -440 -405 -370 -335 -300 -265 -230 -195 -160 -125 -090 -055 -020 delta-D / (permil)
DJF GOSAT GOSAT
-365 -340 -315 -290 -265 -240 -215 -190 -165 -140 -115 -090 -065 -040 delta-D / (permil)
DJF SCIAMACHY
-475 -440 -405 -370 -335 -300 -265 -230 -195 -160 -125 -090 -055 -020 delta-D / (permil)
MAM GOSAT
-365 -340 -315 -290 -265 -240 -215 -190 -165 -140 -115 -090 -065 -040 delta-D / (permil)
MAM SCIAMACHY
-475 -440 -405 -370 -335 -300 -265 -230 -195 -160 -125 -090 -055 -020 delta-D / (permil)
JJA GOSAT
-365 -340 -315 -290 -265 -240 -215 -190 -165 -140 -115 -090 -065 -040 delta-D / (permil)
JJA SCIAMACHY
-475 -440 -405 -370 -335 -300 -265 -230 -195 -160 -125 -090 -055 -020 delta-D / (permil)
SON GOSAT
-365 -340 -315 -290 -265 -240 -215 -190 -165 -140 -115 -090 -065 -040 delta-D / (permil)
SON SCIAMACHY
Fig. 8. Spatial distribution of seasonal 2×2 degree grid box averages ofδD′ for GOSAT (left
AMTD
5, 6357–6386, 2012Water vapor isotopologues from
GOSAT
C. Frankenberg et al.
Title Page Abstract Introduction Conclusions References Tables Figures ◭ ◮ ◭ ◮ Back Close
Full Screen / Esc
Printer-friendly Version Interactive Discussion Discussion P a per | Dis cussion P a per | Discussion P a per | Discussio n P a per |
−400−350−300−250−200−150−100−50 0 50
SCIAMACHYδD (‰) −600 −500 −400 −300 −200 −100 0 100 G O S A T δ D (‰)
r2= 0
.71, slope=1.40
DJF
−400−350−300−250−200−150−100−50 0 50
SCIAMACHYδD (‰) −600 −500 −400 −300 −200 −100 0 100 G O S A T δ D (‰)
r2= 0
.67, slope=1.46
MAM
−400−350−300−250−200−150−100−50 0 50
SCIAMACHYδD (‰) −600 −500 −400 −300 −200 −100 0 100 G O S A T δ D (‰)
r2= 0.83, slope=1.20
JJA
−400−350−300−250−200−150−100−50 0 50
SCIAMACHYδD (‰) −600 −500 −400 −300 −200 −100 0 100 G O S A T δ D (‰)
r2= 0.65, slope=1.20
SON