www.atmos-chem-phys.net/10/6179/2010/ doi:10.5194/acp-10-6179-2010
© Author(s) 2010. CC Attribution 3.0 License.
Chemistry
and Physics
Measured and modeled humidification factors of fresh smoke
particles from biomass burning: role of inorganic constituents
J. L. Hand1, D. E. Day1, G. M. McMeeking2,*, E. J. T. Levin2, C. M. Carrico2, S. M. Kreidenweis2, W. C. Malm3, A. Laskin4, and Y. Desyaterik4,2
1Cooperative Institute for Research in the Atmosphere, Colorado State University, Fort Collins, Colorado, USA 2Department of Atmospheric Science, Colorado State University, Fort Collins, Colorado, USA
3National Park Service, Cooperative Institute for Research in the Atmosphere, Colorado State University, Fort Collins, Colorado, USA
4William R. Wiley Environmental Molecular Sciences Laboratory, Pacific Northwest National Laboratory, Richland Washington, USA
*now at: Center for Atmospheric Science, University of Manchester, Manchester, UK Received: 27 January 2010 – Published in Atmos. Chem. Phys. Discuss.: 12 February 2010 Revised: 15 June 2010 – Accepted: 21 June 2010 – Published: 9 July 2010
Abstract. During the 2006 FLAME study (FireLaboratory atMissoulaExperiment), laboratory burns of biomass fuels were performed to investigate the physico-chemical, optical, and hygroscopic properties of fresh biomass smoke. As part of the experiment, two nephelometers simultaneously mea-sured dry and humidified light scattering coefficients (bsp(dry)
andbsp(RH), respectively) in order to explore the role of
rel-ative humidity (RH) on the optical properties of biomass smoke aerosols. Results from burns of several biomass fuels from the west and southeast United States showed large vari-ability in the humidification factor (f(RH)=bsp(RH)/bsp(dry)).
Values off(RH) at RH=80–85% ranged from 0.99 to 1.81 depending on fuel type. We incorporated measured chemical composition and size distribution data to model the smoke hygroscopic growth to investigate the role of inorganic com-pounds on water uptake for these aerosols. By assuming only inorganic constituents were hygroscopic, we were able to model the water uptake within experimental uncertainty, sug-gesting that inorganic species were responsible for most of the hygroscopic growth. In addition, humidification factors at 80–85% RH increased for smoke with increasing inorganic salt to carbon ratios. Particle morphology as observed from
Correspondence to:J. L. Hand
(hand@cira.colostate.edu)
scanning electron microscopy revealed that samples of hy-groscopic particles contained soot chains either internally or externally mixed with inorganic potassium salts, while sam-ples of weak to non-hygroscopic particles were dominated by soot and organic constituents. This study provides fur-ther understanding of the compounds responsible for water uptake by young biomass smoke, and is important for accu-rately assessing the role of smoke in climate change studies and visibility regulatory efforts.
1 Introduction
a combination of biomass fuels of varying moisture, under a variety of flame conditions and is also affected by atmo-spheric aging. Previous studies have provided a wealth of data for ambient biomass smoke properties and are neces-sary to understand smoke behavior in the atmosphere. How-ever, measurements performed in combustion facilities also provide opportunities to further investigate specific biomass smoke properties under known conditions, such as for a given fuel type and flame condition.
TheFire LaboratoryatMissoulaExperiment (FLAME) was designed to investigate many important questions re-garding smoke properties from biomass burning. These ex-periments were conducted at the US Forest Service’s Fire Science Laboratory in Missoula MT in 2006 and 2007. Re-sults from several subsets of these experiments include parti-cle and gas emissions (McMeeking et al., 2009; Chakrabarty et al., 2006; Chen et al., 2006, 2007; Engling et al., 2006; Smith et al., 2009; Laskin et al., 2009), smoke marker prop-erties (Sullivan et al., 2008), particle physical and optical properties (Hopkins et al., 2007; Lewis et al., 2009; Levin et al., 2010), aerosol hygroscopicity, cloud condensation and ice nucleation ability (Day et al., 2006; Carrico et al., 2008, 2010; Petters et al., 2009; Demott et al., 2009). Burns were performed on fuels that represented biomass found in loca-tions often involved in wild and prescribed fires, such as in the western and southeastern United States (McMeeking et al., 2009).
The focus of this paper is the hygroscopic properties of biomass smoke measured during FLAME 2006. Quantify-ing the behavior of aerosols with respect to changQuantify-ing relative humidity (RH) is necessary for accurately estimating their role in climate forcing (Hansen et al., 2005) visibility degra-dation (Malm et al., 2005), cloud nucleating ability (Vestin et al., 2007; Petters et al., 2009), and health effects (Naeher et al., 2007). One description of the hygroscopic response of a particle is the diameter growth factor, GF, defined as the ratio of particle diameter at a specific relative humidity to the dry particle diameter (GF=Dp(RH)/Dp(dry)). However,
estimating the effects of RH on aerosol radiative properties requires additional information, such as changes in particle mass, composition, size, shape and morphology as a func-tion of RH, as these properties also affect the amount of light scattered by a particle. The humidification factor, f(RH), describes changes in particle light scattering as a function of RH and is defined as the ratio of light scattering coefficients (bsp)of humidified to dry aerosols (f(RH)=bsp(RH)/bsp(dry)).
A computedf(RH) value for a pure, spherical inorganic salt particle composed of ammonium sulfate with a mass mean diameter of 0.4 µm and geometric standard deviation of 1.9 is 3.1 at 80–85% RH, implying that these humidified particles scatter three times as much light as compared to dry con-ditions. An experimental humidification factor is typically determined by parallel measurements of light scattering co-efficients under dry and humidified conditions (e.g. Day et al., 2000; Malm et al., 2003).
Previous results of f(RH) for biomass smoke particles demonstrate a wide range of estimates. Comparisons of f(RH) from various studies is complicated by the fact that the definitions of “dry” and “humidified” vary per study. Typically, humidified RH values range from 80–90%, and al-though dry RH often range between 10–30%, particles may still absorb or retain water at RH values considered “dry”. Day et al. (2006) summarizedf(RH) values for a variety of locations and platforms, including aircraft, ground-based and laboratory studies. Observations off(RH) ranged from 1.01 to 2.1 (RH=80–90%) for ambient smoke; the same range of f(RH) was observed for measurements in combustion fa-cilities (Day et al., 2006; Lewis et al., 2009). The range of results undoubtedly was due to the range of RH values, the variety of fuel types and conditions, chemical composi-tion of the smoke and the degree of aging and processing in the atmosphere. For example, smoke sampled in associ-ation with regional haze could be significantly mixed with inorganic species in the atmosphere that could alter hygro-scopic properties of the particles (Li et al., 2003; P´osfai et al., 2003; Semeniuk et al., 2007; Zhang et al., 2008; Khalizov et al., 2009). In fact, Malm et al. (2005) found thatf(RH) for days-old smoke in Yosemite National Park CA increased from 1.2 to∼2.0 as the ratio of organic carbon mass to am-monium sulfate mass decreased. Laboratory measurements off(RH) for young (minutes- to hours-old) smoke reported by Day et al. (2006) were 1.01–1.76 (RH=80–90%), demon-strating a significant range in the hygroscopic properties of unprocessed young smoke. Comprehensive measurements performed during FLAME 2006 study allowed us to inves-tigate the range off(RH) for young biomass smoke in the laboratory, as well as modelf(RH) as a function of RH.
Modeling of aerosol humidification factors requires pre-dicting changes in aerosol physical and optical properties as a function of RH and aerosol water content. Thermodynamic equilibrium models such as the Extended Aerosol Inorganic Model (E-AIM) (Clegg et al., 1998) allow for the prediction of aerosol water content as a function of RH. Aerosol water content for an aerosol mixture can be computed using the Zdanovskii-Stokes-Robinson (ZSR) approach (Stokes and Robinson, 1966) wherein the amount of water associated with a mixture of compounds is the sum of the water content from the individual species. Computing changes in aerosol size (GF), physical and optical properties as a function of RH is straightforward once the aerosol water content is known. Mie theory is used to compute light scattering coefficients for spherical particles as a function of changing particle size and optical properties. We modeledf(RH) by applying thermo-dynamic models and Mie theory to aerosol chemical com-position and size distributions measured during the FLAME 2006 study.
with particle size, bulk PM2.5composition and morphology measurements. Combining all of these data sets in a mod-eling framework provided for the interpretation of aerosol hygroscopicity for very young, unprocessed (by the atmo-sphere) smoke. The manuscript is organized in the following way. Following the introduction, Sect. 2 describes the exper-iments conducted during FLAME 2006, including light scat-tering coefficient measurements (2.1), chemical composition (2.2), size distributions (2.3), scanning electron microscopy (2.4) and particle diameter growth factors (2.5). Section 3 provides a description of the modeling technique for com-putingf(RH). Results are discussed in Sect. 4 and include reports of uncertainties and sensitivity studies. A summary is provided in Sect. 5.
2 Experimental methods
Controlled burns and measurements were conducted at the United States Forest Service Rocky Mountain Research Sta-tion Fire Sciences Laboratory in Missoula MT from 21 May to 9 June 2006. Details describing the facility and exper-imental protocols have been reported elsewhere (e.g. Day et al., 2006; Chen et al., 2006; Chakrabarty et al., 2006; McMeeking et al., 2009; Petters et al., 2009; Lewis et al., 2009; Carrico et al., 2010; Levin et al., 2010). Aerosol and gas-phase measurements were performed after the cham-ber was filled with smoke and instruments sampled smoke directly. A measured quantity of biomass (approximately 200 g) was burned on a continuously weighed platform in the middle of the chamber. Fuels were ignited with a propane torch at the edge of the fuel, resulting in a flame front prop-agating through the fuel and both flaming and smoldering conditions occurring simultaneously. The fire was allowed to extinguish naturally and the measurements continued for approximately two hours. Typically three to four burns were performed a day. In this manuscript, we present results from fourteen fuels.
A thorough discussion of fuel types and their origin is pro-vided by McMeeking et al. (2009). We grouped the fuels into four main categories. The first category, “Forest/Pine”, included ponderosa pine, lodgepole pine and southern pine. The second category, “Brush”, included southern Califor-nia chamise, southern CaliforCalifor-nia manzanita, Utah juniper, Utah sage and rabbitbrush, and southern California cean-othus. “Southeastern/Tropical”, the third category, included Puerto Rico fern, Puerto Rico wood, and southeastern wax myrtle. A final category of “Other” included ponderosa pine duff, Alaskan duff and lignin. A combination of woody ma-terial, needles and leaves were burned for each type, except for the duff fuels which included the decayed biomass on the forest floor as well as the top layer of the soil. The fuel was dried before burning if it did not dry out sufficiently during shipping; fuel moisture contents were reported by McMeek-ing et al. (2009).
2.1 Light scattering coefficients
Two nephelometers (model M903, wavelength of 530 nm, Radiance Research Inc., Seattle, Washington) measured light scattering coefficients. The experimental design was similar to that used in a previous FLAME experiment (Day et al., 2006) and described in detail by Day et al. (2000). Both nephelometers sampled through identical plumbing that was connected to a PM2.5 cyclone (URG, Chapel Hill, North Carolina) and a sampling inlet that allowed for the control of relative humidity. RH and temperature were monitored at the entrance and exit of the nephelometers using hygro-clip sensors (Rotronic Instruments (UK) LTD, West Sussex, UK) with a reported accuracy of±1.5% RH at 23◦C. The RH sensors were calibrated against a dew point hygrometer plus RTD dry bulb temperature sensor (General Eastern Op-tica, Williston, Vermont) interfaced to a humidity generator (Model 2000, Kaymont, Huntington Station, New York) with reference probes calibrated using standard salt solutions. An error of±3% was estimated to reflect uncertainty in RH in-side the nephelometer due to temperature fluctuations. Also, RH at the inlet and outlet of the nephelometer can vary due to heating in the nephelometer chamber. A small change in temperature (∼1◦) can result in a significant change in RH at
high RH (∼5% at 95% RH) (Day et al., 2000). Although the temperature and RH were monitored at the inlet and outlet of the nephelometer, the exact RH and temperature inside the instrument may be slightly different. Therefore we used the average RH of the inlet and outlet sensor to represent condi-tions in the nephelometer chamber. The sample RH was con-trolled using diffusion tubes (Perma Pure LLC, Toms River, New Jersey).
Calibrations of the nephelometers with dry, filtered air and SUVA (HFC 134a) span gas were performed daily. The fil-tered air was used as a zero-point calibration and SUVA was used as a high calibration point. During periods of low RH (<25%), discrepancies inbsp values of 2–5% between the two nephelometers were observed (humidified nephelometer was biased high) but were within expected uncertainties (An-derson et al., 1996). Data from the humidified nephelometer were normalized to the dry nephelometer data using linear regression equations derived from the comparisons of data during dry conditions. For burns with no data corresponding to RH<25% for both instruments, corrections from an ex-periment earlier or later in the same day were applied. The sample RH of the dry nephelometer measurement was main-tained between 20–25%. After the biomass was ignited, the RH that corresponded to the humidified nephelometer was increased from 20–25% to over 80% over a period of one to two hours and the light scattering coefficients were mea-sured as the aerosols were humidified. Values ofbsp, RH and temperature were logged on a 5-second time interval.
bsp derived from calibration data (one standard deviation) were typically 5–8%. Comparisons of the normalized data from ten burns from both nephelometers during periods cor-responding to low RH (<25%) are shown in Fig. 1. Error bars reflected that the measurement uncertainty accounted for differences between the two instruments and no addi-tional biases in the data were observed. The uncertainty in f(RH) was computed by propagating the calibration and nor-malization uncertainties inbspand was approximately±0.08 or less for all burns. We estimated that background aerosols may be contributing at most 0.03 to measuredf(RH) by as-suming all of thebspmeasured during the chamber vents was due to ammonium sulfate. This contribution was likely an overestimate and well within our experimental uncertainty. 2.2 Chemical composition
The IMPROVE (Interagency Monitoring of Protected Vi-sual Environments) network sampler (Malm et al., 2004) was used to collect smoke particulate matter for PM2.5chemical speciation and gravimetric mass analysis. The IMPROVE sampler consists of four independent modules; the three used during FLAME were equipped with a 2.5 µm cyclone. Mod-ule A consisted of a Teflon filter that was analyzed for gravi-metric fine (PM2.5)mass and elements with atomic num-ber ≥11 (Na) and ≤82 (Pb) by XRF (X-ray florescence). Ion concentrations were determined using ion chromatog-raphy from samples obtained from a nylon filter in mod-ule B. Modmod-ule C utilized quartz fiber filters for sample col-lection from which carbon was analyzed using thermal op-tical reflectance (TOR) techniques to separate organic car-bon (OC) from light-absorbing carcar-bon (LAC) (Chow et al., 2007). We assumed that the aerosols were internally mixed and composed of inorganic salt species (KCl, K2SO4, KNO3, (NH4)2SO4, NH4Cl and NaCl), carbon (POM, particulate or-ganic matter, and LAC) and soil (Al2O3and CaO) following Levin et al. (2010). Potassium salts are commonly observed in biomass smoke emissions (e.g. P´osfai et al., 2003; Freney et al., 2009;, Semeniuk et al., 2007; Lewis et al., 2009) and in fact potassium and chloride were the most abundant ions from the emissions from most of these burns. Organic carbon was converted to POM by multiplying OC by a molecular carbon to organic carbon multiplier.
The molecular carbon to organic carbon multiplier is nec-essary to account for other elements associated with the or-ganic carbon composition (Turpin and Lim, 2001). Values can range from 1 to greater than 2 depending on sources and atmospheric processing (Turpin and Lim, 2001; Rus-sell, 2003; El-Zanan et al., 2005; Malm and Hand, 2007). We derived estimates of the multiplier using a mass bal-ance approach by forcing closure between measured PM2.5 gravimetric and reconstructed mass within 5 µg m−3 (typi-cally<3% of mass). The values obtained ranged from 1.4 to 2.5, with an average and one standard deviation of 1.7±0.3, depending on the burn. While we recognize these values
bsp from all burns with RH<25%
0 200 400 600 800 1000
bsp (Mm
-1
) from "dry" nephelometer 0
200 400 600 800 1000
bsp
(Mm
-1 ) from "humidified" nephelometer
Fig. 1.Comparison of dry (RH<25%)bsp(Mm−1, wavelength of
530 nm) for ten burns.
were subject to uncertainties inherent in the mass balance ap-proach (e.g. El-Zanan et al., 2005; Malm and Hand, 2007), the derived estimates were consistent with previous litera-ture for biomass burning samples (Reid et al., 2005a; Malm et al., 2005; Turpin and Lim, 2001). Further discussion of the multiplier and the sensitivity off(RH) will be presented in Sect. 4.
2.3 Particle size distributions
Particle number concentrations as a function of size were measured using a differential mobility particle sizer (DMPS, TSI, Minneapolis, Minnesota) that included a differential mobility analyzer (TSI 3081) and associated condensation particle counter (TSI 3785). A total of 24 bins were used with a diameter range of 0.04< Dp<0.65 µm. The sample was not dried because the RH of the burn chamber was typi-cally lower than 20%. More details regarding the size distri-bution measurements were provided by Levin et al. (2010). From the 10 min dry aerosol number distributions we com-puted an average size distribution over the entire (∼2 h) burn. In some cases the size distributions evolved over the burn du-ration, in other cases it remained fairly stable (see Levin et al., 2010). Results from both McMeeking et al. (2009) and Levin et al. (2010) indicated that the size distributions were dominated by accumulation mode particles. Sensitivity of f(RH) to the variability of the size distribution will be dis-cussed in Sect. 4.
the DMPS mass by a factor of six in some cases. Recall that the IMPROVE sampler is a PM2.5sampler while the DMPS sampled particles up to 0.65 µm in diameter, so it was ex-pected that the DMPS would actually underestimate particu-late mass given the differences in the upper size limits. Previ-ous studies have shown that when using the DMPS to sample non-spherical particles sizing discrepancies can occur (e.g. Kr¨amer et al., 2000; Schneider et al., 2006; Khalizov et al., 2009). As we will show in Sect. 4, many of the burns yielded fractal particles containing long-chains of soot as observed in scanning electron microscope (SEM) images. In fact, the largest discrepancies in mass corresponded to samples dom-inated by aggregated soot chains. To account for the effects of non-sphericity on size distributions, we used the dynamic shape factor,χ, defined as the ratio of the actual resistance force of a non-spherical particle to the resistance force of a sphere having the same velocity and volume (Hinds, 1999). For our application,χ relates the equivalent diameter (Dp) to the mobility diameter (Dm)by Eq. (1):
χ=Dm Dp
(1) A shape factor ofχ=1 corresponds to a sphere and for irreg-ularly shaped particles or agglomerates it can be as high as 2 or more (Baron and Willeke, 1993). Shape factors were de-rived by dividing the DMPS-dede-rived mass by the IMPROVE gravimetric fine mass and taking the cubed root. The val-ues ranged from 0.8 to 1.8 with an average and one standard deviation of 1.3±0.3. These shape factors were in the range reported by Kr¨amer et al. (2000) for sodium chloride crystals, and for biomass smoke (Schneider et al., 2006; Gwaze et al., 2006). The highest values corresponded to the burns with ag-glomerates of soot chains viewed by SEM images, consistent with observation made earlier of the comparisons with the largest discrepancies in mass. There were three cases when χ <1 (ponderosa pine duff, Alaska duff and ceanothus); val-ues less than one are physically unrealistic and reflect the uncertainties in the estimates. For example, values ofχ ob-viously were sensitive to the derived densities used to com-pute mass, as well as any discrepancies in the volume or mass concentrations. We adjusted the size distributions by divid-ing bin diameters by the shape factors derived for each burn. Sensitivity of f(RH) to the application of the shape factor will be discussed in Sect. 4.
2.4 Scanning electron microscopy analysis
Particles were collected onto transmission electron micro-scope filmed grid substrates (Carbon type B on Cu 400 mesh grids, Ted Pella Inc. Redding, California) for scanning elec-tron microscopy analysis using a rotating cascade impactor (MOUDI, model 110, MSP, Inc.). Scanning electron mi-croscopy imaging of collected samples and X-ray microanal-ysis of particles were performed at the Environmental Molec-ular Sciences Laboratory (Richland, WA), using a FEG XL30
digital scanning electron microscope (FEI, Inc.) equipped with an energy dispersed X-ray (EDX) spectrometer (EDAX, Inc.). Specific details of the SEM/EDX analysis of particles deposited onto filmed grid substrates are described elsewhere (Laskin et al., 2006, and references therein).
2.5 Growth Factors (GF)
Particle diameter growth factors (GF) were measured us-ing a hygroscopic tandem differential mobility analyzer (HTDMA). The HTDMA includes a DMA that selected a nearly-monodisperse aerosol sample (in this case, particles of 100 nm mobility diameter), followed by a conditioning system that subjected the particles to controlled water sub-saturated environment (Rader and McMurry, 1986). A sec-ond DMA classifier measured the size distributions of hu-midified particles. Measurements were made at eight RH val-ues ranging from 40% to 95%. A detailed description of the experimental protocol was reported by Carrico et al. (2008, 2010). All experiments were conducted such that particles were initially dry (RH<15%) and then exposed to a pre-set higher RH before being measured by the second DMA. Growth factors were defined as the ratio of the humidified diameter to the dry diameter. The estimated uncertainty in GF was 0.02 for spherical particles, combined with an esti-mated uncertainty in RH of 2% (Carrico et al., 2010).
3 Modeled Humidification Factors (f(RH))
Modeling of humidification factors (f(RH)) as a function of RH required knowledge of the changes in particle compo-sition, size and optical properties due to changes in aerosol water content. Thermodynamic equilibrium models required aerosol chemical composition data and provided aerosol wa-ter content as a function of RH. Aerosol wawa-ter content was then used to calculate changes in particle size (GF), mass and composition. Particle light scattering coefficients were com-puted by applying Mie theory to measured size distributions while incorporating variations in particle size and refractive index as a function of RH.
allowed for the varying of RH from 10–99% at a tempera-ture of 298.15 K only. While E-AIM provided an option for hygroscopic growth from organic species, we did not apply it in this application, as we were interested in the role of in-organic species.
The diameter growth factor, GF, for the inorganic aerosol mixture was computed using Eq. (2).
GF=
h
MRH
ρRH
.
Mdry
ρdry
i1/3
(2) The dry mass and density are Mdry andρdry, respectively. The humidified mass (MRH)is the sum of the dry mass and the derived aerosol water content as a function of RH from E-AIM. The humidified density (ρRH)was computed using volume-mixing rules (Hasan and Dzubay, 1983; Ouimette and Flagan, 1982) shown in Eq. (3).
¯
ρ−1=X
i
Xi
ρi
(3)
The mass fraction for a given species (i)isXi and the
den-sity is ρi. The values ofρi for each species are listed in
Table 1. The POM concentrations used in this calculation corresponded to the values derived from mass closure. In the case of dry mixture density, the mass fractions and den-sities were summed over each individual dry species. In the case of the humidified density, the dry mixture density and water density were summed. Dry mixture densities (inor-ganic salts + carbon + soil) ranged from 1.42–1.95 g cm−3 for all of the burns, with an average and one standard devia-tion of 1.6±0.2 g cm−3. The dry densities for each burn are listed in Table 2. These values are somewhat higher than the prior estimates of biomass burning aerosol densities of 1.2– 1.4 g cm−3(Reid et al., 2005a) but are consistent with Levin et al. (2010).
The mixture GF was computed using Eq. (4) following Malm and Kreidenweis (1997) who invoked the Zdanovskii-Stokes-Robinson (ZSR) assumption (Stokes and Robinson, 1966).
GF3=ρdry ρRH
(X
i
Xi
ρRH,i
ρdry,i
(GFi)3) (4)
The growth factor for speciesi at a given RH is GFi. The
mixture dry density isρdryand the humidified mixture den-sity isρRH. The species included were inorganic salts, car-bon (POM+LAC) and soil. The GF values for POM, LAC and soil were set equal to one and held constant with RH, and their densities were fixed at the values listed in Table 1. GF curves were computed for both deliquescence and metastable equilibrium. Both curves were normalized to one (GF=1) at the RH corresponding to the dry HTDMA measurements. This normalization resulted in suppression of the metastable curve below the deliquescence curves at high RH. This sup-pression was most pronounced for cases when metastable
Table 1.Density and refractive index for the species used to model
aerosol optical and physical properties. OC and LAC correspond to organic carbon and light absorbing carbon, respectively. Refractive indices correspond to a wavelength of 530 nm.
Species Density (g cm−3) Refractive index
KCl 1.76 1.53a
K2SO4 1.83 1.51a
KNO3 1.78 1.47a
NH4Cl 1.8 1.41a
(NH4)2SO4 1.725 1.55b
Al2O3 2.165 1.54a
CaO 1.984 1.49a
OC 1.4 1.55b,c
LAC 2 1.96-0.66ib
aLide et al. (2008)bSeinfeld and Pandis (1998)cDick et al. (2000)
equilibrium predicted considerable water at low RH condi-tions. In the absence of the normalization the two curves agreed above the deliquescence RH.
Comparisons of modeled and measured GF are shown for weak to non-hygroscopic smoke (ponderosa pine) and for a more hygroscopic smoke (sage/rabbit brush) in Figs. 2 and 3, respectively. The measured GF values corresponded to 100 nm diameter particles only, while the modeled GF were derived from IMPROVE PM2.5bulk mass concentra-tions. Dry RH for the measured and modeled GF was the same. The modeled GF for smoke particles from burns of ponderosa pine (Fig. 2) were flat as a function of RH and showed no significant difference between both meth-ods (labeled “metastable” and “deliquescence”). The mea-sured GF fell slightly above these curves (outside of exper-imental uncertainty, 0.02) but did not demonstrate any mea-sureable growth with increased RH. In contrast, the modeled GF curves for sage/rabbit brush increased continuously with RH for the metastable curve while the deliquescence curve showed additional water uptake around 70% RH. The dif-ferences between the modeled curves at high RH reflect the normalization discussed earlier. The measured GF values fell between these two curves for RH>85%, suggesting the mod-eled curves were representing the hygroscopic properties of particles during this burn. We present these comparisons to demonstrate the typical agreement observed between mea-sured and modeled GF for each burn; more details regarding measured GF can be found in Carrico et al. (2010).
The GF curves were applied to the measured size distri-butions to compute aerosol light scattering coefficients as a function of RH. Refractive indices (n¯=m−ki)were
Table 2.Measured and derived smoke characteristics for biomass fuels burned during FLAME 2006. Shape factors (χ) were derived from DMPS data (see text), POM/OC refers to the multiplier used to convert organic carbon (OC) to particulate organic matter (POM). Density and refractive index correspond to the dry mixed aerosol. “Carbon mass fraction” refers to the sum of POM and light absorbing carbon (LAC), while the “inorganic” refers to salts only and is divided by the sum of OC and LAC. Measuredf(RH) is reported for RH=80–85%, with dry RH=20–25%, wavelength of 530 nm and experimental uncertainty of±0.08. Thef(RH) results from the E-AIM model for deliquescence (“del”) and metastable equilibrium (“meta”) also refer to 80–85% RH and the same wavelength. Fuel names are listed in the first column and separated into fuel types.
Fuel Shape Factor POM/OC Density Refractive Index Inorganic/ Carbon mass f(RH) f(RH) f(RH) (χ) (g cm−3) (n=m−ki) (OC+LAC) fraction (%) (80–85%) model- (del) model- (meta)
Forest/Pine Type
1. Ponderosa Pine 1.0 1.6 1.47 1.59–0.07i 0.02 98 1.00 1.03 1.03 2. Lodgepole Pine 1.2 1.5 1.45 1.58-0.05i 0.03 98 1.02 1.03 1.03
3. Southern Pine 1.1 1.6 1.47 1.60-0.07i 0.03 98 1.07 1.04 1.03
Brush Type
4. Chamise 1.5 1.9 1.87 1.71–0.26i 0.42 70 1.58 1.53 1.41
5. Chamise (repeat) 1.6 1.4 1.86 1.69–0.23i 0.44 68 1.45 1.53 1.39
6. Juniper 1.8 2.5 1.84 1.79–0.39i 0.14 87 1.14 1.22 1.17
7. Sage/Rabbit Brush 1.8 1.8 1.95 1.70–0.24i 0.67 58 1.81 1.88 1.63
8. Manzanita 1.7 1.6 1.77 1.69–0.24i 0.27 78 1.34 1.42 1.35
9. Ceanothus 0.9 1.5 1.51 1.56–0.02i 0.24 84 1.15 1.31 1.16
S.E. US/Tropical
10. Puerto Rico Fern 1.1 1.6 1.47 1.57–0.04i 0.15 90 1.07 1.31 1.22 11. Puerto Rico Wood 1.0 1.9 1.53 1.63–0.12i 0.10 93 1.06 1.14 1.11
12. Wax Myrtle 1.1 1.9 1.61 1.60–0.09i 0.41 74 1.34 1.88 1.58
Other
13. Ponderosa Pine Duff 0.9 1.4 1.44 1.57–0.04i 0.03 97 1.04 1.04 1.03 14. Alaskan Duff 0.8 1.6 1.42 1.56–0.012i 0.03 98 1.07 1.03 1.02
15. Lignin 1.3 1.5 1.56 1.66–0.17i 0.02 98 0.99 1.05 1.04
¯ n= ¯ρX
j
Xjmj
ρj
− ¯ρX
j
Xjkj
ρj
i (5)
Real (mj)and imaginary (kj)parts of the refractive indices
for individual species are listed in Table 1. Here we sum over speciesj to avoid confusion with the imaginary part of the refractive index. The mixture density was computed us-ing Eq. (3). The real part of the dry refractive indices ranged from 1.56 to 1.79 with an average and one standard deviation of 1.63±0.07. The imaginary part ranged from 0.012–0.39 with an average and one standard deviation of 0.14±0.11. LAC was the only species assumed to absorb light. Some or-ganic aerosol species may also absorb light (e.g., Kirchstetter et al., 2004; Hand et al., 2005; Hoffer et al., 2006) but the ef-fect was not included here. Values corresponding to each fuel are listed in Table 2. These values are consistent with previ-ous reported estimates of biomass burning refractive indices (Reid et al., 2005b, McMeeking et al., 2005; Hungershoe-fer et al., 2008) and are consistent with values reported by Levin et al. (2010) for FLAME 2006 and 2007 studies. More discussion of these values can be found in Sect. 4.
Equation (6) was used to compute light scattering coeffi-cients for dry or humidified particles (Hand et al., 2004). bsp=
Z 3
2 Qsp Dpm(dry)
GF2 dVdry dlogDp
dlogDp (6)
Forbsp(dry), the Mie scattering efficiency (Qsp)was com-puted for diameters and complex refractive indices of dry
20 40 60 80 100
RH (%) 0.9
1.0 1.1 1.2 1.3 1.4 1.5
GF
Ponderosa Pine
Deliquescence
Metastable
Fig. 2. Growth factors (GF) for 100 nm smoke particles emitted
from ponderosa pine burns as a function of relative humidity (RH, %). The GF results derived from the E-AIM model are for deliques-cence and metastable equilibrium.
particles. Forbsp(RH),Qspwas computed using diameters and complex refractive indices adjusted for water content. The dry volume size distribution is given bydVdry/dlogDp. Cal-culations were performed at a wavelength of 530 nm. GF is the growth factor derived with the thermodynamic mod-els described above and Dpm(dry) corresponds to the dry
midpoint diameter of a size distribution bin. The humidi-fication factorf(RH) was computed by dividingbsp(RH)by
20 40 60 80 100 RH (%)
1.0 1.2 1.4 1.6 1.8
GF
Sage/Rabbit Brush Deliquescence
Metastable
Fig. 3. Growth factors (GF) for 100 nm smoke particles emitted
from Utah sage/rabbit brush burns as a function of relative humidity (RH, %). The GF results derived from the E-AIM model are for deliquescence and metastable equilibrium.
measurements at 20–25% RH. The modeledf(RH) curves were normalized to one at the dry nephelometer RH, similar to the GF case.
4 Results and discussion
4.1 Humidification factors (f(RH))
The extent of agreement between measured and modeled f(RH) values is limited by the number of simplifying as-sumptions required to perform the calculations. Characteriz-ing heterogeneous, non-spherical, chemically complex par-ticles as homogeneous internally mixed spheres of known composition, size, and water content obviously could af-fect how well the calculated and measured values off(RH) agree. The assumptions and limitations are important to keep in mind when evaluating the comparisons between modeled and measured values of f(RH), and sensitivity to some of these assumptions will be discussed in the next section.
We present comparisons off(RH) values for smoke parti-cles generated from burning of four fuel types (Forest/Pine, Brush, southeast US/Tropical and Other) and their rela-tion to other measured smoke properties such as composi-tion and microstructure. Comparisons of measured to mod-eled f(RH) are difficult to quantify over the entire RH range, therefore we comparedf(RH) over RH=80–85%, and we separated the comparisons between the two model esti-mates (metastable and deliquescence). The average modeled f(RH) was computed for the same RH values over which the measurements were performed. Measured and modeled results for all of the fuels are reported in Table 2.
The f(RH) curve corresponding to particles generated from burns of ponderosa pine is presented in Fig. 4. Pon-derosa pine is representative of the other fuels in the For-est/Pine fuel category, all of which produced either weak or non-hygroscopic particles, with minimal growth observed
20 30 40 50 60 70 80 90
RH (%) 1.0
1.2 1.4 1.6 1.8
f(RH)
Ponderosa Pine
Deliquescence
Metastable
Fig. 4. Measured and modeled humidification factors (f(RH)) as
a function of relative humidity (RH, %) for particles emitted from ponderosa pine burns. Thef(RH) results derived from the E-AIM model are for deliquescence and metastable equilibrium. Measure-ments and model calculations performed at a wavelength of 530 nm.
2
μ
m
sootorganic
47
μ
Fig. 5.Secondary electron (SE) microscopy image of smoke
parti-cles generated during the burn of ponderosa pine fuel. Typical par-ticles are composed of soot cores coated with oily organic material (labeled). The sample was collected for the aerodynamic diameter size range between 0.32–0.5 µm.
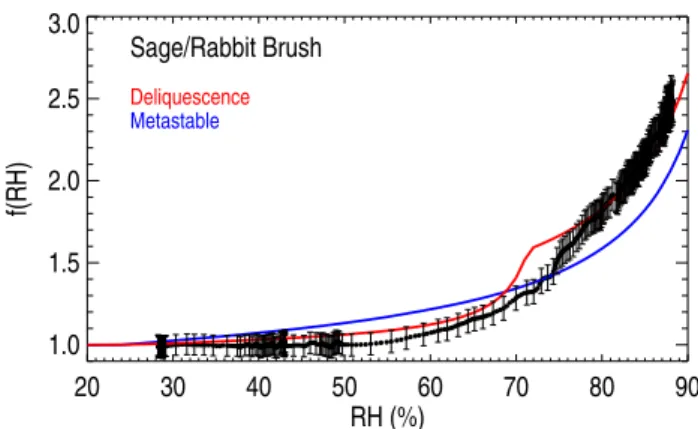
Smoke particles generated in the burns of Brush fuels were significantly hygroscopic, withf(RH) (80–85%)values ranging from 1.14 (juniper) to 1.81 (sage/rabbit brush). The f(RH) curves shown in Fig. 6 for sage/rabbit brush fuel demonstrated flat growth (f(RH)=1) until around 55% RH after which thef(RH) smoothly increased. Although within experimental uncertainty, measurements suggest possible deliquescence around 75% RH while the modeled deliques-cence was shifted lower by about 5% (70%). Both model approaches overestimated the data until∼75% RH when the data fell between the deliquescence and metastable curves. Above ∼85% the measurements were in closer agreement with the deliquescence curve. The modeledf(RH=80–85%) was 1.88 and 1.63 for the deliquescence and metastable es-timates, respectively. The continuous growth observed for smoke particles from sage/rabbit brush burns was typical for fuels of this type (Lewis et al., 2009). Inorganic constituents contributed substantially to the mass of particles, with car-bon mass fraction ranging from 58–87% and inorganic salt to (OC+LAC) ratios from 0.14–0.67 (Table 2). Smoke from these fuels had large shape factors, with the largest (χ=1.8) corresponding to particles from juniper burns. The large shape factors were consistent with observations from the SEM images that revealed the presence of highly fractal soot particles in the samples. The top two panels of Fig. 7 show two images of particles in the same field of view ob-tained using secondary electron (SE) and backscattered elec-tron (BSE) imaging modes, respectively. Soot and organic particles are clearly seen and labeled in the SE image. Car-bonaceous materials have very low backscattering efficiency. Therefore, both fractal soot and organic particle are nearly invisible in the BSE image. In contrast, higher atomic num-ber inorganic particles and inclusions are visible in the BSE
20 30 40 50 60 70 80 90
RH (%) 1.0
1.5 2.0 2.5 3.0
f(RH)
Sage/Rabbit Brush
Deliquescence
Metastable
Fig. 6. Measured and modeled humidification factors (f(RH)) as
a function of relative humidity (RH, %) for particles emitted from Utah sage/rabbit brush burns. Thef(RH) results derived from the E-AIM model are for deliquescence and metastable equilibrium. Measurements and model calculations performed at a wavelength of 530 nm.
image. The bottom panel of Fig. 7 shows characteristic X-ray spectrum of these inorganic particles indicating their mixed KCl/K2SO4composition. Similar observations were reported for particles sampled from chamise burns (Lewis et al., 2009) and sagebrush (Chakrabarty et al., 2006). Sim-ilarly, internally mixed soot and organic particles with in-organic species have been observed previously for ambient biomass smoke samples (e.g. Li et al., 2003; P´osfai et al., 2003; Hand et al., 2005; Semeniuk et al., 2007). OC multi-pliers tended to be higher for smoke particles from burns of these fuels, as did refractive indices (real and imaginary) and densities, reflecting the higher inorganic and LAC content of these fuels (see Table 2). With the exception of ceanothus, all of the fuels of this type had LAC mass fractions of∼30% or greater, consistent with the dominance of soot in the SEM images.
2
μ
m
2
μ
m
SE
BSE
KCl/K
2SO
4soot
organic
EDX spectrum of KCl/K2SO4 particle
0.0 0.2 0.4 0.6 0.8 1.0 1.2
0 1 2 3
energy, keV
in
te
n
s
ity
, a
.u
4
. K
K
Cl S C
O Cu
60
Fig. 7. Secondary electron (SE) image (top panel) and back
scat-tered electron (BSE) microscope image (middle panel) of smoke particles generated from burns of Utah sage/rabbit brush fuel. Typ-ical fractal soot, organic and inorganic particles are seen internally and externally mixed. Carbonaceous soot and organic constituents are invisible in the BSE image, while inorganic constituents are seen as bright spots in the BSE image. Bottom panel: characteristic en-ergy dispersed X-ray (EDX) spectrum of inorganic inclusions indi-cates their mixed KCl/K2SO4composition. (Cu peak results from
a substrate background, C and O peaks are mixed background and sample signals). Samples were collected in the 0.18–0.32 µm aero-dynamic diameter size range.
with NaCl and KCl particles internally and externally mixed with carbon but without the oily/liquid particles seen in the ponderosa pine sample.
The final fuel type, Other, included ponderosa pine duff, Alaskan duff, and lignin. Smoke particles from these burns were weak to non-hygroscopic withf(RH) (80–85%) values of 0.99 to 1.07. The weak hygroscopic behavior observed for these particles was similar to those from the first fuel type and was indicated by very flat, smooth curves that exhibit lit-tle to no growth at high RH. Within experimental uncertainty, model estimates (both deliquescence and metastable) agreed well, with values off(RH) ranging from 1.02–1.05. Smoke particles from both of these fuels had high carbon mass frac-tions (>97%) and inorganic salt to (OC+LAC) ratios of 0.03 or less. The SEM images and EDX analysis of particles from burns of ponderosa pine duff showed round and irregular par-ticles dominated by carbon and oxygen. Some parpar-ticles ap-peared to have been flattened upon impaction onto the sam-ple substrate; however, they do not contain oily organic con-stituents characteristic of particles from the Forest/Pine fu-els. Particles sampled from Alaskan duff burns showed frac-tal soot particles both internally and externally mixed with round and irregular shaped particles dominated by carbon and oxygen. The internally mixed particles may have been a result of coagulation. Only trace amounts of inorganic species were measured by X-ray microanalysis of particles from both fuels. Samples from the lignin burn showed amor-phous particles dominated by carbon and oxygen. Particle densities and refractive indices for this fuel type were simi-lar to those of the Forest/Pine type, consistent with their high POM content.
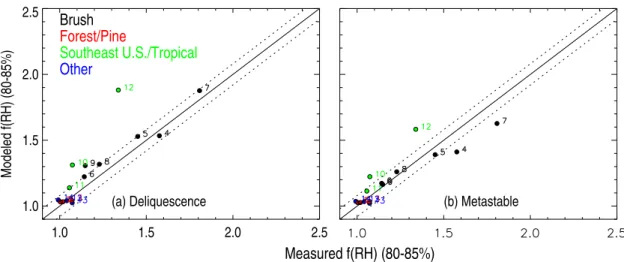
The comparisons of the averagef(RH) values at 80–85% RH for smoke from all burns are shown as scatter plots in Fig. 8a, b for the deliquescence and metastable curves, re-spectively. The symbols for the averagef(RH) values for smoke sampled for a specific burn is denoted by a num-ber (see Table 2) and a color (fuel type). The experimen-tal uncertainties (±0.08) are shown as dotted lines parallel to the solid perfect agreement line. Thef(RH) values for smoke particles with weak hygroscopic growth (Forest/Pine and Other fuel types) agreed within experimental uncertainty for the two model estimates. Greater disparity was observed for more hygroscopic particles depending on the model ap-proach. Overall better agreement was accomplished when using the deliquescence curves, at least over the RH range considered here. The exception was for smoke particles from ceanothus (#9) which agreed well with the metastable curve. Humidification factors for particles generated in burns of two southeastern US/Tropical fuels were overestimated by the models.
J. L. Hand et al.: Role of inorganic constituents 6189
1.0 1.5 2.0 2.5
1.0 1.5 2.0 2.5
Modeled f(RH) (80-85%)
Brush
Forest/Pine
Southeast U.S./Tropical
Other
(a) Deliquescence
Measured f(RH) (80-85%)
(b) Metastable
Fig. 8.Comparisons of measured and modeledf (RH) for RH=80–85% for(a)deliquescence,(b)metastable equilibrium derived using the
E-AIM model. Fuel species are plotted by number (see Table 2) and type (color). Experimental uncertainties (±0.08) are plotted as a dashed line, parallel to the solid perfect agreement line. Humidification factors correspond to 530 nm wavelength.
to carbon ratios (<0.05) observed for particles from burns of Forest/Pine and Other fuels. The most hygroscopic smoke particles from the Brush fuel type had the highest inorganic salt to carbon ratios. Smoke from the southeast U.S./Tropical type fell within this group as well. From Fig. 9 it is clear that as the carbon content of particles increased relative to the inorganic content, their hygroscopicity decreased. Orthog-onal distance regression was applied to the data assuming uncertainties in the inorganic/carbon ratio of ±0.02 based on measurement uncertainties in mass concentrations. The regression resulted in a slope of 1.16±0.09, an intercept of 0.97±0.03, and a correlation coefficient ofr=0.97 (signif-icant at 99% confidence level). The intercept suggests an f(RH) value near one for carbon particles containing no in-organic constituents. Carrico et al. (2010) reported a sim-ilar relationship for other measurements of hygroscopicity during FLAME 2006 and 2007, and similar results were re-ported for laboratory experiments by Beaver et al. (2008). This relationship has also been observed for the hygroscopic properties of ambient smoke, as demonstrated by measure-ments of ambient aged smoke particles measured in Yosemite National Park (Malm et al., 2005; Carrico et al., 2005), as well as biomass smoke measured during flights over the US (Clarke et al., 2007) and ground based measurements in Ko-rea (Kim et al., 2006). The enhancement of hygroscopicity of carbonaceous biomass burning particles mixed internally and externally with inorganic species during the SAFARI-2000 study in southern Africa was reported by Semeniuk et al. (2007). Carbonaceous particles (soot and organic parti-cles) processed with sulfate species have also been shown to undergo enhancements in particle hygroscopicity (e.g. Bay-nard et al., 2006; Garland et al., 2007; Zhang et al., 2008; Khalizov et al., 2009). Our results suggest that, for some fuel types, inorganic species formed through the combustion of
0.0 0.2 0.4 0.6 0.8
IMPROVE Inorganics/Carbon (OC+LAC) 1.0
1.2 1.4 1.6 1.8 2.0
Nephelometer f(RH) (RH=80-85%)
Brush
Forest/Pine
Southeast U.S./Tropical
Other
y = 1.16x+0.09 + 0.97+0.03
Fig. 9. Measured humidification factor (f(RH)) (RH=80–85%) as
a function of inorganic salt to carbon ratio. Carbon includes organic carbon and light absorbing carbon. Fuel type is separated by color. The dotted line refers to a linear regression, with the resulting equa-tion shown. Measurements correspond to a wavelength of 530 nm.
plant matter were present at the time of emission to produce significantly hygroscopic particles without the influence of atmospheric processing. Similar results were reported by Carrico et al. (2010) and Petters et al. (2009) using different measurements of hygroscopicity during FLAME 2006 and 2007.
(humid/dry RH of 80/30%). Higher values occurred under aged conditions, suggesting the importance of atmospheric processing on aerosol hygroscopicity. However, Magi and Hobbs (2003) found similar values off(RH) for young (∼hr old) smoke (1.42) compared to heavily aged smoke (1.44) during aircraft measurements in southern Africa. The im-portance of fuel composition on hygroscopic properties was suggested by Gras et al. (1999) based on aircraft measure-ments of smokef(RH) from north Australian savannah fires (1.37) compared to sulfur-rich peat fires in Indonesia (1.65). Laboratory chamber measurements of f(RH) during a preliminary FLAME study ranged from 1.10 to 1.51 (hu-mid/dry RH of 92/10%) (Day et al., 2006). Values off(RH) for smoke from Alaskan duff were comparable between the earlier study and this one (1.10 at RH=92% compared to 1.07 at RH=80–85, respectively). However, lower estimates of f(RH) corresponding to smoke from burns of sage were re-ported during the earlier study compared to this one (1.30 at RH=92% compared to 1.81 at RH=80–85%, respectively). Petters et al. (2009) also observed a wide range of hygro-scopicity of sage from multiple burns, even within the same experiment. Apparently the source location of sage brush can have a significant effect on the hygroscopic response (Carrico et al., 2010). Measurements off(RH) by Lewis et al. (2009) during the 2006 FLAME experiment were com-parable to our estimates for two available fuels (chamise and ponderosa pine). Values off(RH) for chamise varied be-tween 1.45–1.8 as reported by Lewis et al. (2009) and 1.58 reported here. Results for ponderosa pine weref(RH)=1 for both studies.
4.2 Sensitivity of modeledf(RH)
As mentioned in the previous section, there were several assumptions and uncertainties associated with the data and models used to predictf(RH) values. Two of the major as-sumptions included the value of the molecular weight per carbon weight multiplier used to calculate POM, and the shape factor applied to the DMPS size distributions. These assumptions were important because chemical composition influenced the predicted aerosol water content, and the size distributions affected the derived optical properties. To test the impact onf(RH) values from these assumptions, we per-formed sensitivity analyses to explore the role of uncertain-ties in size distributions and chemical composition.
The major source of discrepancy associated with the par-ticle size distributions was the difference in integrated mass from the DMPS and IMPROVE gravimetric fine mass mea-surements because of the non-sphericity of the aerosols (see Sect. 2.3). The derived shape factors forced the agreement between mass concentrations but also significantly shifted the size distributions, in most cases to smaller size. We com-putedf(RH) with and without the shape factors applied to the size distributions. The differences inf(RH) were less than±0.02 (at RH=80–85%) for all fuels and the two model
approaches, and were not systematically biased either high or low, suggestingf(RH) was fairly insensitive to change in size distributions. The estimates were well within the±0.08 experimental uncertainty. Averaging size distributions over an entire burn may also have contributed some uncertainty, but changes in particle size distributions during the sampling period were much smaller than any observed from apply-ing shape factors (up to 80% shift in diameter, see Table 2). The effects from variables that affect light scattering coeffi-cients, such as shifting the size distribution or different op-tical and physical properties for individual species, canceled when taking the ratio of wetbspto drybspin the calculation off(RH).
Assumptions made in computing aerosol composition could also lead to uncertainties in modeledf(RH). The OC multiplier used to calculate POM was derived by a mass bal-ance approach, forcing mass closure between reconstructed and gravimetric fine mass. Sensitivity to the choice of the multiplier was investigated by assuming two extreme values (1.2 and 2.5) that for most burns resulted in poor comparisons between gravimetric and reconstructed mass. Using these two multipliers, the modelf(RH) was recalculated and com-pared to thef(RH) computed with the POM derived from mass closure. Changes inf(RH) at RH=80–85% depended on the direction of change in POM concentration. A decrease in POM concentration resulted in higherf(RH) values due to the increase in inorganic mass fractions, and vice versa. For both the deliquescence and metastable equilibrium cases, the effect of the multiplier was within experimental uncertainty (±0.08) at 80–85% RH for most fuels. The fuels with the largest sensitivity (>±0.08) corresponded to those with high inorganic content. Particles from burns of sage/rabbit brush, Puerto Rico fern, and ceanothus were the most sensitive to the multiplier, especially for the case when the multiplier was 2.5. This sensitivity study suggested that for particles with high inorganic mass fractions, thef(RH) values can be sensitive to the magnitude of the POM mass fraction because of its role in depressing the hygroscopic growth at high RH, specifically because POM was considered non-hygroscopic.
97%; KNO3: 92.3%, Freney et al. (2009) and references therein). However, it is possible that the modeledf(RH) val-ues were slightly higher than they would be if potassium salts were used to derive water contents. To illustrate, hygroscopic parameters (κ) for potassium and sodium salts (Carrico et al., 2010, and references therein) were converted to GF (at RH=90%) and suggested that NaCl is only slightly more hy-groscopic at 90% RH (GF=2.23) than KCl (GF=2.15), KNO3 (GF=2.11) or K2SO4(GF=1.78). Although the magnitude of f(RH) may not be significantly different at high RH when assuming sodium instead of potassium salts to derive water content, the features in thef(RH) curves might be. Specif-ically, the deliquescence point for measured and modeled f(RH) values could occur at different RH values, as sug-gested by thef(RH) curves presented in Fig. 6.
The normalization of the modeledf(RH) curves also con-tributed some uncertainty. The modeled curves were ad-justed so thatf(RH) equaled one at the same dry RH value as the measurements, essentially accounting for any water that might have been associated with the measured particles at low RH. The consequences of this adjustment were notice-able at high RH in the suppression of the metastnotice-able equilib-rium curve compared to the deliquescence curve, especially for the cases with significant hygroscopic growth. The sup-pression of the metastable equilibriumf(RH) curve implied that the particles were dry at low (20–25%) RH and were hu-midified on the deliquescence curve rather than existing in metastable equilibrium.
Other assumptions in modeledf(RH) include simplified treatment for calculating aerosol water content. We made simple assumptions regarding the average aerosol compo-sition over a burn period when in reality the compocompo-sition of the particles was most likely complex and evolving over the burn duration. We simplified the hygroscopic growth by assuming only inorganic salts take up water and POM was completely non-hygroscopic. The models assumed ho-mogeneous, internally-mixed particles across the accumula-tion mode size range, when in fact SEM images suggested heterogeneous particles that may be internally or externally mixed. Others also have observed this heterogeneity in ambi-ent smoke particles (Li et al., 2003; P´osfai et al., 2003; Hand et al., 2005; Semeniuk et al., 2007). Additionally, GF data suggested there may be considerable heterogeneity in the particle response to water uptake, both for a given size and across the range of accumulation mode sizes (Petters et al., 2009; Carrico et al., 2010). Particle heterogeneity could lead to differences in hygroscopic growth across the accumula-tion mode size range, resulting in particle populaaccumula-tions grow-ing into optically efficient sizes at varygrow-ing RHs and possibly contributing to the smoothed, continuous growth observed in the measurements. Given all of these simple assumptions we found acceptable agreement (within experimental uncer-tainty) between the modeled and measuredf(RH) at high RH for smoke from most of the fuels examined here.
5 Summary
Measured humidification factors (f(RH)) from nephelome-try demonstrated a range in hygroscopicity for young smoke particles from fourteen biomass fuels burned in combustion facility experiments. Estimates ranged from 0.99±0.08 to 1.81±0.08 at 80–85% RH depending on fuel type. For-est/Pine fuels produced particles with the least hygroscopic properties and Brush fuels produced smoke with the most hygroscopic properties. These ranges in hygroscopicity with fuel type are comparable to the rankings reported by Pet-ters et al. (2009) for similar fuels. Chemical and physical characteristics of smoke particles were computed for each fuel from concurrent chemical composition measurements. The average dry refractive index (n=m−ki, 1.63±0.07– 0.14±0.11i), densities (1.6±0.2 g cm−3), molecular carbon to organic carbon multiplier (1.7±0.3) and dynamic shape factors (1.3±0.3) were found in good agreement with previ-ous estimates for biomass smoke.
Using measured size distributions and chemical composi-tion, we modeledf(RH) values as a function of RH using a thermodynamic equilibrium model and the ZSR assump-tion to estimate the mixed aerosol water content; Mie theory was used to compute aerosol optical properties assuming in-ternally mixed spherical particles. Agreement between mea-sured and modeledf(RH) values were within experimental uncertainties for particles from most of the fuels, suggesting that the simple assumptions applied in the model were ad-equate to account for measured water uptake. Specifically, carbon, the dominant fine mass species for smoke emitted from most fuels, was treated as non-hygroscopic. Although it is possible that carbon did absorb some water, the contri-bution tof(RH) from organics would have to be less than ±0.08 (experimental uncertainty) because for most cases the measured and modeledf(RH) agreed within this range; therefore we conclude that the organic species were not sig-nificantly hygroscopic.
non-hygroscopic in the model. These results are important for understanding the range off(RH) values reported for ambient smoke and for improving our ability to parameterize the behavior of biomass smoke aerosols in climate studies and visibility regulatory efforts.
Acknowledgements. We gratefully acknowledge the USFS Fire Sci-ence Laboratory staff for their valuable support and assistance dur-ing the study, includdur-ing Cyle Wold and Wei Min Hao. We also thank those who collected and provided fuels for the study. Funding was provided by the Joint Fire Science Program and the US National Park Service.
The PNNL research group acknowledges support provided from the Atmospheric Science Program of the Office of Biological and Envi-ronmental Research (OBER), US Department of Energy. Electron microscopy analyses were performed in the Environmental Molec-ular Sciences Laboratory (EMSL), a national scientific user facility sponsored by the Department of Energy’s Office of Biological and Environmental Research at Pacific Northwest National Laboratory (PNNL). PNNL is operated by the US Department of Energy by Battelle Memorial Institute under contract DE-AC06-76RL0 1830.
Disclaimer: the assumptions, findings, conclusions, judgments and views presented herein are those of the authors and should not be interpreted as necessarily representing the National Park Service policies.
Edited by: A. Chen
References
Anderson, T. L., Covert, D. S., Marshall, S. F., Laucks, M. L., Charlson, R. J., Waggoner, A. P., Ogren, J. A., Caldow, R., Holm, R. L., Quant, F. R., Sem, G. J., Wiedensohler, A., Ahlquist, N. A., and Bates, T. S.: Performance characteristics of a high-sensitivity, three-wavelength, total scatter/backscatter nephelometer, J. Atmos. Ocean. Tech., 13, 967–986, 1996. Baron, P. A. and Willeke, K.: Gas and Particle Motion. In Aerosol
Measurement Principles, Techniques and Applications, edited by K. Willeke and P. Baron, Van Nostrand Reinhold, New York, 23– 40, 1993.
Baynard, T., Garland, R. M., Ravishankara, A. R., Tolbert, M. A., and Lovejoy, E. R.: Key factors influencing the relative humidity dependance of aerosol light scattering, Geophys. Res. Lett., 33, L06813, doi:10.1029/2005JL024898, 2006.
Beaver, M. R., Garland, R. M., Hasenkopf, C. A., Baynard, T., Ravishankara, A. R., and Tolbert, M. A.: A laboratory investi-gation of the relative humidity dependence of light extinction by organic compounds from lignin combustioin, Environ. Res. Lett., 3, 045003, doi:10.1088/1748-9326/3/4/045003, 2008.
Carrico, C. M., Kreidenweis, S. M., Malm, W. C., Day, D. E., Lee, T., Carrillo, J., McMeeking, G. R., and Collett, Jr., J. L.: Hygroscopic growth behavior of a carbon-dominated aerosol in Yosemite National Park, Atmos. Environ., 39, 1393–1404, 2005. Carrico, C. M., Petters, M. D., Kreidenweis, S. M., Collett Jr., J. L., Engling, G., and Malm, W. C.: Aerosol hygroscop-icity and cloud droplet activation of extracts of filters from biomass burning experiments, J. Geophys. Res., 113, D08206, doi:10.1029/2007JD009274, 2008.
Carrico, C. M., Petters, M. D., Kreidenweis, S. M., Sullivan, A. P., McMeeking, G. R., Levin, E. J. T., Engling, G., Malm, W. C., and Collett Jr., J. L.: Water uptake and chemical composition of fresh aerosols generated in open burning of biomass, Atmos. Chem. Phys., 10, 5165–5178, doi:10.5194/acp-10-5165-2010, 2010. Chakrabarty, R. K., Moosmuller, H., Garro, M. A., Arnott, W. P.,
Walker, J., Susott, R. A., Babbitt, R. E., Wold, C. E., Lincoln, E. N., and Hao, W. M.: Emissions from the laboratory combus-tion of wildland fuels: Particle morphology and size, J. Geophys. Res., 111, D07204, doi:10.1029/2005JD006659, 2006.
Chen, L.-W. A., Moosm¨uller, H., Arnott, W. P., Chow, J. C., Watson, J. G., Susott, R. A., Babbitt, R. E., Wold, C. E., Lincoln, E. N., and Hao, W. M.: Particles emissions from laboratory combustion of wildland fuels: In-situ opti-cal and mass measurements, Geophys. Res. Lett., 33, L04803, doi:10.1029/2005GL024838, 2006.
Chen, L.-W. A., Moosm¨uller, H., Arnott, W. P., Chow, J. C., and Watson, J. G.: Emissions from laboratory combustion of wild-land fuels: Emission factors and source profiles, Environ. Sci. Technol., 41(12), 4317–4325, 2007.
Chow, J. C., Watson, J. G., Chen, L.-W. A., Chang, M. C. O., Robin-son, N. F., Trimble, D., and Kohl, S.: The IMPROVE A temper-ature protocol for thermal/optical carbon analysis: Maintaining consistency with a long-term database, J. Air Waste Manage. As-soc., 57, 1014–1023, 2007.
Clarke, A., McNaughton, C., Kapustin, V., Shinozuka, Y., Howell, S., Dibb, J., Xhou, J., Anderson, B., Brekhovskikh, V., Turner, H., and Pinkerton, M.: Biomass burning and pollution aerosol over North America: Organic components and their influence on spectral optical properties and humidification response, J. Geo-phys. Res. 112, D12S18, doi:10.1029/2006JD007777, 2007. Clegg, S. L., Brimblecombe, P., and Wexler, A. S.: A
thermody-namic model of the system H+-NH4+-Na+-SO42− - NO3− -Cl−-H2O at 298.15 K. J. Phys. Chem. A, 102, 2155–2171, 1998. Day, D. E., Malm, W. C., Kreidenweis, S. M.: Aerosol light scatter-ing measurements as a function of relative humidity, J. Air Waste Manage. Assoc., 50, 710–716, 2000.
Day, D. E., Hand, J. L., Carrico, C. M., Engling, G., and Malm, W. C.: Humidification factors from laboratory studies of fresh smoke from biomass fuels, J. Geophys. Res., 111, D22202, doi:10.1029/2006JD007221, 2006.
DeMott, P. J., Petters, M. D., Prenni, A. J., Carrico, C. M., Kreiden-weis, S. M., Collett Jr., J. L., and Moosm¨uller, H.: Ice nucleation behavior of biomass combustion particles at cirrus temperatures, J. Geophys. Res., 114, D16205, doi:10.1029/2009JD012036, 2009.
Dick, W. D., Saxena, P., and McMurry, P. H.: Estimation of water uptake by organic compounds in submicron aerosols measured during the Southeastern Aerosol and Visibility Study, J. Geo-phys. Res., 105, 1471–1479, 2000.
El-Zanan, H. S., Lowenthal, D. H., Zielinska, B., Chow, J. C., and Kumar, N.: Determination of the organic aerosol mass to organic carbon ratio in IMPROVE samples, Chemosphere, 60, 485–496, 2005.
Envi-ron.,40, S299–S311, 2006.
Freney, E. J., Martin, S. T., and Buseck, P. R.: Deliquescence and efflorescence of potassium salts relevant to biomass-burning aerosol particles, Aerosol Sci. Technol., 43(8), 799–807, 2009. Garland, R. M., Ravishankara, A. R., Lovejoy, E. R.,
Tol-bert, M. A., and Baynard, T.: Parameterization for the relative humidity dependence of light extinction: Organic-ammonium sulfate aerosol, J. Geophys. Res., 112, D19303, doi:10.1029/2006JD008179, 2007.
Gras, J. L., Jensen, J. B., Okada, K., Ikegami, M., Zizen, Y., and Makino, Y.: Some optical properties of smoke aerosol in Indone-sia and tropical Australia, Geophys. Res. Lett., 26(10), 1393– 1396, 1999.
Gwaze, P., Schmid, O., Annegarn, H. J., Andreae, M. O., Huth, J. and Helas, G.: Comparison of three methods of fractal analy-sis applied to soot aggregates from wood combustion, J. Aerosol Sci., 37, 820–838, 2006.
Hand, J. L., Kreidenweis, S. M., Slusser J., and Scott, G.: Compar-isons of aerosol optical properties derived from Sun photome-try to estimates inferred from surface measurements in Big Bend National Park, Texas, Atmos. Environ., 38, 6813–6821, 2004. Hand, J. L., Malm, W. C., Laskin, A., Day, D., Lee, T., Wang, C.,
Carrico, C., Carrillo, J., Cowin, J. P., Collett, Jr., J., and Iedema, M. J.: Optical, physical, and chemical properties of tar balls ob-served during the Yosemite Aerosol Characterization Study, J. Geophys. Res., 110, D21210, doi:10.1029/2004JD005728, 2005. Hansen, J., Sato, M., Ruedy, R., Nazarenko, L., Lacis, A., Schmidt, G. A., Russell, G., Aleinov, I., Bauer, M., Bauer, S., Bell, N., Cairns, B., Canuto, V., Chandler, M., Cheng, Y., Del Genio, A., Faluvegi, G., Fleming, E., Friend, A., Hall, T., Jackman, C., Kel-ley, M., Kiang, N., Koch, D., Lean, J., Lerner, J., Lo, K., Menon, S., Miller, R., Minnis, P., Novakov, T., Oinas, V., Perlwitz, Ja., Perlwitz, Ju., Rind, D., Romanou, A., Shindell, D., Stone, P., Sun, S., Tausnev, N., Thresher, D., Wielicki, B., Wong, T., Yao, M., and Zhang, S.: Efficacy of climate forcings, J. Geophys. Res., 110, D18104, doi:10.1029/2005JD005776, 2005.
Hasan, H. and Dzubay, T. G.: Apportioning light extinction coeffi-cients to chemical species in atmospheric aerosol, Atmos. Envi-ron., 17(8), 1573–1581, 1983.
Hinds, W. C.: Aerosol Technology: Properties, Behavior and Mea-surement of Airborne Particles, 2nd ed. John Wiley & Sons, New York, 42–73, 1999.
Hoffer, A., Gelencs´er, A., Guyon, P., Kiss, G., Schmid, O., Frank, G. P., Artaxo, P., and Andreae, M. O.: Optical properties of humic-like substances (HULIS) in biomass-burning aerosols, At-mos. Chem. Phys., 6, 3563–3570, doi:10.5194/acp-6-3563-2006, 2006.
Hopkins, R. J., Lewis, K., Desyaterik, Y., Wang, Z., Tivanski, A. V., Arnott, W. P., Laskin, A., and Gilles, M. K.: Cor-relations among Optical, Chemical and Physical Properties of Biomass Burn Aerosols, Geophys. Res. Lett., 34, L18806, doi:10.1029/2007GL0305022007, 2007.
Hungershoefer, K., Zeromskiene, K., Iinuma, Y., Helas, G., Trent-mann, J., TrautTrent-mann, T., Parmar, R. S., Wiedensohler, A., An-dreae, M. O., and Schmid, O.: Modelling the optical properties of fresh biomass burning aerosol produced in a smoke chamber: results from the EFEU campaign, Atmos. Chem. Phys., 8, 3427– 3439, doi:10.5194/acp-8-3427-2008, 2008.
Khalizov, A. F., Zhang, R., Zhang, D., Xue, H., Pagels, J., and
McMurry, P. H.: Formation of highly hygroscopic soot aerosols upon internal mixing with sulfuric acid vapor, J. Geophys. Res., 114, D05208, doi:10.1029/2008JD010595, 2009.
Kim, J., Yoon, S.-C., Jefferson, A., and Kim, S.-W.: Aerosol hygro-scopic properties during Asian dust, pollution and biomass burn-ing episodes at Gosan, Korea in April 2001, Atmos. Environ. 40, 1550–1560, 2006.
Kirchstetter, T. W., Novakov, T., and Hobbs, P. V.: Evidence that the spectral dependence of light absorption by aerosols is affected by organic carbon, J. Geophys. Res., 109, D21208, doi:10.1029/2004JD004999, 2004.
Kotchenruther, R. A., and Hobbs, P. V.: Humidification factors of aerosol from biomass burning in Brazil, J. Geophys. Res., 103(D24), 32081–32089, 1998.
Kr¨amer, L., P¨oschl, U., and Niessner, R., Microstructural rearrange-ment of sodium chloride condensation aerosol particles on inter-action with water vapor, J. Aerosol Sci., 31(6), 673–685, 2000. Laskin, A., Cowin, J. P., Iedema, M. J.: Analysis of individual
environmental particles using modern methods of electron mi-croscopy and X-ray microanalysis, J. Electron Spectrosc. Related Phenomena, 150, 260–274, doi:10.1016/j.elspec.2005.06.008, 2006.
Laskin, A., Smith, J. S., and Laskin, J.: Molecular Characterization of Nitrogen Containing Organic Compounds in Biomass Burning Aerosols Using High Resolution Mass Spectrometry, Environ. Sci. Technol., 43, 3764–3771, doi:10.1021/es803456n, 2009. Levin, E. J. T., McMeeking, G. R., Carrico, C., Mack, L.,
Kreiden-weis, S. M., Wold, C. E., Moosm¨uller, H., Arnott, W. P., Hao, W. M., Collett Jr., J. L., and Malm, W. C.: Biomass burning smoke aerosol properties measured during FLAME 2, J. Geophys. Res., doi:10.1029/2009JD013601, in press, 2010.
Lewis, K. A., Arnott, W. P., Moosm¨uller, H., Chakrabarty, R. K., Carrico, C. M., Kreidenweis, S. M., Day, D. E., Malm, W. C., Laskin, A., Jimenez, J. L., Ulbrich, I. M., Huffman, J. A., Onasch, T. B., Trimborn, A., Liu, L., and Mishchenko, M. I.: Reduction in biomass burning aerosol light absorption upon hu-midification: roles of inorganically-induced hygroscopicity, par-ticle collapse, and photoacoustic heat and mass transfer, At-mos. Chem. Phys., 9, 8949–8966, doi:10.5194/acp-9-8949-2009, 2009.
Li, J., P´osfai, M., Hobbs, P. V., and Buseck, P. R.: Individual aerosol particles from biomass burning in southern Africa: 2. Compositions and aging of inorganic particles, J. Geophys. Res., 108(D13), 8484, doi:10.1029/2002JD002310, 2003.
Lide, D. R.: CRC Handbook of chemistry and physics, CRC Taylor and Francis, 2008.
Magi, B. I. and Hobbs, P. V.: Effects of humidity on aerosols in southern Africa during the biomass burning season, J. Geophys. Res., 108(D13), 8495, doi:10.1029/2002JD002144, 2003. Malm. W. C. and Kreidenweis, S. M.: The effects of models of
aerosol hygroscopicity on the apportionment of extinction, At-mos. Environ., 31(13), 1965–1976, 1997.
Malm, W. C., Day, D. E., Kreidenweis, S. M., Collett, J. L., and Lee, T.: Humidity-dependent optical properties of fine particles during the Big Bend Regional Aerosol and Visibil-ity Observational Study, J. Geophys. Res., 108(D9), 4279, doi:10.1029/2002JD002998, 2003.