Total Factor Productivity, Demographic Traits and ICT: Empirical
Analysis for Asia
Bilal MEHMOOD1, Parvez AZIM2 1
Department of Economics, Government College University, Lahore, Pakistan 2
Department of Economics, Government College University, Faisalabad, Pakistan [email protected], [email protected]
This paper advances a model to explain the total factor productivity in Asian countries, most of which are labor surplus and are endowed with substantial human capital. Such promising demographic potentials are considered as complementary factors to use of Information and Communication Technology (ICT). Population with such favorable demographic traits and access to ICT results in higher Total factor productivity (TFP). We call this as Demo-Tech-TFP Model and is tested by using data for 2000-2010 of 24 Asian countries. Econometric concerns like presence of endogenous and/or predetermined covariates and small time-series and cross-sectional dimensions of panel dataset are tackled by using System Generalized Method of Moments (SYS-GMM). Results show considerable support for the Demo-Tech-TFP hypothesis. Need is to design such models that suit the local demography and patterns of technological diffusion currently taking place in developing countries.
Keywords: Information and communication technology (ICT), Total Factor Productivity (TFP), Demographic features, Generalized Method of Moments
Introduction
From pre-historic times man has under-taken to store, recollect, and process infor-mation as a source of value. Starting from
image carving in stone walls to today’s dig i-tal technology, the information is handled in a number of ways [24]. The ICT revolution is crucial insofar as it involves technologies geared to the production and dissemination of knowledge and information. These new technologies, that first emerged in the 1950s and then really took off with the advent of the Internet, have breath-taking potential [15]. ICT has affected agriculture, industry and services sectors of economies world over like no other technology in past [2]. Terms like information economy, digital economy, e-economy, weightless economy, paperless economy have been floated over the last 3 decades to term this readily evolving kind of economy. For instance, one of the pioneering works in this regard was a report by [35]. Later, during mid-λ0s term ‘New Economy’ was introduced to represent the marvelous growth in software industry in US.
In his famous treatise, ‘εajor Economic C
y-cles’, [30] has pointed out the existence of tides of surging economic activity. These
economic cycles are called as ‘Kondratiev Waves’. There is growing consensus that the
rise of ‘New economy’ during 1λλ0s and the burst of the ‘dotcom’ bubble in β001 can be
the 5th Kondratiev Wave and the stimulus behind it is ICT [30].
2 ICT in Asian Region
Asia as one of the densely populated regions of the world has shown high demand for ICT products after the falling prices of ICT equipment during the last quarter of 20th cen-tury. Policy reforms of deregulation and pri-vatization in Asian countries like India, Paki-stan, China and Indonesia and has enabled the spread of ICT [39].
A dataset of 24 countries is included in em-pirical analysis for the time span 2000-2010 depending on the availability of data. The chosen indicators are fixed broadband inter-net subscribers (FBBS), fixed interinter-net sub-scribers per 100 inhabitants (FIS), internet users per 100 inhabitants (INTU), fixed tele-phone lines per 100 inhabitants (FTL), in-formation & communication technology maturation index (ICTMI), internet users per 100 inhabitants (INTU) and mobile cellular telephone subscriptions per 100 inhabitants
(MBLC). ICTMI (Information and Commu-nication Technology Maturation Index) is in-spired from Information and Communication Development Index (IDI) in [42]‘εeasuring
Information Society’ published by Intern a-tional Telecommunication Union (ITU).
3 Literature Survey
Studies at macroeconomics level showing the impact of demographic factors and ICT on TFP are, to our knowledge, scarce. [20] ex-plore the ICT-productivity relationship in Spanish firms. Their innovation was to intro-duce a set of organizational variables
(work-ers’ qualifications, management attitude and
process innovation) which would support the ICT to have its impact on organizational productivity. Their findings affirm the role of (organizational) complementary factors in strengthening the ICT-productivity relation-ship.
A handful of studies conducted for Asian rgion disclosed the need for skills, e-readiness and e-competence of human re-source. Traits like attitude towards and be-lieves about ICT are also researched. These studies have tried to explain the ICT-productivity nexus using this human capital related framework [5] and [17]. But for Asian region, the demographic factors along with ICT have not been incorporated in the empirical analysis. Other explanations have also been given for the fuzziness of ICT-productivity relationship. For example, [4] argues that lags between implementation of ICT and their effect on productivity.
In effort of spiraling down to main debate, this study suggests a newer set of comple-mentary factors including demographic fac-tors and welfare related facfac-tors. In this study, complementary factors are divided into two major categories and are explained below:
4 Demographic Features
From demographic point of view, a few fac-tors are listed and explained in the light of existing empirical literature.
4.1 Economically Productive Youth
Youth, here, refers to age group that is
capa-ble of contributing to production in an econ-omy. The salient trait of Asian region (espe-cially the developing countries) is the young population which implies potential human re-source as revealed by population pyramids and their forecasts. Asian Miracle is consid-ered an outcome of the young population in East Asian countries [9]. Such population combined with ICT can increase productivi-ty. Younger people adopt the internet more as compared to older people [22]. [1] also found similar results for youth.
In relatively advanced countries like those in Europe young population that uses the ad-vanced ICT for recreational and economical-ly productive purposes is termed as digital
natives’ [18]. Age and gender are previous related with ICT by [34]. Authors examine the patterns of IT in five countries, consider-ing the deviations in IT usage across gender, education, age and income groups. This study hypothesizes a certain age cohort to be relatively more productive that is termed as
‘digitally productive’ group of population.
4.2 Urban Population
[19] inquire the difference between access to ICT in rural and urban areas of Tanzania and find no significant difference. This opens the debate for inquiring the impact of urban-rural population in a country in relation with ICT adoption. Under the theory of agglomeration economies, greater urban area and population is considered to be an advantage to a country. Therefore, the population/labor in urban are-as is relatively more productive than popula-tion in non-urban areas. Increased usage of
ICT by such ‘more productive’ population
can become a cause of increased productivi-ty.
4.3 Welfare Related Factor: Human De-velopment Index
low HDI rank have citizens who are less connected.
5 Hypothesis
For inquiring ICT-productivity nexus with complementary factors (henceforth
Demo-Tech-TFP Model), following hypothesis is developed:
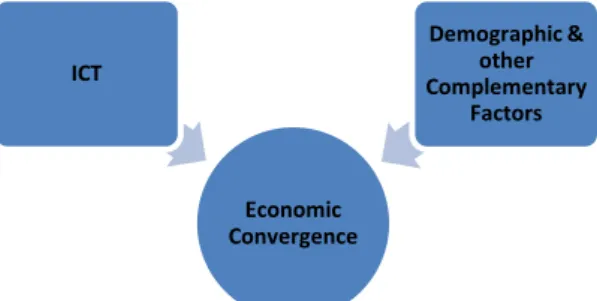
HA: ICT will contribute more to TFP when coalesced with complementary factors (fa-vorable demographic features and greater human development).
Fig. 1. Converging Radial Diagram for ICT Augmented Convergence Hypothesis
Source: Inspired from Barro and Sala-i-Martin (1992)
5.1 Sample Issues and Data Sources
A dataset of mixed sample of countries of Asian region (few DCs and mostly UDCs) is gleaned depending on availability of data for relevant variables. A maximum of 24 coun-tries are selected while the number of years is 11. T = 11 and N = 24 and t < n. Collection of data is done from World Development In-dicators (WDI) and International Telecom-munication Union (ITU) for selected Asian countries.
6 Development of Demo-Tech-TFP Hy-pothesis
The model developed in this study is named
as Demo-Tech-TFP Model. Based on the
factors included in it i.e. demographic fea-tures and information and communication technology, the term Demo-Tech-TFP Model is devised. Emphasis is kept on demographic factors and ICT, since they are likely to have strong complementarities. Among other vari-able is human development index. Human Development Index is expected to have a significant influence on the ability of the ICT users to be more productive and capable of contributing to TFP.
7 Estimable Model
Demo-Tech-TFP model is estimated for as-sessing the role of ICT, along with comple-mentary factors, in explaining TFP:
TFPi,t = φ (ICTMIi,t, ICTSERTi,t, p1564i,t, URBNPi,t, HDIi,t). . . .. . . . . . (1)
TFPi,t = αi + (TFPi,t-1) + i,t (ICTMIi,t) + i,t
(ICTSERTi,t)+ i,t (p1564i,t) + i,t (URBNPi,t) + i,t
(HDIi,t) + Ω (Tt) + i,t . . .
.(1-e)
Here, TFP is total factor productivity calcu-lated as the contribution of all other factor to national income in addition to labor and capi-tal. Tt is vector of time dummies, Ω their r e-spective coefficients and εi,t is the error term. i shows countries and t years. Arithmetically speaking:
TFPi,t = YCDi,t– . Li,t– (1- ) Ki,t . . . .(1-A)
For an overall representation of ICT Infor-mation & Communication Technology Matu-ration Index (ICTMI) is used. ICT goods im-ports as % total goods imim-ports (ICTM) is
used as an ‘external instrument’ as suggested
in [38]. For the complementary effects, ICTSERT is calculated as the product of ICT and SERT. Following [6] ‘tertiary
school enrollment (% gross)’ (SERT) is used
as a proxy of human capital. In lieu of ‘se c-ondary school enrolment’ (SERS), SERT is preferred cause people with higher levels of education enrolment are more intensive and economically productive users of ICT. SERT is also justified as higher levels of education
invites greater ‘ICT diffusion’ in the econ o-my and augments ICT-productivity nexus [13].
Economic Convergence ICT
Demographic & other Complementary
For the complementary effects arising from demographic features of sample countries, p1564 (population with at between 15 and 64 years) and URBNP (%age of urban popula-tion) are included. Welfare related comple-mentarity is investigated using HDI (Human Development Index).
7.1 Probing for Endogeneity –
Durbin-Wu-Hausman Tests
Since endogeneity is expected in the estima-ble model, the Durban-Wu-Hausman tests for endogeneity in IV regressions is employed as follows:
Table 2. Durbin-Wu-Hausman Tests For Endogeneity
Null Hypothesis (Ho): Regressor is Exogenous
Test Notation Statistic p-value Wu-Hausman F test F(1, 208) 40.000 0.000 Durbin-Wu-Hausman χ2 test χ2(1) 41.530 0.000
7.2 Decision on Using IV Regression or
GMM – IV-Heteroskedasticity Tests
As per [7], GMM gives more efficient esti-mates as compared to simple Instrumental
Variables (IV) Regression when
heteroskedasticity exists. In presence of
heteroskedasticity, GMM estimator is a bet-ter estimator. These tests are as follows:
Table 3. IV-Heteroskedasticity Tests Using Levels Of IVs
Null Hypothesis (Ho): Disturbance is Homoskedastic
Test χ2(6) p-val
Pagan-Hall General Test Statistic 14.662 0.023 Pagan-Hall Test w/assumed Normality 49.101 0.000 White/Koenker n Test Statistic 16.050 0.014 Breusch-Pagan/Godfrey/Cook-Weisberg 53.426 0.000
Results of the two tests are in favor of pres-ence of heteroskedasticity.
Breusch-Pagan/Godfrey/Cook-Weisberg and
White/Koenker n test statistics are statisti-cally significant at 1% level of significance. Pagan-Hall General test and Pagan-Hall Test w/assumed Normality statistics show reveal homoskedasticity. Since half of tests reveal the presence of heteroskedasticity, it is safer to assume heteroskedasticity and GMM should be preferred.
ICTεI, ICTε is used as an ‘external instr
u-ment’ as suggested in [38]
7.3 System GMM Results.
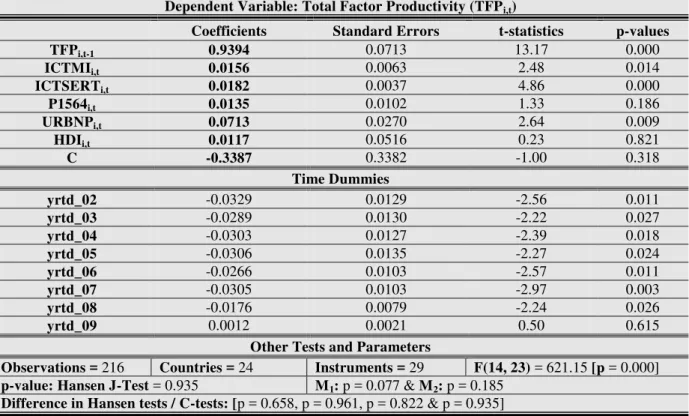
Table 5: SYSTEM GMM Estimates (Impact of Demographic Complementary Factors and ICT on Total Factor Productivity)
Dependent Variable: Total Factor Productivity (TFPi,t)
Coefficients Standard Errors t-statistics p-values
TFPi,t-1 0.9394 0.0713 13.17 0.000
ICTMIi,t 0.0156 0.0063 2.48 0.014
ICTSERTi,t 0.0182 0.0037 4.86 0.000
P1564i,t 0.0135 0.0102 1.33 0.186
URBNPi,t 0.0713 0.0270 2.64 0.009
HDIi,t 0.0117 0.0516 0.23 0.821
C -0.3387 0.3382 -1.00 0.318
Time Dummies
yrtd_02 -0.0329 0.0129 -2.56 0.011
yrtd_03 -0.0289 0.0130 -2.22 0.027
yrtd_04 -0.0303 0.0127 -2.39 0.018
yrtd_05 -0.0306 0.0135 -2.27 0.024
yrtd_06 -0.0266 0.0103 -2.57 0.011
yrtd_07 -0.0305 0.0103 -2.97 0.003
yrtd_08 -0.0176 0.0079 -2.24 0.026
yrtd_09 0.0012 0.0021 0.50 0.615
Other Tests and Parameters
Observations = 216 Countries = 24 Instruments = 29 F(14, 23) = 621.15 [p = 0.000] p-value: Hansen J-Test = 0.935 M1: p = 0.077 & M2: p = 0.185
Difference in Hansen tests / C-tests: [p = 0.658, p = 0.961, p = 0.822 & p = 0.935]
Note: Following Roodman (2006) and Mileva (2007), SGMM is applied on model with arguments small, twostep and robust.
8. Interpretation
The total factor productivity model estima-tions reveal the existence of relaestima-tionship be-tween ICT and TFP hinged upon the demo-graphic complementary factors. Lagged val-ue of total factor productivity is positively re-lated with its previous values, revealing the dynamic behavior of the variable. Hence gives rise to a dynamic panel model. Its sta-tistical significance is at all levels. The main variable of interest is ICTMI that has a posi-tive influence on TFP (total factor produc-tivity) as depicted by its positive sign of re-gression coefficient that is statistically signif-icant. ICTSERT (ICT×SERT) is also used in the regression which captures the interaction of ICT and school enrolment rate at tertiary level. This coefficient also has a significant and positive influence on TFP. This implies that ICT has complementarity with tertiary level of education. In simpler terms, highly educated users (labor) of ICT are economi-cally more productive labor. Statistical sig-nificance of this regressor is only at 10%. The proxy for economically active youth, population aged between 15-64 years is also included. The meaning of young population here is in terms of their contemporariness to ICT and physical and mental fitness to adopt and use ICT. It shows a positive relationship with total factor productivity. It is institutive as young labor force is more ICT-savvy.
‘ICT-savvy’ means proficient user of info r-mation and communication technology. Sta-tistically significant is absent for this varia-ble.
Another fragment of population that is likely to be relatively more productive is the urban population. Population in urban areas gets better education and job opportunities due to urbanization economies. Urbanization econ-omies contain benefits like proximity of markets, skilled and more educated labor, fi-nancial services, better information and communication facilities and knowledge spillovers. Considering these facts, this demo-tech-TFP regression includes urban population (URBNP) as demographic factor.
This regressor is showing positive influence on total factor productivity and supporting the argument of urbanization economies. Its statistical significance is at 1% level of sig-nificance. In an economic jargon, this
coeffi-cient indicates towards ‘ICT-augmented
ag-glomeration economies’ in large urban areas.
This term is devised from the standard term of agglomeration economies.
Human welfare can also contribute to total factor productivity. Accordingly, HDI is in-cluded as a determinant of TFP. Its role turns out to be positive and statistically significant. The result for this regressor is quite intuitive. Its positive role is justified on the basis of its three tiered role i.e. health (life expectancy), educational inclination and economic per-formance of country. All three components of HDI, in presence of ICT, contribute better towards TFP. In another connotation, labor with higher welfare and ICT is likely to be more productive.
In addition to regressors, time dummies as also estimated to overcome the problem of cross-sectional dependence and to cope with universal time-related shocks from εi,t [40]. Overall significance of the model is agreea-ble at 1% level of significance as revealed by F-test of joint significance. The condition that number of observations is greater than number of instruments holds in this case i.e. (240 > 29). Hansen test of correct specifica-tion and over-identifying restricspecifica-tions has a p-value of greater than 0.05. i.e. (p-p-value = 0.935 > 0.05) implying that all over-identified instruments are exogenous. The
Arellano & Bond test for first order ‘ε1’ and
second order ‘ε2’ correlation i.e. AR(1) and AR(2) show p-value of greater than 0.000. i.e. (M1)p-value = 0.077 > 0.05 and (M2)p-value = 0.185 > 0.05. Hence there is no second order serial correlation in residuals.
(C-test)Ho: GMM-differenced instruments are exogenous = 0.658 > 0.05
(C-test)Ho: system GMM instruments are exogenous & they
in-crease Hansen J-test = 0.961 > 0.05
(C-test)Ho: GMM instruments excluding IV-instruments are
ex-ogenous = 0.222 > 0.05
(C-test)Ho: Standard IV-instruments are exogenous & they
in-crease Hansen J-test = 0.935 > 0.05
There is not enough evidence to reject the null hypotheses set in these four tests of dif-ference-in-Hansen/C-tests.
9 Conclusion
From empirical results, it is deduced that demographic and welfare related factors complement the ICT-TFP relationship. The expectation that ICT alone may not amelio-rate TFP is affirmed by our analysis. Com-plementary factor such as population in large urban areas is found to enhance the ICT-TFP relationship. Such digitally literate popula-tion is found to be economically more pro-ductive. Similar implications are found for age cohort of population that is economically active. More specifically, it is affirmed that populations with higher level of HDI (educa-tion, health and living standards) are better able to use ICT for productive purposes con-tributing to national income. The innovative model developed in this study explains TFP from the point of view of ICT, demography and welfare levels.
9.1 Recommendations
Findings in this study related to HDI shows that merely throwing ICT at the disadvan-taged populations/regions shall not bring the desired result of increased productivity. For that the funding agencies have to embed the-se ICT development programs with aware-ness campaigns so as to enable the target population for the economically productive usage of ICT equipment. For instance pro-gram of ICT4D (Information and Communi-cation Technology for Development) faces issue of poor infrastructure, low illiteracy and poor health in implementing the ICT-based development projects in disadvantaged re-gions like Africa. For more see Heeks (2002). As highlighted in the empirical
anal-ysis of this study youth, combined with ICT diffusion, can contribute to level of produc-tivity. Most of sample countries, have shown greater proportion of youth in total popula-tion. Need is to channelize this youth but making them digitally literate so they con-tribute to national income. In brief this find-ing of the study suggests a form of man-power planning which focuses the ICT skills to channelize the benefits of favorable demo-graphic features.
References
[1] B. M. Abdelfattah, K. Bagchi, G. Udo, and P. Kirs, “Understanding the In-ternet Digital Divide: An Exploratory Multi-Nation Individual-Level Analysis”,
AMCIS 2010 Proceedings. Paper 542.
Re-trieved from
http://aisel.aisnet.org/amcis2010/542 [2] T. J. Allen, and M.S. Morton,
Infor-mation Technology and the Corporation of the 1990s: Research studies. Oxford University Press, 1995.
[3] M. Arellano, and S. Bond, “Some Tests of Specification for Panel Data: Monte Carlo Evidence and an Application to Employment Equations”. The Review of Economic Studies, Vol. 58(2), 1991, pp. 277-297.
[4] C. Avgerou, “How Can IT Enable Economic Growth in Developing Coun-tries?”, Information Technology for De-velopment, Vol. 8(1), 1998, pp. 15-28. [5] H. Awang, “Human Capital and
Technology Development in Malaysia”,
International Education Journal, Vol. 5(2), 2004, pp. 239-246.
[6] R. Barro, and J.W. Lee, “Sources of Economic Gowth”, Carnegie Rochester Conference Series on Public Policy, Vol. 40(384), 1994, pp. 1-46.
[7] C.F. Baum, M.E. Schaffer, and S. Stillman, “Instrumental Variables and GMM: Estimation and Testing”, Stata Journal, Vol. 3(1), 2003, pp. 1-31.
[9] D.E. Bloom, and J.G. Williamson,
“Demographic Transitions and Economic Miracles in Emerging Asia”, The World Bank Economic Review, Vol. 12(3), 1998, pp. 419-455.
[10] R. Blundell, and S. Bond, “Initial Conditions and Moment Restrictions in Dynamic Panel Data Models”, Journal of Econometrics, Vol. 87(1), 1998, pp. 115-143.
[11] S. R. Bond, “Dynamic Panel Data Models: A Guide to Micro Data Methods and Practice”, Portuguese Economic Journal, Vol. 1(2), 2002, pp. 141-162. [12] T.S. Breusch, and A.R. Pagan, “A
Simple Test for Heteroskedasticity and
Random Coefficient Variation”,
Econometrica, Vol. 47, 1979, pp. 1287-1294.
[13] G. Cette and J. Lopez, “What Ex-plains the ICT Diffusion Gap Between the Major Industrialized Countries: An Em-pirical Analysis?”, International Produc-tivity Monitor, Vol. 17, 2008, 28-39. [14] R.D. Cook and S. Weisberg, “
Diag-nostics for Heteroscedasticity in Regres-sion”,Biometrika, Vol. 70, 1983, pp. 1-10. [15] P.F. Drucker, “The World According to Peter Drucker Take-Aways”, Free Press, 1998.
[16] S. Dutta and A. Jain, “The Network Readiness Index 2003-2004”, The Global Information Technology Report 2003-2004. Geneva: World Economic Forum. [17] M.A. Elsadig, “ICT and Human
Capi-tal Role in Achieving Knowledge-Based
Economy: Applications on εalaysia’s
Manufacturing”, Journal of Information and Knowledge Management, Vol. 5(2), 2006, pp. 117-128.
[18] European Commission (2010).
Eu-rope’s Digital Competitiveness Report, Commission Staff Working Document. Vol. I.
[19] B. Furuholt and S. Kristiansen, “A Rural-Urban Digital Divide? Regional Aspects of Internet Use in Tanzania”,
EJISDC, Vol. 31(6), 2007, pp. 1-15. [20] A. Gargallo-Castel C. Galve-Gorriz,
“Information Technology,
Complementa-rities and Three Measures of Organiza-tional Performance: Empirical Evidence from Spain”, Journal of Information Technology Impact, Vol. 7(1), 2007, pp. 43-58.
[21] L.G. Godfrey, “Testing for Multipli-cative Heteroskedasticity”, Journal of Econometrics, Vol. 8, 1978, pp. 227-236. [22] A. Goldfarb and J. Prince, “Internet
Adoption and Usage Patterns are Differ-ent: Implications for the Digital Divide”.
Information Economics and Policy, Vol. 20(1), 2008, pp. 2-15.
[23] R. Heeks, “i-development not e-development: Special Issue on ICTs and
Development”, Journal of International Development, Vol.14(1), 2002, pp. 1-11. [24] G.D. Hutcheson, “The Economic
Im-plications of εoore’s δaw. In H. R. Huff (Ed.)”, Into the Nano Era (pp. 11-38), 2009, Berlin Heidelberg: Springer.
[25] IDC (2007). Information Society In-dex, International Data Corporation
(IDC), Retrieved from:
http://www.idc.com/getdoc.jsp?containerI d=204122
[26] ITU. (2003). World Telecommunica-tions Development Report 2003: Access Indicators for the Information Society.
Geneva: ITU. Retrieved from
www.itu.int/ITU-D/ict/publications/wtdr_03/index.htm. [27] ITU. (2005). Measuring Digital
Op-portunity. Geneva: ITU. Retrieved from
http://www.itu.int/itu-wsis/2005/DOI%20V2.pdf.
[28] J.Y. Jung, J.L. Qiu and Y.C. Kim,
“Internet Connectedness and Inequality:
Beyond the Divide.”, Communication Re-search, Vol.28(4), 2001, pp. 507-535. [29] R. Koenker, “A Note on Studentizing
http://www.escholarship.org/uc/item/9jv1 08xp
[31] E. Mileva, “Using Arellano-Bond Dynamic Panel GMM Estimators in Stata”, Economics Department, Fordham University, New York, 2007. Retrieved from: http://www.fordham.edu/ econom-
ics/mcleod/Elitz-UsingArellano%E2%80%93BondGMME stimators.pdf
[32] O. Ngwenyama, F.K. Andoh-Baidoo, F. Bollou and O. Morawczynski, “Is There a Relationship Between ICT, Health, Education and Development? An Empirical Analysis of Five West African Countries from 1997-β00γ”, The Elec-tronic Journal on Information Systems in Developing Countries, Vol. 23(5), 2006, pp. 1-11.
[33] J. Nurmela and M. Viherä, “ Commu-nication Capability is an Intrinsic Deter-minant for the Information Society”, Fu-tures, Vol. 3, 2000, pp. 245-65.
[34] H. Ono and M. Zavodny, “Digital In-equality: A Five Country Comparison Us-ing Microdata”, Social Science Research,
Vol. 36(3), 2007, pp. 1135-1155.
[35] M.U. Porat, "Information Economy".
Technology, 2010 (1/12/2010), 1-18. Har-vard Business School Press. Retrieved from
http://www.oecd.org/department/0,3355,e n_2649_33757_1_1_1_1_1,00.html
[36] C.A. Primo Braga, C. Fink and C.P. Sepulveda, "Intellectual Property Rights and Economic Development", 2000,
World Bank Discussion Papers.
[37] D. Roodman, How to Do xtabond2:
An Introduction to “Difference” and “Sy
s-tem” Gεε in Stata, Working Papers 10γ,
2006, Center for Global Development.
[38] D. Roodman, "A Note on the Theme of Too Many Instruments", Oxford Bulle-tin of Economics of Statistics, Vol. 71(1), 2009, pp. 135-158.
[39] R. Samarajiva and A. Zainudeen, ICT Infrastructure in Emerging Asia: Policy and Regulatory Roadblock. 2008, India: Sage Publications.
[40] V. Sarafidis, T. Yamagata and R. Robertson, "A Test of Cross-Section De-pendence for a Linear Dynamic Panel Model with Regressors", Faculty of Eco-nomics, University of Cambridge, 2006,
available on line at:
http://www.econ.cam.ac.uk/faculty/roberts on/HCSDtest14Feb06.pdf.
[41] L.D. Stanley, "Beyond Access: Psy-chosocial Barriers to Computer Literacy".
The Information Society, Vol. 19, 2003, pp. 407-416.
[42] S. Teltscher, E. Magpantay, V. Gray, D. Olaya and I. Vallejo, Measuring the In-formation Society: The ICT Development Index: Telecommunication Development Bureau, International Telecommunica-tions Union (ITU): Geneva, 2010,
ac-cessed at http://www. itu.
int/net/pressoffice/backgrounders/general/ pdf/5.pdf
[43] S. Welling and H. Kubicek, Measur-ing and BridgMeasur-ing the Digital Divide in Germany. Report presented at the Interna-tional Conference, Stepping-Stones into the Digital World, September, Bremen, 2010. Retrieved from http://www.digitale-chancen.de/transfer/downloads/MD35.pdf [44] H. White, A Heteroskedasticity-Consistent Covariance Matrix Estimator and a Direct Test for Heteroskedasticity.
Econometrica, Vol. 48, 1980, pp. 817-838.
Bilal MEHMOOD has graduated the Master in Economics in 2003. He
University, Lahore, Pakistan as a senior lecturer in Department of Economics. He has con-ducted and edited Survey projects with Punjab Small Industries Corporation under Govern-ment of The Punjab, Pakistan. He is the author of more than 30 articles and two books in the fields of ICT economics and knowledge economy, among others. His work is currently in Romanian Review of Social Sciences (RRSS) and is forthcoming in Oeconomics of Knowledge and Romanian Economic Journal (REJ). His work concentrates on the role of ICT and knowledge in development of UDCs.