*e-mail: [email protected]
Received: 27 May 2013 / Accepted: 28 March 2014
Analysis of the inluence of an articulated seat position for wheelchair
on the pressure distribution in the gluteal region
Mariana Ribeiro Volpini Lana*, Paul Campos Santana Silva, Marcos Pinotti Barbosa
Abstract Introduction: The present study proposes a new scientiic project for the seat of a wheelchair, suggesting that, through the properties of a three plan mobile seat, the pelvis of individuals with neuromotor dysfunctions may position themselves adequately, allowing a chain effect, with innumerable beneits to the users, such as prevention of deformities, of muscle shortening, of pressure ulcers and improved functionality. In spite of innumerable wheelchair models available in market, none presents the ample properties resembling the articulated seat, allowing the pelvic alignment that is crucial for the adoption of an adequate posture. Methods: The articulated seat was set over a ball and socket articulation made of two components, one convex that is ixed in the chair’s structure and the other concave, attached to a mobile platform. The property of the articulated seat, to change the pressure distribution in the gluteal region, was tested on 34 typical individuals, without neurological injury, through a measurement system composed by 27 sensors. Results: The signiicance of the statistic model proposed determined that the articulated seat was capable of altering the pressure distribution in the gluteal region in several positions on the frontal and sagittal planes, in healthy subjects. Conclusion: Despite the fact that this equipment is capable of redistributing the pressure in a seating position, future research to examine other parameters such as time of use, the use in subjects with neurological dysfunction, the angle of pelvic inclination, the criterions of indication and non-indication, inter alia, must be conducted to appropriately qualify this device.
Keywords Bioengineering, Wheelchair, Pelvic alignment, Cerebral palsy.
Introduction
Cerebral Palsy (CP) is deined as “[…] a disorder of movement and posture due to a defect or lesion in the immature brain.” (Bialik and Givon, 2009, p. 1). Children with cerebral palsy often use wheelchairs with special adaptations, aiming to improve posture and help prevent deformities. The Posture inluences the cardiorespiratory function, the distribution of pressure points, the performance of the digestive tract, sleep and pain (Hägglund and Wagner, 2008; Vekerdy, 2007). In addition, a proper postural alignment could promote functionality and maximizes patient comfort
(Hatta et al., 2007).
The position in which an individual is with a
good body alignment is called neutral posture. In this posture an individual remains more relaxed since muscles do not need much effort to keep it. However,
it is not an idle position, since in this state the person
is ready to act (Zollars, 1996). The neutral posture is a reference for therapists who customize wheelchairs and it is expected that the individual in this posture is with the pelvis neutral (slightly forward) and weight on the ischial tuberosities, straight trunk, but with physiological curves preserved, hip and legs apart about 5-8° from the midline, knees and ankles joints
with angles of 90° and feet resting on the support surface (Berger et al., 1990). Moreover, the head should be upright in the midline, allowing a view of the environment, shoulders relaxed and arms free to move and perform functions (Berger et al., 1990).
The position of the pelvis can tell us about the degree and the distribution of muscle tone of
the individual (Holmes et al., 2003). Most spastic
individuals (high tone) has a posterior pelvic tilt when seated normally, indicating an excessive activation of the hip extensor muscles, unlike a forward pelvic tilt
usually indicates a very low tone (Holmes et al., 2003).
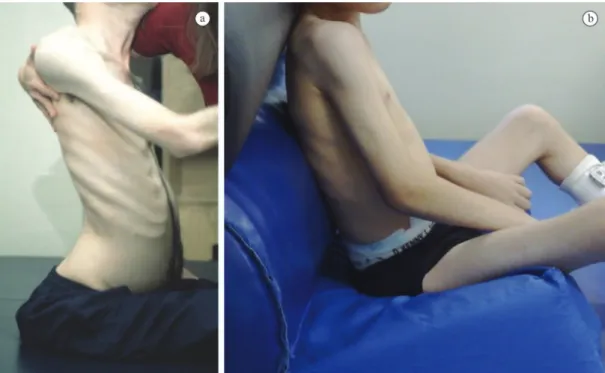
Observing a person with posterior pelvic tilt (Figure 1), for example, it’s possible to realize the inluence of the pelvis in the entire body positioning.
The lower limbs tend to adduction and internal rotation
the neck to compensate for the thoracic kyphosis (Berger and Colangelo, 1982).
Similarly, when the pelvis is tilted forward, righting
reactions and equilibrium responses should result in
extension of the head and trunk (back and torso head) and lexion of the hip and knee, as shown in Figure 2 (Cholewicki et al., 2000; Su-Fen et al., 2003).
The positioning of the pelvis affects the function of the trunk, head, neck, upper limbs and inluences
the activation of muscle relexes, since it provides a support base for the proximal segments of the body in the sitting posture (Batavia et al., 2001). Correcting pelvic alignment it’s possible to alter the whole body positioning, resulting even in improvement of the hand function. Therefore it is essential that any evaluation in the sitting posture begins with the pelvis and that any intervention starts for its correction (Berger and Colangelo, 1982).
Figure 1. (a) Child with a backward pelvic tilt and (b) correction of the backward pelvic tilt with an anterior seat inclination (anterior wedge). Source: author’s personal archive.
Several researches continue to investigate the positive and negative aspects of the custom adaptations by the wheelchair seating services and of the commercial models of wheelchair available on the market to assist the positioning of wheelchair users. In addition, new models are often proposed, but these have not emphasized the pelvic positioning, so they became ineffective or palliative. Since the pelvic alignment is crucial for the adoption of a proper sitting posture (Van Geffen, 2008a, 2008b), more cautious and creative seats projects, as well as
pelvic support components are needed in order to
obtain an optimized pelvic positioning.
Seeking to contribute to scientiic and technological
advancement in this area, this study aimed to propose
a speciic new design for wheelchair seat able to promote a better pelvic alignment and consequently adequate pressure distribution in sitting posture and to test it from its ability to redistribute the pressure in the gluteal region by varying its position.
Methods
This study developed the articulated wheelchair seat and tested its ability to alter the pressure distribution
in the gluteal region, by changing its position in the frontal and sagittal planes, and using intensity maps as a resource for analysis. All the measuring system used to observe the distribution of pressure in the gluteal region in sitting posture consists of the articulated seat, 27 FSR sensors (Force Sensing Resistor) arranged along the surface of the seat (340 × 340 mm) and the data acquisition system associated with the software for processing and displaying the results.
The articulated seat
The seat was mounted on a ball and socket articulation. This joint is composed of two components, one
convex and the other concave. The concave portion is ixed to the mobile platform where FSR sensors are arranged and the convex part is ixed to the frame of the wheelchair. This device installed centrally allows movement on the three planes (frontal, sagittal,
transversal) independently or combined (precession).
The design includes the placement of adjustable mechanical limiters responsible for deining the maximum range of movement on the sagittal and frontal planes independently, as well as to control the rotation and the multi axial movement, therefore making the movement compatible to that which is desired. There are also springs around each backstop ensuring that the movements of the seat will be smooth. The articulated seat for wheelchair has a patent required under registration number PI- 0504703-0
(Volpini et al., 2007).
The mechanical part of the system can be better understood by means of the drawing of Figure 3, basically composed of ten components: 1) Ball and socket articulation; 2) Flange of the concave part (2.1) and of the convex part (2.2) of the ball and socket articulation; 3) Platform that supports the plywood with the FSR sensors, where is ixed the concave part of the Ball and socket articulation; 4) Hollow screw which regulates the preload of the spring; 5) Spring: for this study, speciically, springs were not used, since the positions evaluated were only static postures of
individuals, but the calculations and the dimensions
of them were determined; 6) Spring support “Cup” (external diameter: 34 mm, internal diameter: 26 mm, height: 50 mm); 7) Seat of plywood with 10 mm thick; 8) Screw that regulates the mechanical limiters; 9) Mounting of the spring box with the screw that adjusts the spring pre-tension and with the other screw that regulates the mechanical limiter; 10) FSR sensors.
Data acquisition system and capture software
The data acquisition system reads electric tension that
comes from the Force Sensing Resistor (FSR) and converts these signals in equivalents values of force.
Force Sensing Resistor (FSR) is a compact device,
that shows a decrease in electrical resistance with an
increase in the applied force on its surface (resistance is inversely proportional to the strength). In total, 27 FSR sensors were distributed over the surface of the seat (340 × 340 mm).
To view the results by LabView® software, intensity and surface curves with interpolation routines
were used.
The calibration of the measurement system, to verify the behavior of the sensors under pressure, was according to NBR 8197:2002, items 7 and 8 of the Brazilian Association of Technical Standards – ABNT (Associação…, 2002), with the support of the Department of Physical tests of the Technological Center Foundation of Minas Gerais – CETEC/ MG. All sensors of the measuring system are from brand Interlink Electronics, FSR408 model, with a nominal range of 10 kgf (5 mV). The results obtained during the calibration procedure were analyzed using the technique of regression and the coeficient of
determination (R2) was the parameter considered to verify the accuracy of the technique.
The Intraclass Correlation Coeficient (ICC) was calculated for each sensor in order to determine their reliability. In sequence it was applied an Exploratory
Factor Analysis (EFA) to identify which sensors are grouped into variable groups (Factors) in order to facilitate the interpretation of the results. To ensure independence of observations, the values of each measurement were centralized as if in a panel model of random effects (random effects model), analyzing the deviations from the mean of each participant of the study, and not their original values. The Statistical Package for Social Science for Windows (SPSS) calculates an anti-image matrix of covariance and correlation. All diagonal elements of this matrix must be greater than 0.5, if the sample is adequate (Campos,
2000). Based on these conditions a solution with
ive Factors described in Figure 4 was obtained. The results show a good correlation between the Factors
and the variables selected.
It is shown that the way in which the sensors
are positioned tends to produce consistent results
which generate the coniguration obtained by EFA. The EFA also has good application conditions with Kaiser-Meyer-Olkin Measure of Sampling (KMO) which value is 0.872, close to the value of 0.900 that is excellent, showing that the sample is large enough
to produce reliable results. Those sensors that not
grouped generated Factor 6 and the sensor 18 was excluded from the analysis because it did not cluster with any of the others. Based on the results of the EFA an average of the pressures measured in each one of the six Factors described previously was calculated.
To check for differences between the measured mass in each one of the six Factors of the chair, for
each one of the ive positions set in the study was employed Repeated Measures ANOVA.
Clinic methodology
The study involved the participation of 34 typical
adults individuals, in other words, without neuromotor
dysfunction, aged 20 to 50 years, female and male, with mass between 50 and 70 Kg. This population was selected randomly, for convenience, through the dissemination of the research in classrooms in the Department of Physiotherapy, Occupational Therapy and Physical Education, of the Federal University of Minas Gerais. The mixed sample (men and women) was chosen since, in both genders, proper sitting position (neutral position) is the same, deined as the situation in which the body weight is transferred to the chair seat by ischial tuberosity and soft tissue of the gluteal region, as well as to the ground through the feet. In this posture, compensatory movements
are prevented, the loads are properly distributed and
energy is conserved (Marques et al., 2010).
The participation of subjects aimed to assess the ability of the new articulated seat to redistribute pressure on the gluteal region, when adjusted properly
seated posture.
The exclusion criteria were:
– Individuals with neuromotor dysfunction (neurological damage) or spinal curvatures deviations (scoliosis, kyphosis, lordosis) that could change the measurement results; – Individuals outside the mass range between
50 kg to 70 kg.
Participants were evaluated by static postural
inspection, in all three planes, to verify the absence of the spinal curvatures deviations.
This study was approved by the Research Ethics Committee Ethics of the Federal University of Minas Gerais (UFMG-COEP No 383/09) and Voluntary Informed Consent was signed by each participant, according to Resolution No. 196/96 of the Health National Council.
Evaluation measures and procedure
A protocol was established to ensure the standardization of research. It was requested that participants sit with their hands on the thighs, with horizontal gaze. The footrest was adjusted so that the angles between the torso and thigh and between the thigh and leg were equal to 90°. The data collection consisted of data acquisition of the pressure distribution in the gluteal region of the participants in ive different seat positions. Over the measurement system was located a foam of 340 × 340 mm, density D60 and 5 cm thick, in which
participants sat down and this allowed the proper
reading of the sensors.
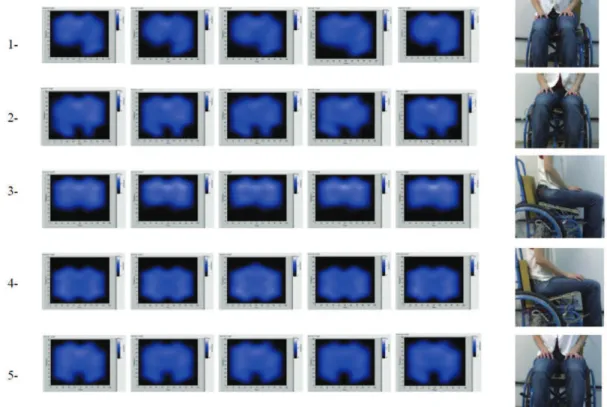
Five measurements for each of the ive positions (adjustment) of the seat were performed (Caling and Lee, 2001; Deloor and Grypdonck, 1999; Hobson, 1992). They are: 1) seat without inclination, 2) 15° tilted forward, 3) 15° tilted backward, 4) 15° to the right; 5) 15° to the left.
Above 15° of pelvis tilt, individuals with righting reactions, simultaneously start trunk lexion in an attempt to maintain balance against gravity due to changes in body orientation. Thus, it can be said that above 15° of pelvic tilt the movement is not only from the hip but also from the spine (Cholewicki et al.,
2000). Therefore, the maximum angle of adjustment of the seat in all planes was deined by 15° to ensure that the alignment would be only pelvic, but keeping the trunk free to make equilibrium responses and the righting reactions necessary for postural maintenance. These positions of the seat can be seen in Figure 5. All the seat’s angles were measured by an Angle meter, 3 ½ inches, from Dasco Pro Inc. and by a wood level of 14 inches from Famastil with two calibrated bubbles.
According to Gutierrez et al. (2004), three seconds
is the necessary time to occur an accommodation
in seated posture. Each one of the ive measures was collected after three seconds, because then the
accommodation time would be respected.
Variations in the position of the seat aim to promote a better posture alignment and hence better pressure distribution, and greater functionality in neurological patient.
The differences in the pressure distribution in the gluteal region in ive different seat positions were compared to the initial position, by analyzing the intensity maps generated as well as through data
obtained by the sensors and sent to the analysis
software.
Results
The sample size is equal to 34 and was set considering
the Central Limit theorem, since this allowed that the
average tended to a normal distribution (Hual et al., 2005). This sample received also a high power effect (for signiicant effects above 80% in the analysis of variance), which is considered good. However, for some seat positions the power was lower, suggesting that other studies have a larger sample.
Multivariate test
mass measured in the different Factors of the chair. These variables are: a) the position (P) of the seat (within-subject factor) and b) the mass of individuals (between-subjects factor).
Analyzing the between-subjects factor (WEIGHT) the Table 1 shows that there is 0% chance of the weight of an individual to not affect the results, which means,
the measured value.
Observing the intra-subject factor (position - P),
the multivariate test showed that each seat position
tends to generate a mass concentration in different
regions of the seat or in other words, in different Factors of the seat (p = 0.010).
It is possible to see in Table 1 that considering the within-subjects factor (position - P) there is only a 1% chance of inding equal weights in different seating positions (b < 0.010).
These results were obtained by analyzing and comparing the generated values for the average mass in ive different seat positions, and are compiled in Table 2. The data in Table 2 demonstrate the existence of signiicant effect (b < 0.010) from the seat position
Table 1. Multivariate tests with the two variables capable of altering the measured values: 1) mass of participants (WEIGHT- between-subjects factor) and 2) sitting position (P- intra-subjects factor).
Value F Std. Dev. Sig
Between-subjects WEIGHT
Pillai’s Trace .720 11.576b 6.000 27.000 .000*
Wilk’s Lambda .280 11.576b 6.000 27.000 .000*
Hotelling’s Trace 2.573 11.576b 6.000 27.000 .000*
Roy’s Largest Ro 2.573 11.576b 6.000 27.000 .000*
Intra-subjects P
Pillai’s Trace .926 4.698b 24.000 9.000 .010*
Wilk’s Lambda .074 4.698b 24.000 9.000 .010*
Hotelling’s Trace 12.527 4.698b 24.000 9.000 .010*
Roy’s Largest Ro 12.527 4.698b 24.000 9.000 .010*
WEIGHT- participants mass; P- position of the seat; F- F test; Std. Dev.- standard deviation; Sig-sig de b < 0.010; *Signiicant at 1% probability.
(P-position), that means that the force that is applied in each region depends on both the tilt as the weight of the participant.
The multivariate test showed that the chance of inding a different pressure distribution pattern in the gluteal region in different seating positions was huge (94%). The analysis of univariate tests were conducted to verify where speciically these differences occurred, in other words, in which Factors of the chair (Table 3).
The results in Table 3 show, irst, that there are differences between the values measured at each position of the wheelchair (b < 0.05), but it is also possible to observe that when this effect is combined with the weight of the patient, outcomes are altered (b < 0.05). These indings demonstrate that the study results should be adjusted by the weight of the participant to properly extract their conclusions. The Factors or the areas of the wheelchair seat where on which there was a signiicant effect can be seen in the schematic drawing of Figure 6, outlined in red.
Therefore, differences in the pattern of pressure distribution in the gluteal region occurred only in Factors 1, 2 and 5 (outlined in red). Considering the position (P) where, 1 − corresponds to 15° to the right, 2 − corresponds to 15° to the left, 3 − corresponds to 15° tilted forward, 4 − corresponds to 15° tilted backward and 5 − corresponds to the seat without inclination (lat) and the aforementioned Factors, it’s possible to estimate the average mass of the Factors when the difference in weight of the study participants is controlled, in other words, with weights adjusted using the average weight, which corresponds to a value of mass 58 kg.
Delving some more into the results, since it was already known that the pressure was altered and in which Factors this change was signiicant, it was left to know in which seat positions this change was signiicant. This is interesting because one Factor considered insigniicant to change the pressure in a speciic position may have particular signiicance in
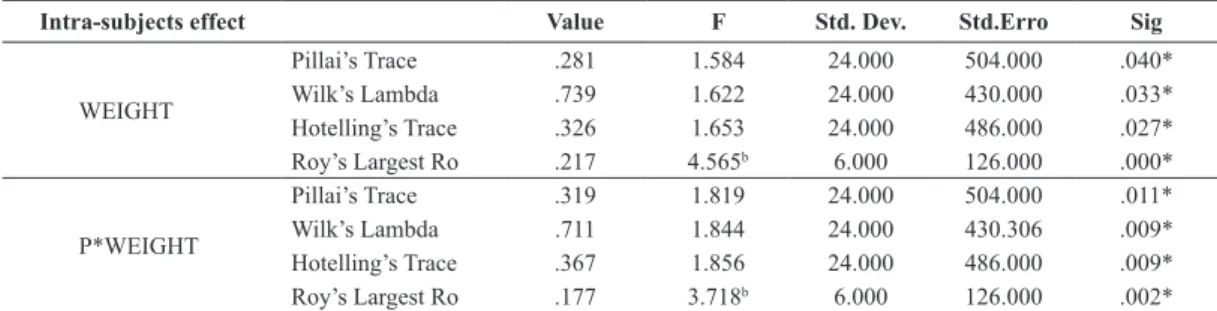
Table 2. Intra subjects effect comparing the average mass found in each of the ive positions of the seat.
Intra-subjects effect Value F Std. Dev. Std.Erro Sig
WEIGHT
Pillai’s Trace .281 1.584 24.000 504.000 .040*
Wilk’s Lambda .739 1.622 24.000 430.000 .033*
Hotelling’s Trace .326 1.653 24.000 486.000 .027*
Roy’s Largest Ro .217 4.565b 6.000 126.000 .000*
P*WEIGHT
Pillai’s Trace .319 1.819 24.000 504.000 .011*
Wilk’s Lambda .711 1.844 24.000 430.306 .009*
Hotelling’s Trace .367 1.856 24.000 486.000 .009*
Roy’s Largest Ro .177 3.718b 6.000 126.000 .002*
WEIGHT- average mass found in each one of the ive seating positions; P*WEIGHT- combination of several mass of participants and seat position; F- F test; Std. Dev.- standard deviation; Std. Erro- erro do desvio padrão; Sig- sig de b < 0.010; *Signiicant at 1% probability.
another position P, in other words, the fact of not being signiicant to change the pressure in one position,
does not determine that this Factor does not show
signiicance for any of the ive positions.
Then, to verify in which positions differences
between the pressures occur, we applied the t-test with
Bonferroni correction, comparing the differences of each Factor in the ive positions, which allowed us to conclude that the change in seat position by tuning the wheelchair was able to redistribute the weight of the subjects in different areas of the seat, even when controlling the weight of these individuals.
Table 3. Evaluation of signiicant differences in the pressure distribution by means of univariate tests.
Source Mean Sum of Squares
type III Std. Dev. Average of Squares F Sig.
P F1 SphericityAssumed Greenhouse-Geisser Huynh-Feldt Lower-Bound 192730.057 192730.057 192730.057 192730.057 4 2.953 3.387 1.000 48182.514 65276.434 56901.776 192730.057 3.034 3.034 3.034 3.034 .020* .034* .027* .091* F2 SphericityAssumed Greenhouse-Geisser Huynh-Feldt Lower-Bound 337708.845 337708.845 337708.845 337708.845 4 2.447 2.747 1.000 84427.211 138016.254 122920.067 337708.845 2.360 2.360 2.360 2.360 .057* .090* .082* .134* F3 SphericityAssumed Greenhouse-Geisser Huynh-Feldt Lower-Bound 224611.122 224611.122 224611.122 224611.122 4 1.923 2.107 1.000 56152.780 116795.771 106579.237 224611.122 1.282 1.282 1.282 1.282 .280 .284 .285 .266 F4 SphericityAssumed Greenhouse-Geisser Huynh-Feldt Lower-Bound 8939.754 8939.754 8939.754 8939.754 4 2.568 2.899 1.000 2234.938 3481.220 3084.155 8939.754 .186 .186 .186 .186 .945 .879 .900 .669 F5 SphericityAssumed Greenhouse-Geisser Huynh-Feldt Lower-Bound 181720.847 181720.847 181720.847 181720.847 4 2.880 3.294 1.000 45430.212 63090.970 55161.555 181720.847 3.822 3.822 3.822 3.822 .006* .014* .010* .059* F6 SphericityAssumed Greenhouse-Geisser Huynh-Feldt Lower-Bound 100289.698 100289.698 100289.698 100289.698 4 1.225 1.322 1.000 25072.424 79936.138 75840.111 100289.698 .382 .382 .382 .382 .822 .588 .599 .541 P*WEIGHT F1 SphericityAssumed Greenhouse-Geisser Huynh-Feldt Lower-Bound 225923.234 225923.234 225923.234 225923.234 4 2.953 3.387 1.000 56480.808 76518.750 66701.756 225923.234 3.556 3.556 3.556 3.556 .009* .018* .013* .068* F2 SphericityAssumed Greenhouse-Geisser Huynh-Feldt Lower-Bound 400522.354 400522.354 400522.354 400522.354 4 2.447 2.747 1.000 100130.588 163687.140 145783.077 400522.354 2.799 2.799 2.799 2.799 .029* .056* .049* .104* F3 SphericityAssumed Greenhouse-Geisser Huynh-Feldt Lower-Bound 217219.472 217219.472 217219.472 217219.472 4 1.923 2.107 1.000 54304.868 112952.180 103071.858 217219.472 1.240 1.240 1.240 1.240 .297 .295 .297 .274 F4 SphericityAssumed Greenhouse-Geisser Huynh-Feldt Lower-Bound 18410.422 18410.422 18410.422 18410.422 4 2.568 2.899 1.000 4602.605 7169.183 6351.473 18410.422 .384 .384 .384 .384 .820 .734 .758 .540 F5 SphericityAssumed Greenhouse-Geisser Huynh-Feldt Lower-Bound 180882.369 180882.369 180882.369 180882.369 4 2.880 3.294 1.000 45220.592 62799.862 54907.034 180882.369 3.804 3.804 3.804 3.804 .006* .014* .010* .060* F6 SphericityAssumed Greenhouse-Geisser Huynh-Feldt Lower-Bound 10992.605 10992.605 10992.605 10992.605 4 1.255 1.322 1.000 2748.151 8761.682 8312.722 10992.605 .042 .042 .042 .042 .997 .888 .898 .839
Discussion
The results obtained in this study made it possible to
analyze only the ability of the articulated seat designed to alter the pressure distribution in the gluteal region, by changing its position in the frontal and sagittal planes in healthy subjects. The likely beneits of this seat as well as the consequences of its use by wheelchair users have not been tested. New research to examine other parameters such as the time of use, the use by individuals with cerebral dysfunction, the angle of tilt of the pelvis, the indications and contraindications, among others, must be performed to properly qualify
this device.
The sensors have been calibrated by the method
of nonlinear regression using SPSS 15.0 statistic software for statistical data analysis. The nonlinear relationship was dealt as a multiple linear regression using exponential relationship. The estimation of nonlinear parameters was performed by the method of least squares, and the solution of the normal nonlinear equations was obtained by the Gauss-Newton process. The general form of the regression model is represented by Equation 1, where A, B, C, D are the estimated constants, for each sensor in a non-linear regression model, T is the voltage (V) and P is the pressure (N/
m2) concerning the sensors numerical readings.
[ ln( )] [ ( ) ]
= + +
P D
T A B P C e (1)
[0,1 ,10 ]
Domain Kg Kg
Since we wish to express our results in Force, we will use Equation 2 to express the domain with
this variable:
=FORCE
P
AREA (2)
It is important to note that the sensors area does not vary and it is equal to 1600 mm2.
The model demonstrated good average value of the coeficient of determination (R2), which was the considered parameter to check the accuracy of the regression technique. The adjustment values and the estimates of the constants of each one of the 32 sensors can be seen in Table 4. It’s important to note that the electronic system consists of 27 sensors, but
in total 32 sensors were calibrated in case there was
a need to replace any of them. The data obtained by the calibration of the measurement system show that the lowest value found between the regression lines was 99.1% (Table 4).
Although these values have been quite satisfactory, the sensors 3, 4, 6, 22 and 24 showed low reliability, possibly due to the variable nature of the object
of study, who are people, therefore, with varying responses. However, these sensors were not excluded, since in Exploratory Factor Analysis (EFA), which aimed to group them into Factors facilitating data analysis, they produced consistent results together, grouping properly.
It is interesting to note that the result of EFA generated a distribution of sensors in Factors, which coincides with the physical distribution of body segment analyzed through the measurement system, in other words, with the gluteus and thighs of the participants. It can be observed also that beyond this correlation exists another one related to the body symmetry in right and left sides. These results reinforce the coherence and eficiency of the EFA.
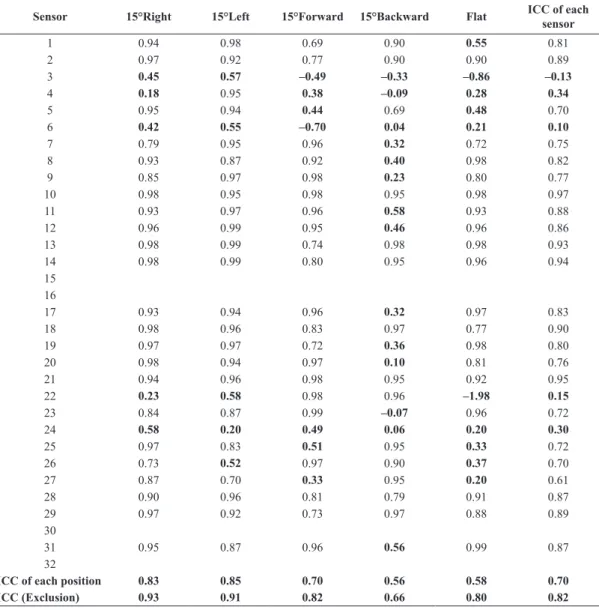
The reliability of the sensors, that is to say the ability of them to generate similar results verifying
that the random and systematic errors are small,
was tested by the Intraclass Correlation Coeficient (ICC). The interpretation of the values of the ICC can be understood as: ─ 0.4 ≤ ICC <0.75 represents a satisfactory reproducibility of the study; ─ ICC <0.4 means poor reproducibility; ─ ICC ≥ 0.75 says that the reproducibility of the study is excellent (Shrout and Fleiss, 1979) (Table 5).
Differences existed between the values measured at each position of the wheelchair seat, but this effect was only signiicant for the Factors F1, F2 and F5. It is interesting to note that two of the three Factors which were not signiicant have at least one sensor considered unreliable. For example, in Factor F3 all sensors have high reliability, however, the Factor F4
contains the sensor 22 with low reliability and the
Factor F6 contains sensors 3, 4, 6 and 24 with low reliability, besides being the group of sensors that not answered satisfactorily in EFA. These sensors with low reliability can be one of the factors that have inluenced the signiicance of their respective Factors.
It is noteworthy that the signiicance of only the
Factors F1, F2 and F5 determine that the articulated seat
is able to change the pressure distribution in different positions and situations, even when controlling the weight, so this equipment redistribute the pressure in the gluteal region.
probably occurred for two reasons: irst because there was greater contact between the body segment and the higher side of the tilted seat, that is to say the right
side, and second, because individuals corrected the
weight shift using the trunk balance strategy which consists of tilt it to the right.
Taking the horizontal plane (seat without inclination – P-5) of Figure 5 as a reference for analyzing the pressure distributions in the other four seat positions, it is possible to make some interesting
observations. First, it can be seen that the intensity
maps of the position of the seat without inclination (P-5) are not fully symmetrical for the distribution of
pressure. This is because no individual is symmetrical,
with one side equal to the other, they are just similar (Buchanan and Horak, 2003; Lanzetta et al., 2004). Also analyzing the positions 1 - and 2 - of the Figure 5 it can be seen again that the compensation to the right
and left sides, resulting from the seat tilt 15° right and left, are different, demonstrating that the pattern of postural correction to one side is not equal to the
other one in the same person.
It is interesting to correlate these observations with the Factors signiicance results. It has been observed in the results a lack of symmetry of them, since F2 (left posterior region) of Figure 5 showed signiicance to change the pressure distribution and your symmetrically opposite Factor, F3 (right posterior region) didn’t show the same signiicance.
Considering the wheelchairs that are available and commonly found in the Brazilian market, we
can appoint three models: Standard wheelchair with closure in X, recliner wheelchair, wheelchair with tilt in space. The wheelchair with closure in X is by
far the most widely prescribed worldwide, due to the
Table 4. Adjustment of the regression non linear model of the sensors calibration.
Sensors R2 A B C D
1 99.648 –419.80842 1006.88335 0.01531 –0.37078
2 99.092 –234.62126 810.89052 0.12132 –0.43440
3 99.807 –317.37842 847.86131 0.02882 –0.38530
4 99.517 –216.78756 777.51510 0.05983 –0.41750
5 99.854 –277.95085 863.41370 0.14357 –0.44537
6 99.620 –252.81377 875.04233 0.06228 –0.41211
7 99.647 –278.64272 942.64783 0.06223 –0.39443
8 99.741 –194.94944 790.61038 0.11119 –0.43606
9 99.838 –278.32981 828.45393 0.04712 –0.41253
10 99.799 –364.10874 1001.14370 0.03667 –0.39638
11 99.788 –340.77932 923.43759 0.02485 –0.38732
12 99.715 –259.10405 857.01790 0.07141 –0.42036
13 99.591 –288.22245 926.17148 0.05218 –0.40451
14 99.577 –345.93796 928.87352 0.02211 –0.37605
15 99.669 –435.14644 1035.66874 0.02631 –0.38424
16 99.769 –274.78276 934.03630 0.06328 –0.41579
17 99.791 –305.26184 914.20363 0.15487 –0.44885
18 99.556 –200.25184 807.75700 0.13483 –0.44541
19 99.545 –331.41653 1003.48773 0.01760 –0.37622
20 99.666 –300.50061 951.09945 0.05683 –0.41227
21 99.866 –236.77005 801.29274 0.12536 –0.44508
22 99.796 –234.46733 828.37284 0.13552 –0.44772
23 99.714 –305.61735 901.51087 0.10677 –0.43783
24 99.607 –286.26213 943.42974 0.06443 –0.41575
25 99.790 –179.72291 766.71992 0.09550 –0.42797
26 99.708 –84.84161 766.90931 0.12763 –0.44100
27 99.643 –269.15069 911.05249 0.03995 –0.40388
28 99.879 –195.50311 791.53660 0.11056 –0.43849
29 99.788 –147.28582 710.40838 0.18762 –0.46131
30 99.748 –282.93949 930.61279 0.03387 –0.39562
31 99.682 –229.85862 878.54553 0.14854 –0.44634
32 99.766 –331.31005 958.11385 0.02531 –0.38941
simplicity of design and consequently low cost, without allowing positioning adjustments (Brubaker, 1986).
The recliner wheelchairs accept adjusts of the backrest angle that can be performed while the user
is seated on the equipment, but without possibility to
changing the positioning of the pelvis (Berger et al., 1990).
Wheelchairs with tilt in space allow to be angled backwards as a whole, while the sitting posture of wheelchair remains unchanged, since there isn’t change in the angle between the backrest and seat, in other words not changing the position of the pelvis (MacDonald et al., 2009).
It was observed that, despite the numerous models of wheelchairs available, none of them have the
extensive properties similar to the articulated seat, since the pelvic alignment is crucial to adopt a proper posture (Van Geffen, 2008b). The articulated seat was designed for patients with different types of neuromotor dysfunctions, who need help with body alignment for proper positioning, however emphasis was given to cerebral palsy due to their complexity of impairments.
The results obtained in this study enabled us to
analyze only the ability of the articulated seat designed to alter the pressure distribution in the gluteal region, by changing your position in the frontal and sagittal planes in healthy subjects. The likely beneits of this seat as well as the consequences of its use by wheelchair users have not been tested. New research
Table 5. ICC of sensor’s measurements, determining their reliability. 0.4 ≤ ICC < 0.75 – satisfactory reproducibility; ICC < 0.4 – poor reproducibility; ICC ≥ 0.75 – excellent reproducibility.
Sensor 15°Right 15°Left 15°Forward 15°Backward Flat ICC of each
sensor
1 0.94 0.98 0.69 0.90 0.55 0.81
2 0.97 0.92 0.77 0.90 0.90 0.89
3 0.45 0.57 –0.49 –0.33 –0.86 –0.13
4 0.18 0.95 0.38 –0.09 0.28 0.34
5 0.95 0.94 0.44 0.69 0.48 0.70
6 0.42 0.55 –0.70 0.04 0.21 0.10
7 0.79 0.95 0.96 0.32 0.72 0.75
8 0.93 0.87 0.92 0.40 0.98 0.82
9 0.85 0.97 0.98 0.23 0.80 0.77
10 0.98 0.95 0.98 0.95 0.98 0.97
11 0.93 0.97 0.96 0.58 0.93 0.88
12 0.96 0.99 0.95 0.46 0.96 0.86
13 0.98 0.99 0.74 0.98 0.98 0.93
14 0.98 0.99 0.80 0.95 0.96 0.94
15 16
17 0.93 0.94 0.96 0.32 0.97 0.83
18 0.98 0.96 0.83 0.97 0.77 0.90
19 0.97 0.97 0.72 0.36 0.98 0.80
20 0.98 0.94 0.97 0.10 0.81 0.76
21 0.94 0.96 0.98 0.95 0.92 0.95
22 0.23 0.58 0.98 0.96 –1.98 0.15
23 0.84 0.87 0.99 –0.07 0.96 0.72
24 0.58 0.20 0.49 0.06 0.20 0.30
25 0.97 0.83 0.51 0.95 0.33 0.72
26 0.73 0.52 0.97 0.90 0.37 0.70
27 0.87 0.70 0.33 0.95 0.20 0.61
28 0.90 0.96 0.81 0.79 0.91 0.87
29 0.97 0.92 0.73 0.97 0.88 0.89
30
31 0.95 0.87 0.96 0.56 0.99 0.87
32
ICC of each position 0.83 0.85 0.70 0.56 0.58 0.70
to analyze other parameters such as the time of use, the use by individuals with neuromotor dysfunction, the angle of tilt of the pelvis, the indications and contraindications, among others, must be performed to properly qualify this device.
Overall, this paper shows a new method for designing wheelchairs with articulated seats. The tests performed with 34 healthy participants, that is to say without neuromotor dysfunction, demonstrated
that the articulated seat is able to redistribute the
pressure in the gluteal region after his inclination in the frontal and sagittal planes, however, need for
improvements were detected in the mechanical and
electronic projects.
It can be said that the objectives of this research were achieved and among the goals that this mechanical design is proposed, not all were been evaluated yet, for example, the rotation and precession movements of the seat as well as its use by wheelchair users.
Other studies should be conducted in order to
provide more support for a more careful analysis of the likely beneits of this equipment.
Acknowledgements
The authors would like to thank the Laboratory of Bioengineering, School of Mechanical Engineering, Federal University of Minas Gerais - (Labbio-UFMG) and the National Council for Scientiic and Technological Development – CNPq .
References
Associação Brasileira de Normas Técnicas. ABNT/CB-04: Máquinas e Equipamentos Mecânicos – Materias metálicos – Calibração de instrumentos de medição de força de uso geral. Rio de Janeiro: ABNT; 2002.
Batavia M, Batavia AI, Friedman R. Changing chairs: anticipating problems in prescribing wheelchairs. Disability and Rehabilitation. 2001; 23(12):539-48. PMid:11432651. http://dx.doi.org/10.1080/09638280010022531
Berger A, Colangelo C. Positioning the client with C.N.S. deicits: the wheelchair & other adapted equipment. New York: Valhalla; 1982. p. 5-22.
Berger A, Presperin J, Tallman T. Positioning for function: wheelchairs and other assistive technologies. New York: Valhalla; 1990. p. 21-50.
Bialik GM, Givon U. Cerebral Palsy: classiication and etiology. Acta Orthopaedica et Traumatologica Turcica. 2009; 43(2):77-80. PMid:19448345. http://dx.doi.org/10.3944/ AOTT.2009.077
Brubaker CE. Wheelchair prescription: an analysis of factors that affect mobility and performance. Journal of Rehabilitation Research and Development. 1986; 23(4):19-26. PMid:3820118.
Buchanan JJ, Horak FB. Voluntary control of postural equilibrium patterns. Behavioural Brain Research. 2003; 143:121-40. http://dx.doi.org/10.1016/S0166-4328(03)00038-X
Caling B, Lee M. Effect of direction of applied mobilization force on the postero-anterior response in the lumbar spine. Journal of Manipulative and Physiological Therapeutics. 2001; 24(2):71-8. PMid:11208218. http://dx.doi.org/10.1067/ mmt.2001.112568
Campos D. Psicologia da adolescência. 17. ed. Petrópolis: Vozes; 2000. p. 157.
Cholewicki J, Polzhofer GK, Radebold A. Postural control of trunk during unstable sitting. Journal of Biomechanics. 2000; 33(12):1733-7. http://dx.doi.org/10.1016/S0021-9290(00)00126-3
Deloor T, Grypdonck MH. Sitting posture and prevention of pressure ulcers. Applied Nursing Research. 1999; 12(3):136-42. http://dx.doi.org/10.1016/S0897-1897(99)80045-7 Gutierrez EM, Alm M, Hulting C, Saraste H. Measuring seating pressure, area, and asymmetry in persons with spinal cord injury. Europe Spine Journal. 2004; 13:374-9. PMid:14639505 PMCid:PMC3468044. http://dx.doi. org/10.1007/s00586-003-0635-7
Hägglund G, Wagner P. Development of spasticity with age in a total population of children of cerebral palsy. BMC Musculoskeletal Disorders. 2008; 9:150. PMid:18990204 PMCid:PMC2644696. http://dx.doi.org/10.1186/1471-2474-9-150
Hatta, T, Nishimura S, Inoue K, Yamanaka M, Maki M, Kobayashi N, Kishigami H, Sato M. Evaluating the relationships between the postural adaptation of patients with profound cerebral palsy and the coniguration of the seating Bugg’s seating support surface. Journal of Physiological Anthropology. 2007; 26(2):217-24. PMid:17435368. http:// dx.doi.org/10.2114/jpa2.26.217
Hobson DA. Comparative effects posture on pressure and shear the body seat interface. Journal of Rehabilitation Research & Development. 1992; 29(4):21-31. http://dx.doi. org/10.1682/JRRD.1992.10.0021
Holmes KJ, Michael SM, Thorpe SL, Solomonidis SE. Management of scoliosis with special seating for the non-ambulant spastic cerebral palsy population-a biomechanical study. Clinical Biomechanics. 2003; 18:480-7. http://dx.doi. org/10.1016/S0268-0033(03)00075-5
Hual J, Xiong Z, Lowey J, Suh E, Dougherty E. Optimal number of features as a function of sample size for various classiication rules. Bioinformatics. 2005; 21(8):1509-15. PMid:15572470. http://dx.doi.org/10.1093/bioinformatics/ bti171
Lanzetta D, Cattaneo D, Pellegatta D, Cardini R. Trunk control in unstable sitting posture during functional activities in healthy subjects and patients with multiple sclerosis. Archives of Physical Medicine and Rehabilitation. 2004; 85:279-83. PMid:14966714. http://dx.doi.org/10.1016/j. apmr.2003.05.004
Medicine & Rehabilitation. 2009; 88(1):61-5. PMid:18971771. http://dx.doi.org/10.1097/PHM.0b013e31818dff2a Marques NR, Hallal CZ, Gonçalves M. Características biomecânicas, ergonômicas e clínicas da postura sentada: uma revisão. Fisioterapia e Pesquisa. 2010; 17(3):270-6. http://dx.doi.org/10.1590/S1809-29502010000300015 Simpósio Brasileiro de Adequação Postural em Cadeira de Rodas – Seating: Anais do II Simpósio Brasileiro de Adequação Postural em Cadeira de Rodas – Seating; 2008 ago, São Paulo. São Paulo; 2008.
Su-Fen L, Yang TF, Hsu TC, Chan RC, Ta-Sen W. Differences in seated postural control in children with spastic cerebral palsy and children who are typically developing. American Journal of Physical Medicine & Rehabilitation. 2003; 82(8):622-6. PMid:12872019. http://dx.doi.org/10.1097/01. PHM.0000073817.51377.51
Shrout PE, Fleiss JL. Intraclass correlation: uses in assessing rater reliability. Psychological Bulletin. 1979; 86(2):420-8. http://dx.doi.org/10.1037/0033-2909.86.2.420
Van Geffen P, Moller BI, Reenalda J, Veltink PH, Koopman BF. Body segments decoupling in sitting: control of body posture from automatic chair adjustments. Journal of Biomechanics. 2008a; 41:3419-25. PMid:18996530. http:// dx.doi.org/10.1016/j.jbiomech.2008.09.017
Van Geffen P, Reenalda J, Veltink PH, Koopman BF. Effects of sagital postural adjustments on seat reaction load. Journal of Biomechanics. 2008b; 41:2237-45. PMid:18533160. http://dx.doi.org/10.1016/j.jbiomech.2008.04.012 Vekerdy Z. Management of seating posture of children with cerebral palsy by using thoracic-lumbar-sacral orthosis with non-rigid SIDO frame. Disability and Rehabilitation. 2007; 29(18):1434-41. PMid:17729090. http://dx.doi. org/10.1080/09638280601055691
Volpini MR, Volpini E, Pinotti M, Silva P. Assento articulado nos três planos, permitindo movimento pélvico ântero-posterior, látero-lateral, de rotação e de precessão. Rio de Janeiro: INPI; 2007.
Zollars JA. Special seating: an illustrated guide. Minneapolis: Reha Otto Bock; 1996.
Authors
Mariana Ribeiro Volpini Lana*, Paul Campos Santana Silva, Marcos Pinotti Barbosa