1.Universidade Federal do ABC – Centro de Engenharia, Modelagem e Ciências Sociais Aplicadas – Santo André/SP – Brazil.
2.Universidade de São Paulo – Escola Politécnica – Departmento de Engenharia de Energia e Automação Elétricas – São Paulo/SP – Brazil.
Correspondence author: Marcelo Bender Perotoni | Universidade Federal do ABC – Centro de Engenharia, Modelagem e Ciências Sociais Aplicadas | Av. dos Estados, 5001 | CEP: 09.210-580 – Santo André/SP – Brazil | Email: marcelo.perotoni@ufabc.edu.br
Received: Jun. 14, 2017 | Accepted: Feb. 19, 2018
Section Editor: Alison Moraes
ABSTRACT: This article presents a hybrid computational method to address the datalink characteristics of an Unmanned Aerial Vehicle (UAV) relay. It uses the 3D far-field gain data from the antennas (UAV and ground station), separately computed or based on available measurements as inputs, and then applies the 2-Ray propagation model, taking into consideration the ground permittivity and the respective antenna heights. By doing so, different numerical approaches cover the two different physical scales. Since the installed antennas (i.e. antennas considered placed on the UAV fuselage) performances are considered, a higher reliability can be achieved with the covered procedure, at lower costs when compared to field measurements. Results for different example scenarios are presented and discussed.
KEYWORDS: Propagation, UAV relay, Two-ray propagation method, Multi-scale analysis, Hybrid modeling.
INTRODUCTION
UAVs, also popularly known as drones, have become more and more present in several different applications. Initially designed during World War II to be used in battlefield situations where life support could be alleviated, their use is nowadays expanded into more mundane applications such as parcel delivery, surveillance and even scientific research (Holder 2001). When payloads containing high-throughput data systems (e.g. real time video signals from cameras) are present, an adequate datalink analysis should guarantee the relay operative during the complete flight. To exemplify such use, it mentions the applications based on UAVs relied on commercial off-the-shelf IEEE 802.11 WiFi equipment to relay video transmission (Cheng et al. 2006), and another vehicle also with WiMax (Rahman 2004), the latter discussing the use for rescue in the Alpine areas. In other terms, the distance between the UAV and its ground station cannot be so large so that the link is broken. Large UAVs employ multiple frequency relays, including satellite links, alternatives that lighter and lower cost vehicles cannot afford.
This work main innovation involves the use of a combined approach to compute the radio propagation channel of an UAV during its flight. Since it accounts for a realistic installed performance characteristic of the antennas computed with a volumetric mesh 3D electromagnetic solver, it offers a better description of the channel.
Next section covers the state of the art on the literature and the third section explains the applied workflow, with the main equations involved. The fourth section analyzes the electromagnetic full wave solutions in order to obtain the far-field antenna gains, and the fifth section shows some results for the different example scenarios by applying the complete procedure that includes the 2-Ray propagation model.
Unmanned Aerial Vehicle Propagation Datalink
Tool Based on a Hybrid Multiscale Modeling
Marcelo Bender Perotoni1, Roberio Donizeth Passos de Araújo1, Carlos Antonio França Sartori2
Perotoni MB; Araújo RDP; Sartori CAF (2018) Unmanned Aerial Vehicle Propagation Datalink Tool Based on a Hybrid Multiscale Modeling. J Aerosp Manag Technol, 10:e4218. doi: 10.5028/jatm.v10.975.
How to cite
Perotoni MB https://orcid.org/0000-0002-7398-5766
Araújo RDP https://orcid.org/ 0000-0003-1208-411X
J. Aerosp. Technol. Manag., São José dos Campos, v10, e4218, 2018 Perotoni MB; Araújo RDP; Sartori CAF
xx/xx 02/11
STATE OF THE ART
A complete propagation analysis involves several different factors, like the respective antennas in operation, used frequencies, terrain characteristics, etc. The prediction of their link performance is a daunting task; usual alternatives are statistical analysis (Simunek et al. 2013) or an experimental-based approach (Cheng et al. 2006; Matolak 2015; Yanmaz et al. 2006). The effect of rain on UAS (Unmanned Airborne Systems) link has been evaluated using the Hycell modeling for the Ku and Ka bands (12 to 18 GHz and 26.5 to 40 GHz, respectively), using Monte Carlo method applied to compute the long-term cumulative distribution function of the overall attenuation (Charilaos et al. 2010). In Lemorton et al. (2011), a list of different methods for UAV propagation prediction is presented, particularly focusing on rain and gaseous attenuations, whose effects are relevant for higher frequencies, Ku and Ka bands. In Semkin et al. (2017) an investigation is carried out towards the propagation prediction for the 60 GHz range using the SBR method (Shooting and Bouncing Ray) applied to an environment where an UAV was used to perform a 3D photogrammetry model. The propagation scenario was imported into the commercial package Wireless In Site tool, by Remcom. For the case of tree canopies influence on UAV propagation, a model based on PO (Physical Optics) and multiple scattering theory was applied, whose results were confronted with measurements performed with a blimp, at the frequency range of 2 GHz (Kvicera et al. 2017). A blimp was also employed to collect data that confirmed the use of a Rice-log normal propagation model as adequate for an urban area, at the frequency of 2 GHz (Simunek et al. 2013). Another study focused on the data link between UAVs in flight is presented by Leitgeb et al. (2007), using higher frequencies with the free space optics, where the atmospheric and turbulence attenuation effects are taken into account since the higher sensitivity they impose on smaller wavelengths links.
For the specific case of a UWB (ultra-wide band) link for UAVs, its BER (bit-error rate) performance was analyzed taking into account the frequency dependent two ray propagation method (Yin et al. 2010). Another work had the impact of the UAV height on the network performance theoretically analyzed, using high gain antennas for a flock of UAVs (Alshbatat and Dong 2010).
Naturally, measurements of real case scenarios require the vehicle and associated radios and instrumentation, items not easily available. Besides that, measured channels are valid only as long as the basic terrain and characteristics do not present significant variations, otherwise they deviate from the characterized model.
The complete simulation of the problem involves three different scenarios: small-scale simulation (antenna), a medium scale (antenna + UAV structure – the so called installed performance), and a larger scale (distance between the UAV and its ground station). The physical scales here imply dimensions related to the wavelength in analysis. The complete analysis, i.e., the UAV and its antennas simulated at the large distance from the ground station tackled by “brute force” would be electrically too large and complex. Besides that, concerning the numerical simulations, the large distances involved alongside with small antenna details will result in a large mesh aspect ratio (i.e. relation between the smallest and largest mesh dimensions). That would be computationally demanding, analyzing the complete structure – from the small antenna details to the large distances between the ground station and UAV. Therefore the use of a multi-scale solution is appropriated, where each scale is solved with a proper solver.
Such sort of problems has been covered by domain decomposition techniques (Peng et al. 2011), where the problem with small details is computed with solvers like FDTD (Finite-Difference Time-Domain) or FEM (Finite Element method), whereas MoM (Method of Moments) or PO tackles the larger scale scenario. The specific cases of antennas coupled to large aircraft structures took advantage of this method, though not the whole propagation channel (Barka and Caudrillier 2007; Wang et al. 2010).
be placed on the antenna placement, a problem when the UAV structure distorts the far-field pattern of the whole radiant system. It helps predict the maximum distance a data relay is expected to operate.
OVERVIEW
Though isolated antennas can have their gain patterns measured in anechoic chambers, their installed performance (when mounted on the UAV structure) may show different results, due to the electromagnetic coupling between the large metallic structure and the radiant system. Antennas can be designed and customized to the UAV structure (Sharawi et al. 2010), but this solution is not always possible because usually existing or commercially available antennas are deployed. The complete gain measurement – antenna coupled on the UAV fuselage – might be hard to execute, since the anechoic chamber must be large enough to accommodate the complete vehicle. For that purpose, full wave field solvers present a reasonable alternative to take into account the complete environment (vehicle and the antennas). Nevertheless, the next step – the complete propagation scenario – taking into account the presence of soil, UAV at a certain height, and involved distances is still a daunting task, even for surface meshes (like those from the method of moments numerical technique). Pure volumetric meshes (for instance, finite-difference-time-domain or finite element methods) are even more demanding since the complete air volume has to be meshed, sometimes the solution being the domain decomposition of the complete volume (Barka and Caudrillier 2007). Taking into account the fact that several different evaluations should be performed to get the map of received power at different distances, the computation is still more complicated to be performed in a regular full-wave solver. The proposed workflow gets precise data from simulation or measurements and then applies the 2-Ray method to obtain the received power mapped for several distances. Figure 1 illustrates the basic terms involved in the modeled channel. The 2-Ray method, or the image method, is simple and convenient for the prediction in simple environments, such as the one here analyzed. More complex scenarios, such as an urban area, need to take into account multiple reflections, using the SBR method instead (Yun and Iskander 2015).
Figure 1. (a) Basic scheme of the problem. (b) Example of UAVs at two different hypothetical positions and the incident rays that compose the received signal. Adapted from Goldsmith (2005).
The model takes into account two rays that reach the receiver from the transmitter: the direct line of sight (l) and the reflected ray from the ground (following the path x-x’ in Fig. 1). The angle α is defined from the distance r and heights hR and hT (elevation angle in antenna terminology). Figure 1b shows pictorially the idea behind the 2-Ray method – the signal reaching the UAV is the complex sum of the direct and reflected rays, being the reflected ray seen as if coming from an image. Two hypothetical positions of the UAV also show that both incident and reflected rays have the same angles, according to the Snell law of reflection – following the fact that energy in homogeneous media should travel in straight lines, according to the shortest possible path (Balanis 2012). That condition also implies that the reflected ray comes as if from a “ghost” antenna, equidistantly positioned in regard to ground as the real antenna.
GT,I
GR,I
hR hT
x
I
x’
r
εr εr
εo εo
UAV pos #1
UAV pos #2
Ground station
Image α
α α
α
GT,x
GR,x
J. Aerosp. Technol. Manag., São José dos Campos, v10, e4218, 2018 Perotoni MB; Araújo RDP; Sartori CAF
xx/xx 04/11
where: Pt is the transmitted power; λ the wavelength; and the phase difference ∆ϕ is defined as (Eq. 2):
The reflected ray has its amplitude weighed by the reflection coefficient R defined from the usual oblique incidence formulas (Pozar 2005), which is dependent on the soil relative permittivity εr. The reflection coefficient depends on the antenna polarization used in the channel – following the convention in Pozar (2005), the vertical polarization (more often used for this sort of application) corresponds to the parallel polarization whereas the horizontal polarization relates to the perpendicular polarization. The received power Prcan then be written as (Goldsmith 2005) (Eq. 1):
The distances and the reflection angle can be written as (Eqs. 3 to 5):
where: ΓT and ΓR are the reflection coefficients of both transmitter and receiver antennas, respectively (also described as their S11 parameter). The dependency of the soil εr on the parameter R is shown in Fig. 2, for both polarizations and for two different incident angles. It can be seen that small values of incident angles generate similar reflection coefficients for both polarizations, whereas when the UAV is far away from the ground station (i.e. with large angles α) the use of vertical polarization results in smaller reflection coefficients.
Figure 2. Variation of the parameter R with different incident angles α for both polarizations. The curves for α= 5° are indistinguishable on the current scale. The curves follow equations presented in Pozar (2005).
The applied workflow is shown in Fig. 3. Equation 1 is successively applied for different points representing the relative position of the ground antenna to the UAV. Each point is univocally represented by the polar ordinate pair (rn, θn), and the ASCII files,
(1) (2) (3) (4) (5)
e
l
Df
2 2 2 4 ) 1 )( 1 ( PPr T R t úû ´
ù êë é G -G -= D - f p l l p f x'-l) D
-e
l
Df
2 , , , , ' x x e G G R l GGTl Rl Rl Rx j
+ + ´ úû ù êë é G -G -D - f p l l p f x'-l) D
-e
l
Df
(2) ´ úû ù êë é G -G -D - f p l l pf=2 (x+x'-l)
D
-e
l
Df
´ úû ù êë é G -G -D - f p l l p f D 2 2 ) (= h h r
l
R
T- +
G
G
e
a
a
a
R Th
h
r
+
atan
=
a
G
G
e
a
a
a
2 2)
(
=
x'
h
h
r
x
+
T+
R+
a
1
2 4 6 8 10 12 14 16 18 20
0.8
|Rvertical| @ α =80
o
|Rhorizontal| @ α =80 o
|Rvertical| @ α =5 o
|Rhorizontal| @ α =5 o 5o 80o 0.6 |R| εr 0.4 0.2 0
containing the 3D far-field antenna gain data. A matrix is then assembled, containing the received power for each ordinate pair representing the spatial position. The matrix contains the mapping of the datalink received power, considering the respective antenna heights and polarizations as well as soil characteristics.
Figure 3. Block diagram of the used workflow.
The full wave 3D simulation employs CST MICROWAVE STUDIO™ whereas the main program uses MATLAB.
FULL WAVE COMPUTATION – INDIVIDUAL INSTALLED ANTENNAS
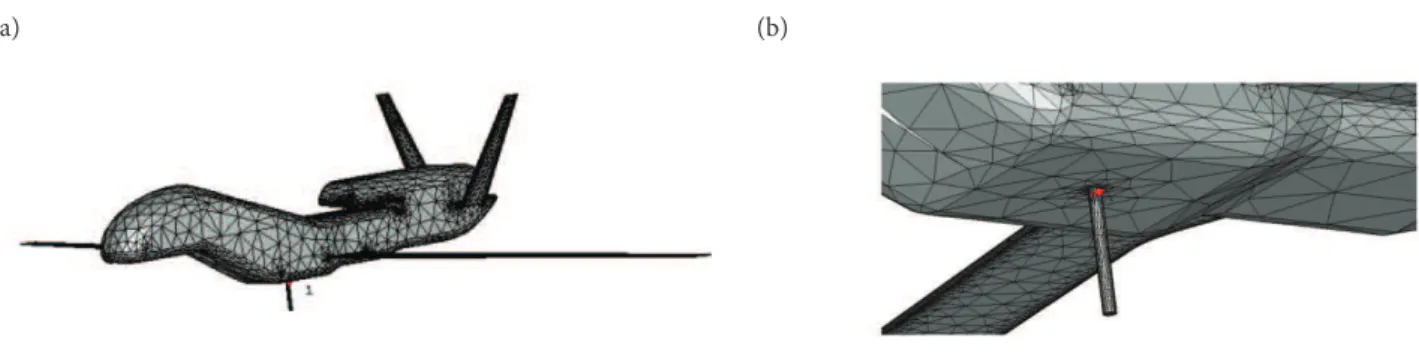
Concerning the installed performance: the UAV is a 1:10 scaled down version of the Global Hawk RQ-4A whereas the ground station is a corner reflector, positioned at a definite distance from the ground. The frequency of choice was 900 MHz. Figure 4 shows the UAV, with the surface mesh in detail. The electric size is approximately 10.7 l, and the monopole was chosen to resonate at 900 MHz (length l/4). It can be seen that the mesh close to the monopole is smaller than on the fuselage, given the large aspect ratio of the problem. The solver used was based on MoM (integral equation solver). The simulation of the complete structure, fuselage and antenna, is more complex than the isolated radiant system but it allows a better representation since the presence of the large and non-planar metallic structure distorts the monopole original far-field pattern, as reported with the Feko package and compared to measurements on a plane wing-antenna (Keller et al. 2009).
Figure 4. Scaled-down version of the UAV RQ-4A showing its surface mesh. The bottom figure shows a detail of the used antenna.
Sweep (rn, θn)
For each coordinate pair find Antenna Gains, distances , to find
received power.
Ground antenna
Received power for each (rn, θn) 3D Gain
(ascii file)
3D Gain (ascii file) Ground
antenna UAV antenna Full wave 3D simulation
UAV
J. Aerosp. Technol. Manag., São José dos Campos, v10, e4218, 2018 Perotoni MB; Araújo RDP; Sartori CAF
xx/xx 06/11
The ground station, shown in Fig. 5, was evaluated taking into account the presence of the soil in order to provide a more realistic electromagnetic model. The complete design was extracted from Antenna Magus, a database of antennas that can be synthesized according to the desired frequency range and later exported to other simulation software packages, which in turn might perform more complex analyses. It comprises a half wavelength dipole and a reflector whose sheets have an angle of 60°. The boundary conditions were set so that the soil is considered infinite, with the relative electric permittivity adjusted to its respective value. To simplify, both antennas where considered to be perfectly matched, i.e. both ΓT and ΓR coefficients are set to zero.
Due to the presence of the large soil block (dielectric), the solver of choice was the transient, based on the finite integration technique (Weiland et al. 2008), more adequate than the method of moments, used for the UAV. The transient solver, unlike the MoM, meshes the whole air volume comprising the antenna and soil.
The far-field results are shown in Fig. 6 for the UAV, and in Fig. 7 for the ground station antenna model. The ground station antenna main beam is not dynamically tilted towards the UAV, it is simulated with its position fixed aiming to the horizon (positioned as in the Fig. 7), to emulate a more general receiving position.
Figure 5. Dipole antenna and reflector positioned 2 m above the ground, detail shown at right.
Figure 6. Simulated far-field of the UAV antenna – 3D plot of the gain and the its lateral cut.
It is important to stress that the orientation of the antennas in the two full-wave electromagnetic models (UAV and ground station) should be made mutually consistent, so that their spatial orientation in both projects are set accordingly, for instance, setting both models with the z-axis as the elevation – otherwise the angle computation would provide erroneous results.
COMPLETE SCENARIO EVALUATION
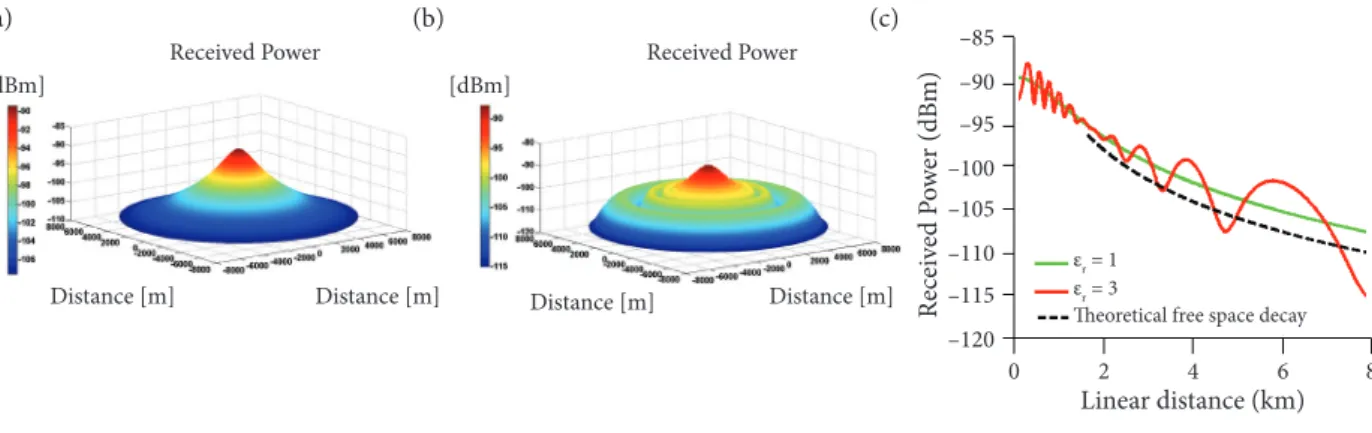
Due to the aforementioned reasons, a real world test with the mapped received power by an UAV datalink along an area is currently not available, in view of its high cost. In order to test the physical consistency of the computed results, two hypothetical cases were then evaluated: (i) soil with relative dielectric permittivity unitary and (ii) soil with εr equal to 3. The installed antennas are considered as isotropic (unitary gains), transmitted power of 1W and frequency of 900 MHz – it was assumed the operation close to the ISM band (industrial, scientific and medical), which allows non-licensed use up to 30 dBm (or 1 W) for the power fed to the antenna and 36 dBm (4 W) considering the EIRP (effective isotropic radiated power) (FCC 2005). Other frequency ranges differ in those limits, such as the 2.4 GHz, which allows larger EIRP (consequently permitting higher-gain antennas). Figure 8 shows the computed received power, where it can be seen that the scenario where the characteristics of the soil is equivalent to the air (unitary relative permittivity) has the received power falling according to the free space law (envelope shown in the figure), which is the case the situation is actually emulating. On the other hand, by assigning to the soil the relative permittivity of 3, it is possible to see that spatial oscillations due to reflections are present. These oscillations can be ascribed to the periodic constructive and destructive interferences of both rays according to the equations presented in Barowski et al. (2015), whose simulation is shown in Fig. 2. Since both cases consider unitary gain antennas, the spatial distribution of the received power is rotational symmetric. The computed results from these canonical cases show the physical consistency of the results.
[dBm]
Distance [m]
Received Power
Distance [m] [dBm]
Distance [m]
Received Power
Distance [m]
R
ecei
ve
d P
ow
er (dB
m)
–85
–90
εr = 1 εr = 3
Theoretical free space decay
–95
–100 –105
–110
–115
–120
0 2 4
Linear distance (km)
6 8
Figure 8. Computed spatial distribution of the power received (in dBm) for (a) εr= 1 and (b) εr = 3. (c) 2D cut along one axis, the theoretical curve is also shown as an envelope, for comparison.
Two more complex scenarios were evaluated, where the influence of the UAV altitude and the soil characteristics are taken into account for the real antennas analyzed in section III. They covered a radial distance of 8km between both UAV and ground station, sampled in 1024 levels of distance and 1024 angles. For the sake of scale, a distance of 8km represents 24,000l. A brute force approach would need to mesh a resonant antenna 0,5l and also cover a distance of 24,000l, a cumbersome aspect ratio to be dealt with by a mesh algorithm.
INFLUENCE OF DIFFERENT UAV ALTITUDES
Taking as input the far-field information from the UAV and ground station (in both theta and phi angular coordinates), the data is then analyzed by the code implementing the 2-Ray method (Eq. 1). For this specific scenario the UAV was simulated at a
J. Aerosp. Technol. Manag., São José dos Campos, v10, e4218, 2018 Perotoni MB; Araújo RDP; Sartori CAF
xx/xx 08/11
height of 1 km (results shown in Fig. 9) and 3 km (results shown in Fig. 10). The maximum radial distance was set to 8km and the transmitted power was set to 1W. These parameters were chosen as average figures taken from locally available UAV’s user groups.
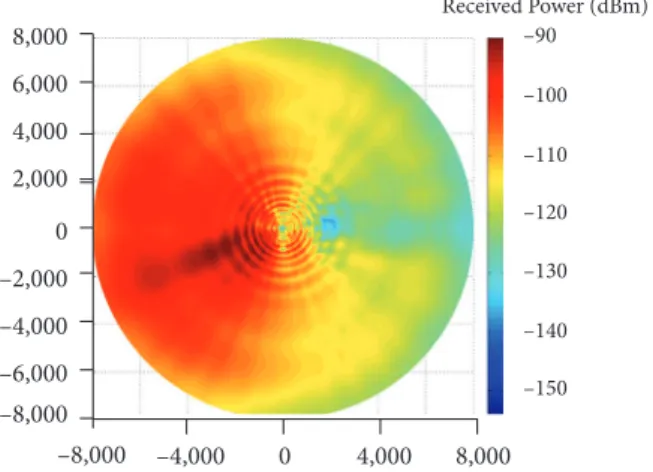
It can be seen that the higher altitudes, as expected, generate more spatial oscillations on the received power. Also, the received power is not completely radially symmetric, due to the UAV antenna gain pattern being slightly asymmetric. The impact of the directivity of the ground station antenna can also be visualized – a null (spatial position where the field amplitude is much lower than its neighboring area) is seen on the right side of the plot. It explains the usage of an omnidirectional antenna on both sides (aerial and terrestrial), to provide a more homogeneous coverage, at expenses of some positions with smaller received powers.
Figure 10. Top view of the received power (distance in meters) for the UAV at an altitude of hT = 3 km.
Figure 9. Top view of the received power (distance in meters) for the UAV at an altitude of 1 km. 8,000
Received Power (dBm) –90
–100
–110
–120
–130
–140
–150
8,000 4,000 0
–4,000 –8,000 6,000
4,000
2,000
0
–2,000
–4,000
–6,000 –8,000
8,000
Received Power (dBm) –90
–100
–110
–120
–130
–140
–150
8,000 4,000 0
–4,000 –8,000 6,000
4,000
2,000
0
–2,000
–4,000
–6,000 –8,000
INFLUENCE OF THE SOIL RELATIVE PERMITTIVITY
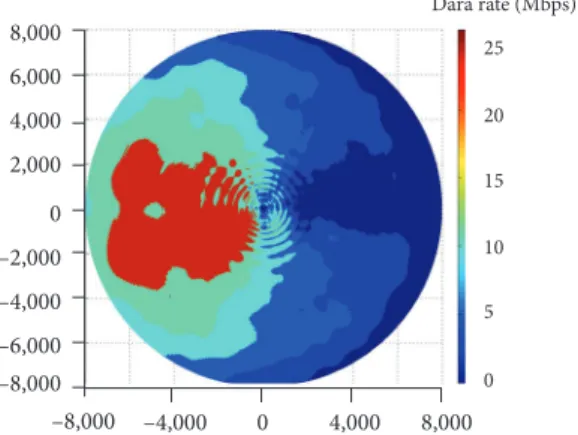
Usually the radio links transmit digital data, so the data throughput is directly proportional to the received power level. Especially in cases where real-time video or sequential image frames are required, a high data rate is needed. Table 1 shows a hypothetical example of relation between received power and channel data rate, used for the transmission, extracted from available radios. Figures 12 and 13 show the top view of the link data rate for the two values of relative permittivity, respectively 3 and 15.
It can be seen that for a soil with a large relative dielectric constant there is an area (close to the ground antenna) where, in spite of the proximity, the data throughput presents a strong variation, seen on the plot presented on Fig. 13 as small ripples around the center. These results show that a more reliable link should employ, if possible, a diversity scheme to guarantee a more stable performance over the complete flight.
–105
–110
–115
–120
–125
–130
–135
–145
–145
0 2
Linear distance (km)
R
ecei
ve
d p
ow
er (dB
m)
4 6 8
εr = 3
εr = 15
8,000
Dara rate (Mbps)
25
20
15
10
5
0
8,000 4,000 0
–4,000 –8,000 6,000
4,000
2,000
0
–2,000
–4,000
–6,000 –8,000
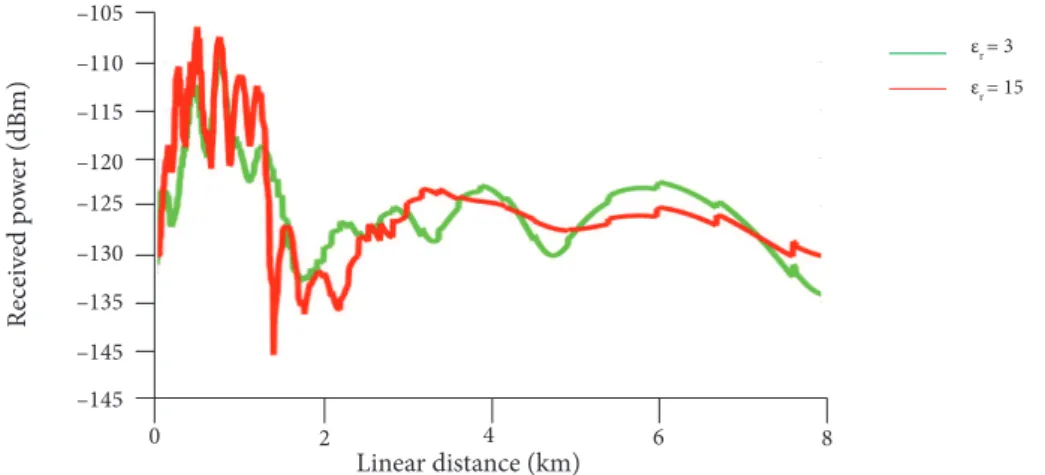
Figure 11. Received power for the UAV at an altitude of 1 km, relative permittivity of 3 and 15, ϕ= 0 cut plot.
Table 1. Relation between the received power and the data rate.
Received power (dBm) Data rate (Mbps)
Higher than –100 24
–100 11
–105 9.6
–110 4.8
–115 2.4
Smaller than –120 Noise limit
J. Aerosp. Technol. Manag., São José dos Campos, v10, e4218, 2018 Perotoni MB; Araújo RDP; Sartori CAF
xx/xx 10/11
8,000
Dara rate (Mbps) 25
20
15
10
5
0
8,000 4,000 0
–4,000 –8,000 6,000 4,000 2,000
0 –2,000 –4,000 –6,000 –8,000
Figure 13. Top view of the data rate vs. distance (m) for the UAV at an altitude of 1 km, relative permittivity of 15.
CONCLUSION
The applied workflow consist in a hybrid method that takes data from full-wave 3D solvers as input to a large scale propagation channel assessment based on the 2-Ray model, to provide a more realistic prediction of the received power in a UAV datalink. Since the received power measurement of the UAV and its antenna is a complex task, the use of the simulated results provides an
alternative to address different scenarios, with different antennas and/or different positions. The output can show both the received
power and the data rate, on a spatial distribution. More detailed information of soil electric characteristics, elevation, etc., can be considered to enhance the likelihood of prediction.
AUTHOR’S CONTRIBUTION
Conceptualization, Perotoni MB, Sartori CAF; Methodology, Perotoni MB; Software, Perotoni MB; Validation, Perotoni MB, Araújo RDP; Writing and review, Perotoni MB, Sartori CAF, Araújo RDP; Supervision, Perotoni MB.
Alshbatat AI, Dong L (2010) Performance analysis of mobile ad hoc unmanned aerial vehicle communication networks with directional antennas. International Journal of Aerospace Engineering 2010:874586. doi: 10.1155/2010/874586
Balanis CA (2012) Advanced Engineering Electromagnetics. 2nd ed. Hoboken: John Wiley & Sons.
Barka A, Caudrillier P (2007) Domain decomposition method based on generalized scattering matrix for installed performance of antennas on aircraft. IEEE Trans. on Antennas and Propagation 55(6):1833-1842. doi: 10.1109/TAP.2007.898602
Barowski J, Meiners B, Rolfes I (2015) A Monte-Carlo approach to modeling radio propagation by ray-tracing. Presented at: 9th European Conference on Antennas and Propagation; Lisbon, Portugal.
Charilaos K, Laurent F, Vincent F, Nicolas J, Joël L (2010) Use of the HYCELL model for predicting rain attenuation on UAS low elevation datalinks. Presented at: 4th European Conference on Antennas and Propagation; Barcelona, Spain.
Cheng CM, Hsiao PH, Kung HT, Vlah D (2006) Performance measurement of 802.11a wireless links from UAV to ground nodes with various antenna orientations. Presented at: 15th International Conference on Computer Communications and Networks; Arlington, USA. doi: 10.1109/ICCCN.2006.286291
Goldsmith A (2005) Wireless Communications. New York: Cambridge University Press.
Holder B (2001) Unmanned air vehicles: an illustrated study of UAV. Atglen: Schiffer Publishing.
Keller SD, Coburn WO, Weiss SJ (2009) Efficient Electromagnetic Modeling of Bent Monopole Antenna on Aircraft Wing Using FEKO. Presented at: 3rd European Conference on Antennas and Propagation; Berlin, Germany.
Kvicera M, Perez-Fontan F, Pechac P (2017) A new propagation channel synthesizer for UAVs in the presence of tree canopies. Remote Sensing 9(2):151-167. doi: 10.3390/rs9020151
Leitgeb E, Zetl K, Muhammad SS, Schmitt N, Rehm W (2007) Investigation in free space optical communication links between Unmanned Aerial Vehicles (UAVs). Presented at: 9th International Conference on Transparent Optical Networks; Rome, Italy. doi: 10.1109/ ICTON.2007.4296268
Lemorton J, Fabbro V, Kourogirogas C, Bouchard P, Rogers D, Luini L, Riva C, Vanhoenacker-Janvier D, Lacoste F, Bråten L, et al. (2011) Review of prediction methods for low-elevation, aerospace systems and new achievements. Presented at: 5th European Conference on Antennas and Propagation; Rome, Italy.
Matolak DW (2015) Channel characterization for unmanned aircraft systems. Presented at: 9th European Conference on Antennas and Propagation; Lisbon, Portugal.
Peng T, Sertel K, Volakis JL (2011) Fully overlapping domain decomposition method with h-refinement for finite element modeling of small features in large domains. Presented at: 2011 IEEE International Symposium on of Antennas and Propagation; Spokane, USA. doi: 10.1109/APS.2011.5997027
Pozar DM (2005) Microwave Engineering. 3rd ed. Hoboken: John Wiley & Sons.
Rahman MA (2014) Enabling drone communications with WiMAX technology. Presented at: Information, Intelligence, Systems and Applications; Chania, Greece. doi: 10.1109/IISA.2014.6878796
Semkin V, Solomitckii D, Naderpour R, Andreev S, Koucheryavy Y, Räisänen AV (2017) Characterization of radio links at 60 GHz using simple geometrical and highly accurate 3-D models. IEEE Transactions on Vehicular Technology 66(6):4647-4656. doi: 10.1109/ TVT.2016.2617919
Sharawi M, Aloi DN, Rawashdeh OW (2010) Design and implementation of embedded printed antenna arrays in small UAV wing structures. IEEE Trans. on Antennas and Propagation 58(8):2531-2538. doi: 10.1109/TAP.2010.2050440
Simunek M, Fontán FP, Pechac P (2013) The UAV low elevation propagation channel in urban areas: statistical analysis and time-series generator. IEEE Trans. on Antennas and Propagation 61(7):3850-3858. doi: 10.1109/TAP.2013.2256098
Stoyanova T, Kerasiotis F, Prayati A, Papadopoulos G (2009) A practical RF propagation model for wireless network sensors. Presented at: 3th International Conference on Sensor Technologies and Applications; Athens, Greece. doi: 10.1109/SENSORCOMM.2009.39
Wang X, Peng Z, Stephanson M, Lee JF (2010) Modeling EMC/EMI effects of antenna systems on large platforms using multi-solver domain decomposition methods. Presented at: 4th European Conference on Antennas and Propagation; Barcelona, Spain.
Weiland T, Timm M, Munteanu I (2008) A practical guide to 3-D simulation. IEEE Microwave Magazine 9(6):62-75. doi: 10.1109/ MMM.2008.929772
Yanmaz E, Kuschnig R, Bettstetter C (2013) Achieving air-ground communications in 802.11 networks with three-dimensional aerial mobility. Presented at: INFOCOM; Turin, Italy. doi: 10.1109/INFCOM.2013.6566747
Yin Z, Shi Z, Liang J, Wu Z (2010) Design of unmanned aerial vehicle space communication links based on DS-UWB. Information Technology Journal 9(8):1713-1718.