Design and Performance of a Matrix-assisted Laser Desorption/Ionization Tandem
Time-of-Flight Mass Spectrometer
C. P. Santacruz, E. Ayala, and C. Costa-Vera
Departamento de F´ısica y Astronomia, Escuela Polit´ecnica Nacional, Ladr´on de Guevara E11-253, Apdo. 17-01-2759, Quito, Ecuador, Tel. 593 22567846, Fax 593 22567848
Received on 8 June, 2006
A matrix-assisted laser desorption/ionization tandem time-of-flight mass spectrometer has been built with the capabilities to perform structural analyzes. The first time-of-flight mass spectrometer includes a timing ion gate to select the ions to be analyzed. After the selection process, the ions are activated using an electrically floating collision cell. The fragments produced in the collision cell are analyzed in the second time-of-flight stage. A two-step mass calibration procedure is introduced that allows one to obtain accurate mass values. The characteristics of this calibration procedure make possible to automate it. The experimental results of the tandem mass spectrometer and calibration procedure using different standard peptides are presented.
Keywords: Tadem mass spectrometry; Time-of-flight; TOF/TOF; MS/MS; MALDI; Automation; Mass calibration
I. INTRODUCTION
At the end of the 1980’s, two soft ionization techniques were introduced: electrospray ionization [1] and matrix-assisted laser desorption ionization (MALDI) [2,3]. Both techniques proved to be very efficient to ionize large intact molecules as high as 105 Da. The availability of such high
molecular mass ions and the introduction of suitable fragmen-tation techniques (whereby the molecular ions can be physi-cally divided into smaller structurally-specific fragments) ex-panded the application of mass spectrometry enormously. For instance, it became common to study the chemical structure of biomolecules with the aid of the so called tandem mass spectrometers. Tandem mass spectrometry (MSn) is the use of successive multiple mass spectrometry (MS) analyses in the same or different mass spectrometers to study the molec-ular fragments. Thus, tandem mass spectrometry has become fundamental to the development of proteomics, genomics and metabolomics [4,5]. A tandem mass spectrometer usually consists of: (1) an ion source to generate molecular ions, (2) a device to select a desired precursor type of ion, (3) a fragmen-tation stage to divide the precursor ions out in specific pieces, and (4) one or more mass analyzers to determine the mass of the remaining precursor and fragment ions, in one or more successive MS steps.
There are many different types of tandem mass analyz-ers, but they all mix together some of the following types of mass spectrometers: linear traps [6], Fourier transform ion cy-clotron resonance mass spectrometers (FTICR) [7], orbitraps [8], triple quadrupoles [9], and time-of-flight (TOF). Recently, two forms of tandem TOF mass spectrometers have emerged independently. The first of these is a hybrid quadrupole-TOF instrument, which can be used with electrospray ionization, atmospheric pressure MALDI or any other high pressure ion-ization methods [10,11]. In these instruments, the first mass spectrometer stage is a quadrupole mass analyzer which se-lects, accumulates, and activates the precursor ions through low energy collisions with residual gas. The resulting prod-ucts are analyzed with a subsequent TOF mass analyzer. The
second form of tandem TOF instruments is the dual TOF, or TOF/TOF [12-15]. In this kind of instrument, the precur-sor ions are selected in a first TOF (MS1). These selected
ions might then be activated through high energy collisions with neutral molecules (collision induced dissociation, CID) or by photon absorption (laser induced dissociation). Colli-sion induced dissociation is a fragmentation technique which increases the internal energy of precursor ions by a single high energy collision (higher than 1000 eV) or multiple low energy collisions (around 100 eV) [15]. The latter case typically pro-duces less fragmentation pathways than high energy CID [16]. Finally, the mass of the fragmentation products is determined in the second mass spectrometry stage that is usually a reflec-tron TOF mass analyzer (MS2).
There are several variations of TOF/TOF instruments which are described next. The Lift TOF/TOF is a post acceleration device which lifts the potential of a region before the accel-eration stage of MS2when the precursor and fragment ions
are inside it [14]. Another post acceleration TOF/TOF has a grounded fragmentation cell, and the high voltage of the acceleration region is increased from ground to high voltage [13]. In other version of TOF/TOF instruments, the precursor ions are decelerated before the collision cell, and the acceler-ation stage of MS2is pulsed to high voltage [12].
In all cases concerning MSn, a strong requirement is set on
in the first TOF already. On the other hand, if some stan-dards would let through the selectors, since the high voltage pulse that accelerates the precursor and fragment ions in MS2
is timed when they are in the acceleration stage of MS2, these
standards will not be accelerated equally and will not have the same conditions as the precursor ion. However, peptides and proteins usually produce several known fragments, such as immonium and other low mass ions [16], which if present can be used to calibrate the CID spectra. These fragments can be identified using an external calibration procedure.
The present article describes the characteristics of a home-built MALDI tandem TOF/TOF mass spectrometer with a floating collision cell, reflectron and delayed extraction. In this instrument, a deceleration stage is placed before the float-ing collision cell to control the final collision energy of the precursor ions as they enter the cell. An external calibration procedure has been developed that uses the acceleration po-tentials, mass of the precursor ion, dimensions of the second TOF stage and timing of the voltages. The external calibra-tion is used to identify immonium and low mass products, with which in turn an internal calibration procedure is per-formed afterwards. The report will focus in the performance of such instrument especially in the physical conditions under which the CID analysis of peptides and proteins can be made, and will highlight both the capabilities of the instrument, and some of the problems which still compromise its performance. The system has been tested using some standard commercial peptides.
II. EXPERIMENTAL
A. Sample Preparation
The widely used MALDI matrix alpha-cyano-4-hydroxy-cinnamic acid (CHCA) was purchased by Fluka and was dis-solved in 50% methanol to a concentration of 10 g/l. All pep-tides (Sigma) were dissolved in 0.1% trifluoroacetic acid to a concentration about 10−5M. Small amounts of NaCl were added to some samples to generate [M+Na]+signals of ap-proximately the same strength as the [M+H]+signal. Samples were prepared by mixing 10µlof matrix solution with 5µlof analyte. Then 3µlof the mixture was deposited on a metal-lic holder and left to dry at room temperature. After drying, a thin crystalline cake did form which was brought into the mass spectrometer for analysis. Mass spectra were produced by directing a focused N2-laser pulse onto the sample inside
of the vacuum environment of the instrument. Over hundred spectra were added each time to improve statistics.
B. Instrumentation
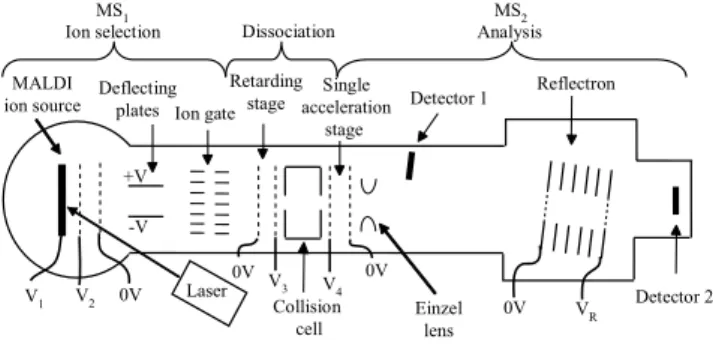
The TOF/TOF instrument diagramed in Fig. 1 was con-structed modifying a previously existing single TOF mass spectrometer [23]. The first TOF stage used for ion produc-tion and discriminaproduc-tion has a dual-stage Wiley-McLaren ion
MALDI
ion source Ion gate
Collision cell
Single acceleration
stage
Reflectron
Detector 2 Detector 1
Laser Deflecting
plates
Einzel lens Retarding
stage MS
1 Ion selection
MS 2 Analysis Dissociation
V1 V2 0V -V +V
0V
V3 V4 0V
0V VR
FIG. 1: A schematic representation of the home-built tandem TOF mass spectrometer. The ion source is MALDI with two consecu-tive acceleration stages. Timing the ion gates, the precursor ions are selected at the end of the first TOF. A floating collision cell deceler-ates the precursor ions to the appropriate kinetic energy and induce their fragmentation. Finally, the fragments are analyzed in the sec-ond TOF stage.
source with lengths of 7 mm and 13 mm for each stage respec-tively. After the ion source, a 205 mm long drift region, mea-sured from the exit grid of the ion source to the center of the ion selector, separates the different ions according with their mass-to-charge ratios. Two sets of parallel deflecting plates are located after the ion source to steer the beam in two di-rections orthogonal to each other and to the ion path. The ion selector, which is placed at the end of the field-free drift region, operates in the manner of a dual-gate revolving door, this device has been described elsewhere [24]. Briefly, it con-sists of two sets of interleaved metal-ribbon-combs which are arranged in front of each other and separated by a 10 mm gap so that the ions can pass through. The ion selector uses the mass dependent flight time of the ions to isolate them by using timed deflectors. The sets of ribbon pieces open or close one after the other in turn in an accurately timed fashion. To open or close the gate, a transverse electric field between electrodes in the deflectors is switched off/on respectively. The first gate is normally closed and only opens when the ions of interest approach it. The second gate which comes next downstream remains open all the time and begins to close precisely at the moment when the desired ion bunch has passed through. In this way other both higher and lower mass ions are filtered out. For optimal ion selection the ion bunch should form a tightly packed group inside the gap between the gates during the switching of the fields, otherwise it can be degraded signif-icantly if the ions are too widely spread at that position. The dual ion gate operating in revolving door configuration has a resolution around 500 that is enough to analyze mixtures of peptides.
The system uses high voltage pulses for ion acceleration, deflection, and reacceleration, which are generated by means of home-built circuits based on fast high voltage switches of the push-pull type (Behlke Electronic, Kronberg, Germany). The timing sequence of TTL pulses for the different pulsed voltages was provided by a delay generator (Model DG535, Stanford Research Systems, USA).
decel-eration stage is used to control the collision kinetic energy of the ions entering the collision cell. The downstream end of this stage was defined by the wall of the collision cell, which is electrically floating at the same deceleration voltage. The collision cell is cylindrical and coaxial with the ion beam and it is 80 mm long. Air was injected in the middle of the cell, with the aid of a pulsed gas valve (General Valve Series 9, Parker Hannifin Corporation, Fairfield, USA).
To assure enough collisions of the ions with the neu-tral molecules and induce their fragmentation, the valve was opened for 190µs. In principle, the parent and fragment ions leave the collision cell with about the same velocity distrib-ution before entering the acceleration region of MS2. This
region performs a delayed extraction, 14 mm long, single-acceleration stage. The high voltage pulse for single-acceleration in this source increases the voltage of the electrode at the be-ginning of the ion source from the voltage of the collision cell up to a final higher extraction voltage.
The end electrode remains grounded for this ion source. Thus, when the ions enter the acceleration stage, there is al-ready an electric field present generated by the deceleration voltage that is increased by activating the switch. To reduce losses and to focus axially the ion beam, an Einzel lens is placed immediately after the acceleration stage of MS2.
Af-ter the ions flight through the field-free region, they enAf-ter the ion mirror. This mirror is a 289 mm long, tilted at 1.05 de-grees single-stage reflectron that redirects the reflected ions into the corresponding detector. The total length of the field-free region of MS2 is 1183 mm long. Both the linear and
the reflecting detectors are dual micro-channel plate arrays in Chevron configuration. The linear detector is located behind the reflectron and can be used when the reflecting field is less than the acceleration voltage or zero [23]. Ion signals were acquired with a digital oscilloscope (Tektronix TDS5000) and transferred to a computer for further analysis.
C. Mass Calibration
An external calibration procedure was developed consider-ing the flight time, acceleration potentials, timconsider-ing of the ex-traction pulse of MS2and geometric properties of MS2. The
total flight time of an ion can be expressed as:
t=tp+
v4−vc
a4 +L2
v4 +2v4
aR
(1)
wheretpcorresponds to the clock time at the instant when the
high voltage pulse in the ion source of MS2 is triggered,vc
is the collision velocity of the precursor ions, relative to the laboratory frame,v4 is the velocity that ions acquire as they
leave the ion source of MS2,a4is the approximately uniform
acceleration of the ions in the acceleration stage of MS2,L2
is the total drift length of MS2, andaRis the acceleration in
the reflectron. The velocitiesvcandv4depend on the nominal
acceleration voltages and distances by
vc=
r m M
2zVc
m (2)
and
v4=
r m M
2zVc
m +
2zV4
m (3)
wherezVcis the collision kinetic energy of the precursor ion,
V4 is the acceleration potential of the acceleration stage of
MS2,mis the mass of the fragment ion andMis the mass of
the precursor ion. It follows that Equation 1 can be expressed as
t=tp+
r 2m
z à p
V4+MmVc− pm
MVc V4
d4
+ L2
2p
V4+MmVc
+2 p
V4+MmVc VR
dR !
(4)
whered4is the length of the acceleration region of MS2,dRis the length of the reflectron andVRis the reflectron voltage. From
this equation, them/zratio can be obtained as m
z = 1 2
(t−tp)2
à √
V4+mMVc−√mMVc V4 d4
+ L2
2√V4+MmVc+
2√V4+mMVc VR dR
!2 (5)
The external calibration is an iterative procedure based on the previous equation that requires the mass of the precursor ion, its time of flight and the nominal acceleration voltages. Using Equation 5 and considering the factor m/M=1 for the first iteration, the mass of the fragment ions are calculated. The following iterations improve the precision of the calculated
masses using Equation 5 and the values obtained in the previ-ous iteration. After achieving high precision the iterative pro-cedure is stopped, and the calculated masses are corrected by multiplying them for the ratio between the exact mass (Mexact)
the precursor ions, that is
µm z
corrected
= µm
z 
calculated
µ M
exact
Mcalculated
¶ (6)
This calibration is used to identify known immonium ions or low mass fragments of amino acid residues. Once some low mass fragments are positively identified, the spectrum can be recalibrated internally using a third order polynomial equa-tion.
µm z
¶1/2
=a0+a1t+a2t2+a3t3 (7)
The initial values for the parametersaiare obtained from the
external calibration procedure. Equation 5 does not require the characteristics of MS1; therefore, the external calibration
procedure could be applied to any mass spectrometer working under the same conditions assumed to obtain this equation. That is, all fragment and precursor ions have the same velocity distribution when they are accelerated in the single-stage ion source of MS2. Moreover, this equation could be extended
for other tandem TOF mass spectrometers, for instance, TOF with two-acceleration stages in MS2equipped with one-stage
or two-stage reflectrons.
III. RESULTS
The selectivity of the ion gate was tested using the pro-tonated ion ([M+H]+) of substance P and its sodium adduct ([M+Na]+). To focus the ions at the ion selector position, the extraction voltage was pulsed from 7100 V to 9500 V after a delay of 430 ns. The ion selector was used in the revolv-ing door configuration with two gates. The voltage of the first gate was decreased from 1000 V to zero with a 30 ns ramp, just before [M+H]+entered the gate at around 6605 ns under our experimental conditions. The second gate was closed by increasing the voltage from zero to 1000 V immediately after the [M+H]+ions passed through the gate at around 6635 ns (Fig. 2B). The 30 ns open time was enough to let only the de-sired precursor through with a resolving power of about 500. By changing the timing of both gates to 6685 ns and 6715 ns respectively, [M+Na]+was selected instead (Fig. 2C). Try-ing shorter selection windows for the ion gate, resulted in de-creased sensitivity, and did not improve effectively the res-olution, it was not possible, thus, to select just one isotopic component of the substance P precursor ion.
The characteristics of the instrument in tandem configura-tion were studied using substance P, angiotensin I, bombesin, and insulin chain B. All data presented here were acquired with 9 kV in MS1and 13 kV in MS2. The operating
condi-tions of MS1(voltages and delays) were chosen to focus the
precursor ions close to position of the ion selector at the end of MS1.
To reduce the laboratory collision energy of precursor ions to 2 keV, the collision cell was electrically floating. After col-lision of the precursor ions with molecules of air, the precursor and fragment ions were separated from each other in MS2. To
m/z
1340 1400
Relative Intensity
1360 1380
[M+H]
[M+H]
[M+Na]
[M+Na]
+ +
+
+ (A)
(B)
(C)
FIG. 2: Ion selector mass spectra of substance P showing the m/z region spanning [M+H]+, and [M+Na]+. (A) Both gates off (grounded), (B) isolated [M+H]+,tgate=6.605µs,Vgate=1kV, and
(C) isolated [M+Na]+,tgate=6.685µs,Vgate=1kV. Delayed
ex-traction conditions: pulse = 9.5 kV, second acceleration stage = 7.1 kV, delay = 0.430µs.
m/z
200 1200
R
el
at
iv
e
In
te
ns
ity
400 600 800 1000
a2
b2
d3a3
a4 d5
a5 d6
a6
a7 a8
d10
a7 (A)
Probability Based Mowse Score
20 30 40 50 60
Num
ber
of
Hits (B)
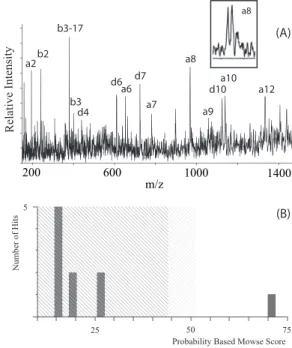
FIG. 3: (A) The CID spectrum of substance P (RPKPQQFFGLM) showing extend fragmentation. The spectrum is full ofaanddtype fragments caused by the position of the argenine residue in the N-terminal. (B) Probability based Mowse score after database search.
accelerate the precursor and fragment ions, the timing of the voltage pulse of MS2 was set equal to the flight time of the
precursor ions to the beginning of the acceleration region. Mass spectra were calibrated externally by using the proce-dure described above. With this proceproce-dure some immonium or low mass fragment ions were identified and, in combination with the mass of the precursor ion, it was possible to recali-brate the spectra internally. With the final mass of the frag-ments, the peptide sequence was obtained by using a public access search engine (MASCOT, MS/MS Ions Search).
focus fragments with masses around 1000 Da at the detector position. Under these conditions, the mass resolving power for ions with mass 226 Da is 850, for ions with mass 1001 Da is 1900, and for precursor ions (1348 Da) is 1450. Using the external calibration was possible to identify some immonium ions and low mass fragments (Table I) corresponding to amino acids present in the peptide sequence. After internal calibra-tion, the fragment list was analyzed with MASCOT. From the results list, an unnamed protein product corresponding to the substance P sequence (Bos Taurus, access number gi1364200, NCBInr database) got the highest Mowse score (Fig. 3B) [25].
Figures 4A and 5A show the high energy CID spectra of an-giotensin I and bombesin. The mass resolving powers range from 900 to 2000 in both cases. The analyses of the fragment list using the public access search engine for these peptides are shown in Figs. 4B and 5B respectively, and the results for the database search are summarized in Table I. The root mean square (RMS) errors, obtained using the external calibration, were between 700 ppm to 1400 ppm. The internal calibration procedure reduced the mass error to values four to five times. Insulin chain B is a larger peptide which was not possible to identify using the above indicated procedures. In this case, the limitation was mainly the low intensity of the generated fragment ions and the missed cleavage sites. This low inten-sity reduced mass accuracy by introducing ambiguities in the peak centroid determination from the subjacent noise in the spectra. However, some low mass ions were identified using the external calibration procedure, and the internal calibration reduced the RMS mass error two times. Besides ion intensity, ripples in the high voltage power supplies contribute to reduce the mass accuracy and this effect is exacerbated as masses get larger. A combination of these and other technical factors (limitations in the manufacturing of the acceleration stages, alignment of the ion optics, and grid effects) seem to be lim-iting the mass resolving power to a value below 3000 in all our spectra. To increase the ion intensity, the ion transmission from the ion source, through the second TOF to the detector could be improved by using proper ion optics and/or gridless acceleration regions for MS1. Increasing the ion transmission,
it is possible to get higher mass resolving power for tandem spectra. Besides, the overall resolving power in TOF/TOF instruments could be improved by using a two-stage accelera-tion region in MS2[26].
In our case, high energy CID of substance P, angiotensin I, and bombesin using air as target molecules produced ex-tended fragmentation. The mass error after the external cali-bration procedure let us to identify some low mass fragments and gave initial values for the coefficients of the final third order internal calibrating equation. Even with a modest reso-lution of around 2000, the information carried by the fragment ions was enough to identify peptides in the 800-1700 Da mass range with the aid of public access databases and search en-gines. The RMS error obtained using the external calibration was between 300 ppm to 900 ppm. The internal calibration procedure reduced the mass error to values four to five times.
m/z
1200 1000
800 600
400
d3
a3 a4
d5 a6
b6
a8 d9
Probability Based Mowse Score 20 30 40 50 5
Num
ber
of H
its
a6
(A)
(B)
Relat
ive I
nte
nsity
FIG. 4: (A) The CID spectrum of angiotensin I (DRVYVHPFNL). The argenine close to the N-terminal produceaanddtype fragments. The intensity of the fragments is low, but it was enough to produce a positive identification. (B) Probability based Mowse score after database search.
m/z
200 600 1000 1400
b2 b3-17
d4 b3
d6 a6
d7
a7 a8
a10 a12
Relat
ive I
nte
nsity
a9 d10 a2
Probability Based Mowse Score
25 50 75
Num
ber
of
Hit
s5
a8
(A)
(B)
FIG. 5: (A) The CID spectrum of bombesin (pEQRLGN-QWAVGHLM) shows similar characteristics to peptides containing N-terminal argentine residue, that is, there are abundantaandd frag-ments. (B) Probability based Mowse score after database search.
IV. CONCLUSIONS
Peptide Low mass Ions RMS mass error RMS mass error Access number External Cal. Internal Cal. NCBInr database
[Da] [ppm (Da)] [ppm Da]
Substance P 70, 101, 112, 129 1224 (0.31) 152 (0.09) gi13634200
Angiotensin I 110, 129, 136 708 (0.25) 203 (0.10) gi223630
Bombesin 86, 110, 129 890 (0.25) 165 (0.07) gi229440
Insulin Chain B 70, 110 1380 (2.6) 845 (1.5) —–
TABLE I: Summarized results showing the identified immonium ions using the external calibration, and the RMS mass error using the external and internal calibrations.
analyze mixtures of peptides. The electrically floating colli-sion cell produces extended fragmentation for further analy-sis. The system has a mass resolving power of around 2000 that was enough to identify three of four peptides tried in this work with a regular Mowse score. More demanding applica-tions with ’real life’ samples will require substantially incre-ment of the resolving power and mass accuracy to make the identification reliable and less ambiguous. For resolution im-provement, it is necessary to improve the ion optics and ion detection systems of the instrument. Other improvements are required in the electronics and computer controlled data ac-quisition parts to increase the throughput of the system. The two-steps calibration procedure uses an external calibration to identify low mass ions, followed by an internal calibration using the information gathered in the previous step. The ex-ternal calibration does not consider the characteristics of the first mass spectrometer; it uses only the nominal acceleration
voltages, the mass of the precursor ion and the characteris-tics of the second TOF mass spectrometer. Thus, it is possi-ble to have an automated external mass calibration for further recalibration at any operating conditions. In our case the in-ternal calibration is a third-order polynomial, however, any other equation could be used to calibrate the mass spectra. Further developments may include an automated calibration procedure for the spectra that would combine the external cal-ibration procedure, a peak recognition algorithm, and a reli-able internal calibration.
Acknowledgments
The financial support from the International Program in the Physical Sciences of Uppsala University is gratefully ac-knowledged.
[1] J. B. Fenn, M. Mann, C. K. Meng, S. F. Wong, and C. M. White-house, Science246, 64 (1989).
[2] K. Tanaka, H. Waki, Y. Ido, S. Akita, Y. Yoshida, T. Yoshida, and T. Matsuo, Rapid Commun. Mass Spectrom.2, 151 (1988). [3] M. Karas and F. Hillenkamp, Anal. Chem.60, 2299 (1988). [4] J. Peng and S.P. Gygi, J. Mass Spectrom.36, 1083 (2001). [5] T. Werner, Mass Spectrom. Rev.23, 25 (2004).
[6] W. Paul, Rev. Modern Physics62, 531 (1990).
[7] S. Guan and A.G. Marshall, Int. J. Mass Spectrom. Ion Proc. 146:147, 261 (1995).
[8] A. Makarov, Anal. Chem.72, 1156 (2000).
[9] Y. Huang, G. Li, S. Guan, and A.G. Marshall, J. Am. Soc. Mass Spectrom.8, 962 (1997).
[10] A. Shevchenko, A. Loboda, A. Shevchenko, W. Ens, and K.G. Standing, Anal. Chem.72, 2132 (2000).
[11] I. V. Chernushevich, A. V. Loboda, and B. A. Thomson, J. Mass. Spectrom.36, 849 (2001).
[12] M. Vestal, P. Juhasz, W. Hines, and S. Martin, An Improved Delayed Extraction MALDI-ToF MS for PSD and CID, Pro-ceedings of the 46th ASMS Conference on Mass Spectrometry and Allied Topics, page 35, May 32 - Jun 4 1998.
[13] K. F. Medzihradszky, J. M. Campbell, M. A. Baldwin, A. M. Falick, P. Juhasz, M. L. Vestal, and A. Burlingame, Anal. Chem. 72, 552 (2000).
[14] D. Suckau, A. Resemann, M. Schuerenberg, P. Hufnagel, J. Franzen and A. Holle, Anal. Bioanal. Chem.376, 952 (2003).
[15] L. Sleno and D.A. Volmer, J. Mass Spectrom.39, 1091 (2004). [16] I. A. Papayannopoulos, Mass Spectrom. Rev.14, 49 (1995). [17] D. H. Russell and R. D. Edmondson, J. Mass Spectrom.32, 263
(1997).
[18] K. R. Clauser, P. Baker, and A.L. Burlingame, Anal. Chem.71, 2871 (1999).
[19] R. J. Cotter, Anal. Chem.64, 1027A (1992).
[20] G. Montaudo, M. S. Montaudo, C. Puglisi, and F. Samperi, Anal. Chem. 72, 552 (2000).
[21] C. Costa-Vera, R. Zubarev, H. Ehring, P. H˚akansson, and B.U.R. Sunqvist, Rapid Commun. Mass Spectrom. 10, 1429 (1996).
[22] C. A. Hack and W. H. Benner, Rapid Commun. Mass Spectrom. 13, 1304 (2002).
[23] C. Costa-Vera, Matrix-assisted Laser Induced Desorp-tion/Ionization of Biomolecules, Departamento de F´ısica – Es-cuela Polit´ecnica Nacional, Departamento de F´ısica, Ladr´on de Guevara E11-253, Quito, Ecuador, 1999.
[24] C. K. G. Piyadasa, P. H˚akansson, T. R. Ariyaratne, and D. F. Barofsky, Rapid Commun. Mass Spectrom.12, 1655 (1998). [25] D. J. C. Pappin, P. Hojrup, and A. J. Bleasby, Curr. Biol.3, 327
(1993).
![FIG. 2: Ion selector mass spectra of substance P showing the m/z region spanning [M+H] + , and [M+Na] +](https://thumb-eu.123doks.com/thumbv2/123dok_br/18982055.457395/4.892.507.803.78.300/fig-ion-selector-spectra-substance-showing-region-spanning.webp)