Deformation of elastomeric chains related to the
amount and time of stretching
Denise Yagura1, Paulo Eduardo Baggio2, Luiz Sérgio Carreiro3, Ricardo Takahashi3
Objective: To investigate a potential relationship between degree of stretching and resulting permanent
defor-mation of elastomeric chains (ECs) as well as whether or not stretching time has any bearing on the degree of permanent deformation. Methods: Five-module segments of closed elastomeric chains manufactured by 3M Unitek were stretched to 10-100% of their original length in devices especially designed for this purpose, remaining submerged in artiicial saliva at 37 ± 1° C and were removed sequentially ater 1, 2, 3 and 4 weeks. Upon removal, each segment was measured and, once recorded the values, were statistically analyzed with the purpose of assessing the degree of permanent deformation. Conclusions: It was concluded that permanent deformation is directly proportional to the degree of stretching of the ECs assessed. The mean percentages found were 8.4% to 10% of stretching, and exceeding 20% (21.3%) when stretched by 40%, and reaching 56.6% permanent deformation when stretched 100% of their original length. Finally, the highest percentage of permanent deformation occurred during the irst week and was not statisti-cally signiicant ater this period.
Keywords: Elastomers. Tensile strength. Permanent deformation.
How to cite this article: Yagura D, Baggio PE, Carreiro LS, Takahashi R. Deformation of elastomeric chains related to the amount and time of stretching. Dental Press J Orthod. 2013 May-June;18(3):136-42.
Submitted: July 10, 2009 - Revised and accepted: March 29, 2010
Contact address: Denise Yagura
Rua Visconde de Nassau, 650 – Apto 802 – Zona 07 CEP: 87.020-0230 – Maringá/PR – Brazil E-mail: [email protected]
» The authors report no commercial, proprietary or financial interest in the products or companies described in this article.
1 Graduated in Dentistry, School of Dentistry of Barretos. Specialist in
Orthodontics. Londrina State University (UEL).
2 Associate Professor, Graduate Program Director in Orthodontics, UEL. 3 Associate Professor, UEL.
Objetivo: veriicar a possível relação entre o grau de estiramento e a consequente deformação permanente dos
elás-ticos em cadeia, bem como se o fator tempo de estiramento tem inluência sobre o grau de deformação permanente.
Métodos: segmentos de 5 elos de elásticos em cadeia curta da Unitek/3M foram estirados em de 10 a 100% de seu
comprimento original, em dispositivos especialmente idealizados para essa inalidade, permanecendo submersos em saliva artiicial a 37 ± 1°C e removidos, sequencialmente, após uma, duas, três e quatro semanas. Quando de sua remoção, para se avaliar o grau de deformação permanente, cada segmento era medido e os valores registrados submetidos à análise estatística. Conclusão: pode-se concluir que a deformação permanente foi diretamente propor-cional ao grau de estiramento dos elásticos em cadeia avaliados, onde os percentuais médios encontrados foram de 8,4% com 10% de estiramento, ultrapassando o percentual de 20% (21,3%) quando distendidos em 40%, chegando a 56,6% de deformação permanente se estirados em 100% de seu comprimento original. Por im, o maior percentual de de-formação permanente ocorreu durante a primeira semana, não sendo estatisticamente signiicativo após esse período.
INTRODUCTION AND LITERATURE REVIEW
Among the various force-producing mechanisms used in orthodontics to move teeth as physiologically as possible through the alveolar bone, elastomeric chains (ECs) are undoubtedly the most widely employed in daily practice.14,15
EC insertion and removal requires little chair time and is not dependent on patient compliance. Furthermore, ECs are inexpensive and compatible with soft tissues.8 When stretched, ECs generate
elastic potential energy that can be transformed into mechanical energy, which in turn produces tooth movement. Given that they are made from amor-phous polyurethane-based polymers, ECs exhibit characteristics of both rubber and plastic, which ac-counts for their elasticity.5 The polymers are
com-posed of primary and secondary links with weak mo-lecular attraction that initially display a spiral pattern. When this pattern is subjected to the application of forces it undergoes deformation, causing ECs to be arranged linearly through crosslinking. The weak secondary links allow the spiral pattern to be trans-formed into a linear pattern while recovery of the initial structure becomes possible by means of cross-linking.16 Permanent deformation occurs when the
polymer is stretched beyond its elastic limit, caus-ing disruption of crosslinks. However, certain fac-tors influence EC performance, such as rapid force decay after stretching, i.e., inability to develop con-stant forces for an extended period of time, thereby impairing their effectiveness.1,3,7,13,14,16 Additionally,
ECs are influenced by temperature variations, sali-vary pH and the degree of stretching to which they are subjected.14 In the oral environment, ECs absorb
water, saliva and pigments, eventually undergoing chemical degradation, which results in the weaken-ing of intermolecular forces, thereby decomposweaken-ing their internal links. This leads to the onset of force decay processes, lack of dimensional stability and permanent deformation, making it difficult to deter-mine the actual force magnitude being delivered to a given tooth.3 Therefore, this in vitro study aimed to
investigate the potential relationship between degree of stretching and resulting permanent deformation of elastomeric chains (ECs), as well as determine whether or not stretching time has any bearing on the degree of permanent deformation of ECs.
MATERIAL AND METHODS
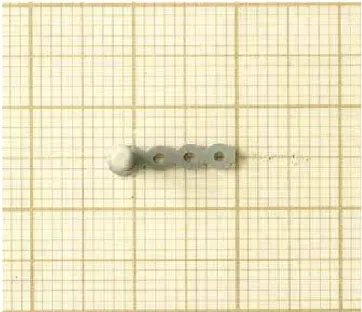
For this research, closed gray ECs (CK Chain Spool - 3M Unitek), were carefully sectioned into segments of five modules each, with an initial length of 10 mm, ignoring the two ends of the segments, whose function was only to facilitate EC stretching. Four acrylic plates were fabricated and perforated for the insertion of 20 stainless steel pins with 0.2 cm diameter and 1.5 cm length arranged in parallel in 10 pairs with increasing distance between them in 1.0 mm increments, starting from 1.1 cm and ending with 2.0 cm. Ten EC segments were fitted to each pair of pins with the aid of a Mathieu needle holder, and were thus stretched to 10-100% of their origi-nal length. To prevent the pins from approaching each other due to the tension produced in stretching the ECs, a pin of equal length was fitted between all pairs of pins as shown in Figure 1. The plates were immersed in a stainless steel case containing artifi-cial saliva with the following composition: Calcium 1.5 mmol L-1, Phosphate 0.9 mmol L-1, KCL 150 mmol L-1 in cacodylate buffer, 0.1 mol L-1 pH 7.0, Fluorine 0.05 mg/mL (1.1 mL solution/mm2). This
case was kept closed and in water bath at 37 ± 1° C in a soaking tub (Fig 2). These plates were first iden-tified with a black OHP marker pen, according to the duration of the experiment. It is noteworthy that the water level was kept below the stainless steel lid, thus preventing contamination of the artificial saliva. Subsequently, the plates were removed sequentially after 1, 2, 3 and 4 weeks. Once retrieved from the saliva and blotted dry, each elastomeric segment was fitted to a measuring device especially made for this purpose consisting of a pin fixed to a wooden base, covered with graph paper (Fig 2). One end of the EC was seated in the pin and its final length recorded on graph paper. Thereafter, the length of each EC was measured and recorded with a caliper. Each week, the artificial saliva was replaced. It was first pre-heated in a container up to a temperature of 37 ± 1 °C, thereby averting changes in temperature.
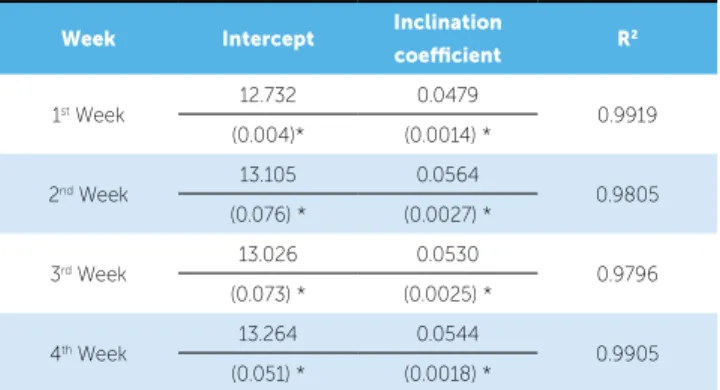
In order to assess to what extent the mean defor-mation was similar in all weeks, the test of equality of inclination coefficient was applied with a 5% level of significance (p = 0.0556). This was necessary because the hypothesis which assumed that the mean defor-mation in at least one week was influenced by the percentage separation between the pins was rejected. The magnitude of these differences can be seen in Table 6, in the inclination coefficient column. Table 6 also shows the mean stretching throughout the lev-els of separation for each week. The term intercept re-fers to the estimated mean deformation in millimeters in each week, irrespective of distance. The expression inclination coefficient refers to the mean change in one distance unit (10%). In the first week, regardless of distance, a mean deformation of 0.0479 mm per 10% stretching was found, i.e., in order to reach a mean deformation of 10% to 50% stretching, or 20% to 60%, one can simply multiply 0.0479 mm by 5, and a deformation of 0.23 mm is obtained. In the second week, the deformation was 0.0564 mm, in the third was 0.0530, and in the fourth, 0.0544 mm.
Based on the analysis of covariance (ANCOVA), it was found initially that, for all weeks, the mean de-formation depends linearly (Fig 3) on the percentage of pin stretching (p < 0.001), i.e., in at least one of the weeks the mean deformation was influenced by the percentage of pin stretching (independent variable).
Since the hypothesis of lack of parallelism is not rejected yet, the mean elongations were compared be-tween weeks (distances bebe-tween the adjusted straight lines). These results can be seen in Figure 4.
Figure 1 - Acrylic plate with stretched elastomeric chains.
Figure 2 - Soaking tub used in the experiment.
RESULTS
Overall, it was found that permanent deforma-tion of ECs was propordeforma-tional to increases in stretch-ing (Table 5). However, it was found that the mean deformation observed in the second, third and fourth weeks difered signiicantly from the mean stretching observed in the irst week. No statistically signiicant diferences were found in comparing the second to the third, the second to the fourth as well as the third to the fourth weeks (Table 7).
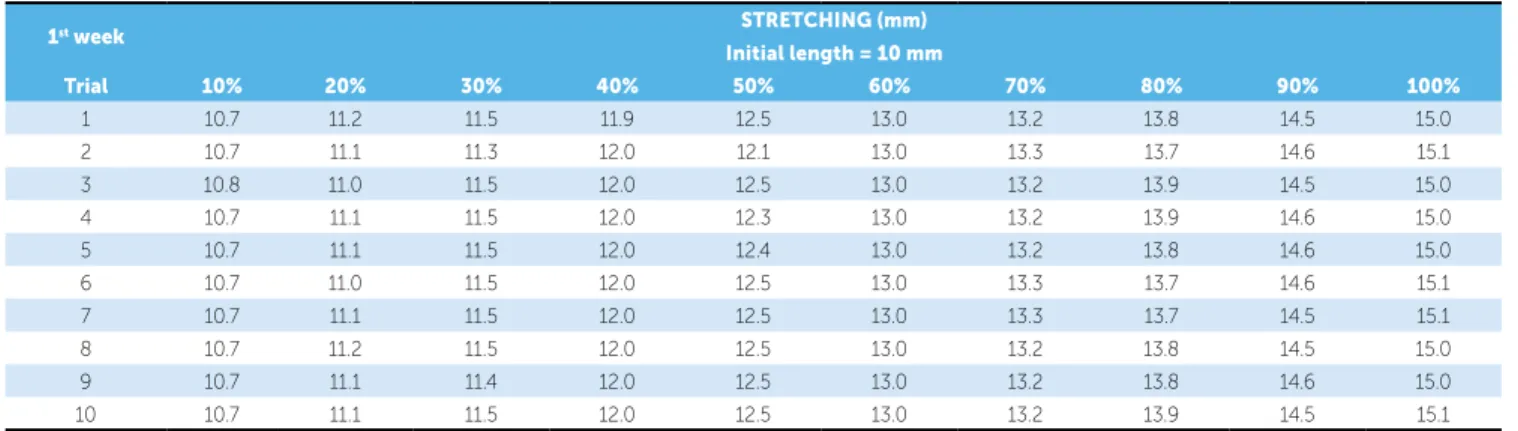
Table 1 - Results, in mm, obtained after stretching for one week.
1st week STRETCHING (mm)
Initial length = 10 mm
Trial 10% 20% 30% 40% 50% 60% 70% 80% 90% 100%
1 10.7 11.2 11.5 11.9 12.5 13.0 13.2 13.8 14.5 15.0
2 10.7 11.1 11.3 12.0 12.1 13.0 13.3 13.7 14.6 15.1
3 10.8 11.0 11.5 12.0 12.5 13.0 13.2 13.9 14.5 15.0
4 10.7 11.1 11.5 12.0 12.3 13.0 13.2 13.9 14.6 15.0
5 10.7 11.1 11.5 12.0 12.4 13.0 13.2 13.8 14.6 15.0
6 10.7 11.0 11.5 12.0 12.5 13.0 13.3 13.7 14.6 15.1
7 10.7 11.1 11.5 12.0 12.5 13.0 13.3 13.7 14.5 15.1
8 10.7 11.2 11.5 12.0 12.5 13.0 13.2 13.8 14.5 15.0
9 10.7 11.1 11.4 12.0 12.5 13.0 13.2 13.8 14.6 15.0
10 10.7 11.1 11.5 12.0 12.5 13.0 13.2 13.9 14.5 15.1
Table 2 - Results, in mm, after stretching for two weeks.
2nd week STRETCHING (mm)
Initial length = 10 mm
Trial 10% 20% 30% 40% 50% 60% 70% 80% 90% 100%
1 10.9 11.0 11.9 12.0 12.9 13.0 13.7 14.4 15.4 16.4
2 10.8 11.0 11.9 12.0 12.8 13.0 13.9 14.4 15.0 15.9
3 10.9 11.3 11.6 12.5 12.8 13.0 13.9 14.4 15.0 15.9
4 10.8 11.0 11.6 12.0 12.8 13.0 13.9 14.4 15.2 15.9
5 10.9 11.1 11.7 12.0 12.8 13.0 13.9 14.4 15.2 15.9
6 10.9 11.2 11.9 12.0 12.9 13.0 13.8 14.4 15.4 16.1
7 10.8 11.3 11.9 12.0 12.9 13.0 13.9 14.4 15.0 16.3
8 10.9 11.1 11.9 12.0 12.8 13.0 13.8 14.4 15.0 15.9
9 10.8 11.0 11.9 12.0 12.8 13.0 13.8 14.4 15.0 16.0
10 10.9 11.0 11.9 12.0 12.8 13.0 13.9 14.4 15.0 15.9
Table 3 - Results, in mm, after stretching for three weeks.
3rd week STRETCHING (mm)
Initial length = 10 mm
Trial 10% 20% 30% 40% 50% 60% 70% 80% 90% 100%
1 10.9 11.1 11.9 12.0 12.8 13.0 13.9 14.1 15.0 15.7
2 10.9 11.1 11.9 12.0 12.5 12.9 13.9 14.1 15.0 15.7
3 10.9 11.1 11.9 12.0 12.8 13.0 13.8 14.1 15.0 15.7
4 10.9 11.1 11.9 12.0 12.6 13.0 13.9 14.1 15.0 15.7
5 10.9 11.1 11.9 12.0 12.8 13.0 13.8 14.1 15.0 15.7
6 10.9 11.1 11.9 12.0 12.7 12.9 13.9 14.1 15.0 15.7
7 10.9 11.1 11.9 12.0 12.8 13.0 13.9 14.1 15.0 15.7
8 10.9 11.1 11.9 12.0 12.8 13.0 13.8 14.1 15.0 15.7
9 10.9 11.1 11.9 12.0 12.5 13.0 13.9 14.1 15.0 15.7
10 10.9 11.1 11.9 12.0 12.8 13.0 13.9 14.1 15.0 15.7
Table 4 - Results, in mm, after stretching for four weeks.
4th week STRETCHING (mm)
Initial length = 10 mm
Trial 10% 20% 30% 40% 50% 60% 70% 80% 90% 100%
1 10.9 11.5 12.0 12.1 12.9 13.3 14.0 14.5 15.1 15.8
2 10.9 11.4 12.0 12.2 12.9 13.3 14.0 14.8 15.0 16.0
3 10.9 11.4 11.9 12.2 12.9 13.0 14.0 14.7 15.5 15.9
4 10.9 11.4 11.9 12.2 12.9 13.1 14.0 14.7 15.3 15.9
5 10.9 11.4 12.0 12.2 12.9 13.2 14.0 14.8 15.0 15.9
6 10.9 11.5 12.0 12.2 12.9 13.2 14.0 14.6 15.5 16.0
7 10.9 11.4 12.0 12.9 12.9 13.0 14.0 14.5 15.1 15.9
8 10.9 11.4 12.0 12.9 12.9 13.3 14.0 14.7 15.3 15.8
9 10.9 11.4 12.0 12.9 12.9 13.3 14.0 14.8 15.0 15.9
100% 90% 80% 70% 60% 50% 40% 30% 20% 10%
Figure 3 - Dispersion of mean deformation vs. distance. The straight line shows adjustment by least squares.
Figure 4 - Mean deformation, over the weeks, for each of the distances.
Table 5 - Mean and standard deviation values, in mm, for each degree of stretching vs. week combination.
Stretching 1
st week 2nd week 3rd week 4th week
Mean± SD
Mean± SD Mean± SD Mean± SD Mean± SD
10% 10.71 ± 0.03 10.86 ± 0.05 10.90 ± 0.00 10.90 ± 0.00 10.84 ± 0.08
20% 11.10 ± 0.07 11.10 ± 0.12 11.10 ± 0.00 11.43 ± 0.05 11.18 ± 0.16
30% 11.47 ±0.07 11.82 ± 0.13 11.90 ± 0.00 11.98 ± 0.04 11.79 ± 0.21
40% 11.99 ±0.03 12.05 ± 0.16 12.00 ± 0.00 12.47 ± 0.37 12.13 ± 0.28
50% 12.43 ±0.13 12.83 ± 0.05 12.71 ± 0.13 12.90 ± 0.00 12.72 ± 0.20
60% 13.00 ± 0.00 13.00 ± 0.00 12.98 ± 0.04 13.17 ± 0.13 13.04 ± 0.10
70% 13.23 ± 0.05 13.85 ± 0.07 13.87 ± 0.05 14.00 ± 0.00 13.74 ± 0.31
80% 13.80 ± 0.08 14.40 ± 0.00 14.10 ± 0.00 14.69 ± 0.12 14.25 ± 0.34
90% 14.55 ± 0.05 15.12 ± 0.17 15.00 ± 0.00 15.20 ± 0.19 14.97 ± 0.28
100% 15.04 ± 0.05 16.02 ± 0.19 15.70 ± 0.00 15.90 ± 0.07 15.66 ± 0.40
Mean 12.732 13.105 13.026 13.264 13.03
SD 1.39 1.65 1.54 1.58 1.55
1 week 2 weeks
3 weeks 4 weeks
10% 10% 11 11 11 11 11 12 Mean def orma tion (mm) Mean def orma tion (mm) Mean def orma tion (mm) Mean def orma tion (mm) Mean def orma tion (mm) 12 12 12 12 13 13 13 13 13 14 14 14 14 14 15 15 15 15 15 16 16 16 10% 10% 30% 30% 30% 30% 50% 50% Distance Distance Week Distance Distance 50% 50% 70% 70% 70% 70% 90%
1 2 3 4
90%
90% 90%
Table 7 - Comparison between mean deformations.
Table 6 - Estimates of parameters for adjusted models.
Week Intercept Inclination
coeicient R
2
1st Week 12.732 0.0479 0.9919
(0.004)* (0.0014) *
2nd Week 13.105 0.0564 0.9805
(0.076) * (0.0027) *
3rd Week 13.026 0.0530 0.9796
(0.073) * (0.0025) *
4th Week 13.264 0.0544 0.9905
(0.051) * (0.0018) *
R2 = Adjusted determination coeicient; * standard deviation.
* = Statistically signiicant diference.
1st week 2nd week 3rd week 4th week
1st Week 0.0004* 0.0037* < 0.0001*
2nd Week 0.0004* 0.4086 0.1012
3rd Week 0.0037* 0.4086 0.0165*
In comparing the mean deformations, statistically significant differences were detected only in the first week, compared to the others. Table 7 demonstrates a comparison between mean deformations in all weeks.
In this study it was found that the percentage of force decay rises as immersion time increases. Howev-er, a reversal – though not statistically signiicant – was observed between the means of the second and third weeks (Table 5 and Fig 4).
DISCUSSION
To be efective in their function, ECs should pro-duce an appropriate magnitude of force for a certain period of time.10 However, it is known that ECs cannot
generate constant forces for a long period of time since their elastic properties are altered over time, causing permanent deformation and, consequently, loss of ten-sion. The inability of elastic materials to return to their original size ater undergoing substantial deformation and releasing the tensile forces applied to them, is de-ined as plastic, or permanent, deformation.4
The ef-fects of this plastic deformation are manifested by the decrease of these materials’ ability to deliver forces.15
In the present study, EC behavior was evaluated weekly over a period of 4 weeks — the interval be-tween patient visits,4,8,9,12,17 as this time period
co-incides with the average period when orthodontists usually replace the patient’s elastics.2 The time
fac-tor is of paramount importance for ECs, since it is known that one of their main properties, i.e., the dissipation of forces with constant magnitude dur-ing their clinical application, is directly influenced by the time period during which they are employed, given a loss of tension and consequent force decay.18
In the present study, a statistically significant differ-ence was noted between the mean deformation of the first week and the others (Table 7), which suggests - without considering the biology of tooth movement – that it is convenient to change ECs weekly, since comparisons between the second and third weeks, between the third and fourth weeks, and between the second and fourth weeks, showed no significant differences. However, it is recommended that ECs be replaced every 3 weeks.6,13 Furthermore, ECs should
not be used for longer than 4 weeks, not only due to force decay but also due to difficulties in oral clean-ing, with the resulting accumulation of food debris.13
Additionally, EC use should not exceed a period of 6 weeks as ECs eventually lose, on average, 30% of their initial force. Besides, there is an increase in the accumulation of plaque and chemical interaction with food and oral fluids.11
Regarding immersion time in artificial saliva, the rate of force decay increases with time,1,9,24 as
con-cluded in this study. Although not significant statisti-cally, a reversal was also observed between the means of the second and third weeks (Table 5 and Fig 5).
As regards the degree of elongation undergone by ECs, force decay is proportional to the de-gree of stretching to which the ECs are subject-ed,1 in agreement with the findings of this study
(Table 5 and Fig 4). For example, it became evident that, as shown in Table 1, 10% stretching yielded a mean deformation of approximately 8.4%, whereas 100% stretching caused the deformation to increase to 56.6%. Thus, from a clinical standpoint, an is-sue could be raised: How much stretching is rec-ommended to (a) achieve a low rate of permanent deformation, and (b) apply forces that are as con-stant as possible? Based on the results of this study, it would be reasonable to suggest 30% stretching, which would provide a mean deformation of about 17.9%. However, it should be emphasized that this argument is only applicable to 3M Unitek ECs which were analyzed here, since ECs can vary in thickness, elastic property, manufacturing process, adding pigments or fluorine and distance between modules. These factors, acting alone or in conjunc-tion, will certainly influence both the forces deliv-ered and the degree of permanent deformation un-dergone by these materials. Therefore, professionals who use ECs should be aware of the various issues and types of materials addressed in this study, and act accordingly.
The use of a tension gauge is advised to measure the initial force since certain closed chains — when stretched to 100% of their original length — can produce excessive forces, approaching 450 grams. It is therefore recommended to stretch these ECs be-tween 50% and 75% of their original length. How-ever, there are ECs which, when stretched to 100% of their original length, produce acceptable magni-tudes of force (approximately 300 grams).3 Based on
ECs with at least three different distances between modules, provided they have the same thickness and are manufactured by the same company. This would allow the application of the desired force magnitude, taking into consideration the degree of stretching recommended by this study (30%).
Furthermore, a permanent deformation of 50% to 60% was observed when the ECs were stretched to 100% of their original length. These percentages re-semble those found for American Orthodontics (54%) ECs.15 However, the percentages found for 3M Unitek
(76%) ECs15 difer from those found in this study.
While a simulation was made of the oral environ-ment, it should be stressed that in an in vivo study, a wide range of factors such as the patient’s diet, the composition of their saliva, presence of bacterial en-zymes, masticatory forces, tooth movement, distance
of force application, presence of fluoride and tem-perature changes could affect the mechanical perfor-mance of ECs, thereby altering the results obtained in this study.
CONCLUSION
Based on the results it can be conclude that: 1) A direct relationship was found between degree of stretching and permanent deformation of the ECs evaluated.
2) The mean stretching percentages found were 8.4% to 10%, exceeding 20% (21.3%) when stretched by 40%, and reaching 56.6% permanent deformation when stretched to 100% of their original length.
3) The highest percentage of permanent deforma-tion occurred during the first week, and was not sta-tistically significant after this period.
1. Andreasen GF, Bishara SE. Comparison of alastik chains with elastics involved intra-arch molar to molar forces. Angle Orthod. 1970;40(3):151-8. 2. Araújo FBC, Ursi WJS. Estudo da degradação da força gerada por
elásticos ortodônticos sintéticos. Rev Dental Press Ortod Ortop Facial. 2006;11(6):52-61.
3. Baty DL, Storie DJ, Fraunhofer JA. Synthetic elastomeric chains: a literature review. Am J Orthod Dentofacial Orthop. 1994;105(6):536-42.
4. Bishara SE, Andreasen GF. Comparison of time related forces between plastic alastiks and latex elastics. Angle Orthod. 1970;40(4):319-28. 5. Cardoso MA, Mendes AM. Avaliação das forças liberadas por elásticos
ortodônticos em cadeia esterilizados com soluções de glutaraldeído. Rev Ortod Gaúch. 2001;5(2):100-11.
6. Eliades T, Eliades G, Watts DC. Structural conformation of in vitro and in vivo aged orthodontic elastomeric modules. Eur J Orthod. 1999;21(6):649-58.
7. Ferreira JJ, Caetano MTO. A degradação de força de segmentos de elásticos em cadeia de diferentes tamanhos: estudo comparativo in vitro. J Bras Orthodon Ortop Facial. 2004;9(51):225-33.
8. Ferriter JP, Meyer CE, Lorton L. The efect of hydrogen ion concentration on the force-degradation rate of orthodontic polyurethane chains elastics. Am J Orthod Dentofacial Orthop. 1990;98(5):404-10.
9. Fraunhofer JA, Cofelt MTP, Orbell GM. The efects of artiicial saliva and topical luoride treatments on the degradation of the elastic properties of orthodontic chains. Angle Orthod. 1992;62(4):265-74.
REFERENCES
10. De Genova DC, McInnes-Ledoux P, Weinberg R, Shaye R. Force degradation of orthodontic elastomeric chains — A product comparison study. Am J Orthod. 1985;87(5):377-84.
11. Howard RS, Nikolai RJ. On the relaxation of orthodontic elastic threads. Angle Orthod. 1979;49(3):167-72.
12. Kuster R, Ingervall B, Bürgin W. Laboratory and intra-oral tests of the degradation of elastic chains. Eur J Orthod. 1986;8(3):202-8.
13. Lu TC, Wang WN, Tarng TH, Chen JW. Force decay of elastomeric chain — A serial study Part ll. Am J Orthod Dentofacial Orthop. 1993;104(4):373-7. 14. Matta ENR, Chevitarese O. Avaliação laboratorial da força liberada por
elásticos plásticos. Rev Soc Bras Ortod. 1997;3(4):131-6.
15. Matta ENR, Chevitarese O. Deformação plástica de elásticos ortodônticos em cadeia: estudo in vitro. Rev Soc Bras Ortod. 1998;3(5):188-92. 16. Martins MM, Mendes IM, Côrte Real MLNP; Goldner MTA. Elásticos
ortodônticos em cadeia: revisão da literatura e aplicações clínicas. Rev Clín Ortod Dental Press. 2006;5(5):71-8.
17. Mundstock KS, Beltrame KP, Mundstock CA. Avaliação da força dos alastiques em cadeia num período de 0 a 28 dias. Rev Assoc Paul Espec Ortod Ortop Facial. 2003;1(3):29-33.