Abstract— In this paper we have presented the four new investigations using different structures of Photonic Crystal Fiber (PCF) for broadband communication applications and narrows down on the design which can provide largest flat negative dispersion. The new structure model is optimized based on the combination of modal properties and dispersion compensation. The results were recorded over a transmission frequency range from 190.95 THz to 245.73 THz i.e. 1.22 µm to 1.57 µm with a dispersion -704.62 ps/nm/km. The results obtained from the new different PCF structures are compared with reported results for different 2D PCF models so far.
Index Terms—Dispersion Compensation,Photonic Crystal Fiber, Refractive Index, Confinement loss.
I. INTRODUCTION
Dispersion is a key factor for limiting the development in rapid transmission rate in communication
field using optic fiber. For high speed and large bandwidth application in optic fiber communication,
dispersion characteristic should be uniform or have minimum slope (flattened) throughout the
wavelength [1]. In the literature, design of different 2D PCF structures by compensating dispersion by
changing geometric parameters of the structure and Refractive Index (RI) have been reported.
However, conventional hexagonal PCF does not have air hole at the center of the core. In hexagonal
PCF structures may have single air hole or array of air holes at the core.
Feroza Begum et. al. [2] studied conventional hexagonal PCF structure for negative dispersion
where D = -100 ps/nm/km at 1550 nm wavelength with high losses. Makoui et. al. [3] used generic
algorithm to minimize pulse broadening over large wavelength. Varshney et.al. [4] used
microstructure of PCF for residual dispersion compensation to achieve flattened negative dispersion.
They reported ultra-flattened negative dispersion of -98.3 ps/nm/km and ∆D= 1.1 ps/nm/km over S to
L wavelength band i.e. wavelength bandwidth of 1.48 µm to 1.63 µm. Similarly, Franco et. al. [5]
used microstructure of PCF and investigated ultra-flattened negative dispersion of -179 ps/nm/km and
∆D= 2.1 ps/nm/km over S to U wavelength band i.e. wavelength bandwidth of 1.48 to 1.675 µm. The
design by Silva et.al. [6] demonstrates higher average dispersion -212 ps/nm/km and ∆D= 11.9
ps/nm/km over E to U wavelength band i.e. wavelength bandwidth of 1.35 µm to 1.7 µm and the
Design and Modal Analysis of Photonic
Crystal Fiber for Dispersion Compensation
over Broadband Range
Madhavi Waghmare 1, K.T.V.Reddy 2, 1.
Research Scholar, Department of Electronics and Telecommunication Engineering, Sardar Patel Institute of Technology, University of Mumbai, Mumbai, India. 2 Pranveer Singh Institute of Technology, Kanpur, India
design has been studied with Ge doped core by using genetic algorithm. Asiful Islam et. al. [7] used
equiangular spiral PCF structure and achieved absolute dispersion variation of -227ps/nm-km with
∆D ~ 11 ps/nm-km over frequency range 178.98 THz to 202.56 THz. Tee et. al. [8] used PCF in PCF structure and achieved residual dispersion compensation -457.4 ps/nm/km over the range larger than
E to U band i.e. (177.3 THz to 220 THz) and ∆D ~11.9 ps/nm/km. All these studies were carried out
on a 2D PCF with uniform air hole structures for high speed and broadband transmission. However,
there is still a possibility to achieve more negative dispersion and/or near zero confinement loss over
broadband optical frequency range. Higher flattened negative dispersion indicates good dispersion
compensation and almost zero confinement loss resulting in enhancement of fiber bandwidth.
In this paper we explained the investigations of different new PCF structures which can provide
very large negative dispersion. Four new PCF structures are designed to compensate dispersion of
propagation of light with nearly zero confinement loss. In these structures, inner circular air hole array
with different geometry is used to reduce dispersion. In this paper we implemented and studied the
effect of the defect introduction in the newly designed PCF structures within transmission spectrum
range from 190.95 THz to 245.73 THz i.e. 1.22 µm to 1.57µm with -704.62 (ps/nm/km) average large
negative dispersion.
II. MODELLING OF A PHOTONIC CRYSTAL FIBER STRUCTURE
PCF can have air hole structure of any shape. Commonly two different forms of lattice are used.
One with square lattice and other with triangular lattice. PCF has gathered more attention because of
their special characteristics in triangular lattice of air holes [9]. Research reports have studied
conventional hexagonal PCF and circular PCF structures so far. After studying their investigations on
these structures, we have tried to model four different new PCF structures where two PCF structures
are combined as a new model in the investigation. We have considered hexagonal and circular
structures with triangular lattice for investigation purpose. With the help of combination of hexagonal
and circular structures for inner and outer region, there are four possibilities of symmetric structures
that demonstrate optimal dispersion and confinement loss. Because of two different structures i.e.
inner (core region) and outer (Cladding region), there is a possibility to adjust effective refractive
index of the structures by adjusting geometric parameters of inner and outer regions. The large
effective refractive index difference between core and cladding region strongly affects the chromatic
dispersion. The symmetry of structures prevents the existence of a linear electro-optic effect.
Fig. 1 shows the cross section of the four different structures along with their geometric parameters
for better understanding. For outer structure N denotes the number of air-hole rings and r is the radius
air-hole. If outer structure is hexagon, then a represents pitch and if outer structure is circular, then d
represents the radial distance of the circular structure. For inner structure N1 represents number of
air-hole rings and r1 is the radius of air-air-hole. If inner structure is hexagon, then a1 represents pitch and if
inner structure is considered in such a way that it will fall in the range of fabrication dimension for
practical use [10]. The inner structure is core region which helps to produce better negative
dispersion. The number of air-hole rings in core region is selected such that it gives large negative
dispersion, at the same time the number of air-hole rings at the outer structure is chosen to give low
confinement loss [5]. In all the four proposed structures, there are five air-hole rings at the outer
structure to reduce the confinement loss.
Optimized geometric parameters of these structures are given in table I. These geometric
parameters are optimized after rigorous simulation on different combination of parameters of outer
and inner structures.
TABLE I.OPTIMIZED GEOMETRIC PARAMETERS OF 4 STRUCTURES
Structure Outer region Inner region
Circular in Hexagonal (C-H)
Hexagon: No. of air-hole rings N = 5
a = 1.8 µm, r = 0.7 µm
Circle: No. of air-hole rings N1
= 5
d1 = 0.21 µm, r1 = 0.1 µm Hexagonal in Hexagonal
(H-H)
Hexagon: No. of air-hole rings N = 5
a = 1.8 µm, r = 0.7 µm
Hexagon: No. of air-hole rings
N1 = 5
a1 = 0.132 µm, r1 = 0.061 µm Hexagonal in Circular
(H-C)
Circle: No. of air-hole rings N= 5
d = 1.32 µm, r = 0.56 µm
Hexagon: No. of air-hole rings
N1 = 5
a1 = 0.132 µm, r1 = 0.061 µm Circular in Circular
(C-C)
Circle: No. of air-hole rings N = 5
d = 1.32 µm, r = 0.56 µm
Circle: No. of air-hole rings
N1=5
d1 = 0.21 µm, r1 = 0.1 µm Circle in Circle (C-C) Circle in Hexagon (C-H) Hexagon in Circle (H-C) Hexagon in Hexagon (H-H)
The wavelength dependent refractive index of the silica was included in the simulation from Sell
Meier equation. Chromatic dispersion is the phenomenon in which the phase velocity of light wave
depends on its frequency. Dispersion D in ps/nm/km of a PCF is evaluated by calculating � value
vs. the wavelength using the eq. 1
= −� � [� ]�
where c is the velocity of light in vacuum, � is wavelength and � [� ] is the real part of the
refractive index. Chromatic dispersion D is also dependent on the geometric parameters like shape of
air holes, pitch, and inner circular holes diameter. By optimizing these parameters, suitable guiding
properties can be obtained.
Confinement loss � is the light confinement ability within the core region and is evaluated
using eq. 2. The increase of number of air hole rings support the confinement of light in the core
region, which results in minimum losses than those with less air hole rings. Also, increasing the air
holes radius results in the increasing of the air filling fraction and accordingly decreasing the loss.
� =
6
� [� ]
where = �/� is wave number in free space with the unit dB/m, � [� ] is the imaginary part of
the refractive index. From eq. 1 and 2, it is observed that the dispersion is dependent on real value of
refractive index and confinement loss is dependent on imaginary part of refractive index with
wavelength. Eq. 3 below shows the relation between refractive index and group velocity.
� = ∂�
∂ω − = c
∂
∂ω(ω� ) −
= �
� +� � =
�
� �
where � is the refractive index and � is the group index. The wave number k can be considered as
the change in spectral phase per unit length [10].
The Effective modal area Aeff was calculated using equation 4
� = ∬| |
∬ | |4
The effective core radius is 0.4×a. In particular, the effective nonlinearity of the fiber can be
calculated in the core of the fiber. The effective nonlinear coefficient is calculated by equation 5.
� =� � � �
where � is material nonlinear coefficient. In this paper � used as silica fiber value is 2.6×10 -20 m2
W-1 which determined by fiber designs.
A Finite Difference Time Domain (FDTD) Lumerical solution simulation tool was used to evaluate
the performance of these structures. The simulation region was trimmed by applying a perfectly
III. RESULTS AND ANALYSIS
It has been an attempt by every research scholar in the field of fiber optics communication, to
produce an optimized PCF structure which enables better negative dispersion and near zero
confinement loss. In the proposed four different structures, changes in various combinations of PCF
parameters were carried out during simulation till the optimized structure is found. The objective was
to achieve better results than the results produced by other research scholars so far.
From fabrication perspective ± 2% manufacturing tolerance is generally considered [11]. Thus each
of the structure’s geometric parameters were varied up to ± 2% and simulation was carried out. Finally, all structures (without considering any manufacturing inaccuracies) were compared with each
other for better dispersion and nearly zero confinement loss.
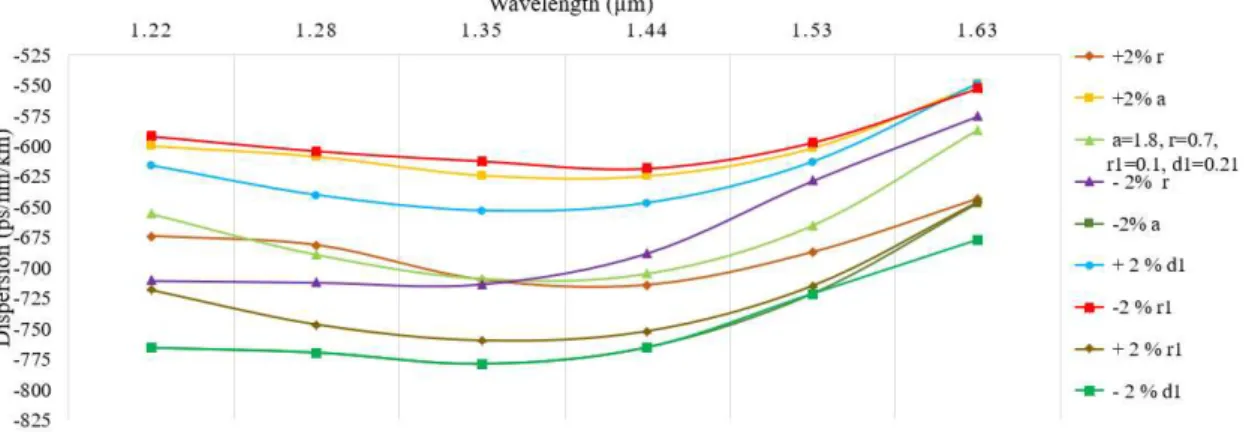
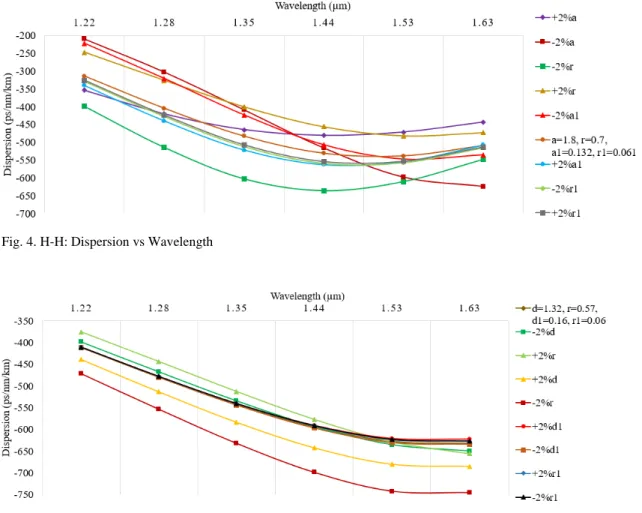
Fig. 2, 3, 4 and 5 shows the changes in the dispersion values against the selected wavelength range
for variation in geometric parameters by ± 2% for all PCF structure models Circle in Circle (C-C),
Hexagon in Hexagon (H-H), Circle in Hexagon (C-H) and Hexagon in Circle (H-C) presented.
However, one should note that after fabrication, geometric parameters of the cross section does not
vary in only one direction i.e. either +2% or -2%. They are normally mixed and therefore the final
effect is more or less balanced. Therefore, more weightage should be given to the results carried out
for the nominal dimensions of the geometric parameters. Fig. 2, 3, 4 and 5 shows dispersion values for
optimized parameters and changing one of the parameters while keeping other parameters constant.
Structure C-H shows higher negative dispersion range values as compared to other structures
considering ± 2% variation in the geometrical parameters.
In fig. 2, C-H structure shows the effect of the ± 2% variation in the parameter of r1 and d1 of inner
region and r and a of outer region on dispersion. For this study, changes were done to only one of the
parameters keeping remaining parameters at optimum (nominal) value. For example, variation of ±
2% in optimum value of pitch which is 1.8 µm considered while keeping other nominal dimensions
constant to r = 0.7 µm, d1 = 0.21 µm and r1= 0.1 µm. Similar study was carried out for other three
structures also. A ± 2% variation in r results in ± 3% change in average dispersion, while ∆D
increases more than 100%, whereas ± 2% variation in a results the average dispersion by ~ ± 2% with
around 50% increases in ∆D. Keeping outer parameter at optimum value and varying inner parameter by ± 2% in r1 results in ± 4% changes in average dispersion with ~60% increase in ∆D. And ± 2%
variation in d1 results in ± 3% changes in average dispersion with ~80% increase in ∆D.
The variation in these four parameters (one at a time) do not change the shape of the dispersion
curve significantly. There is small variation in guided mode profile corresponding to the changes in
one of the parameters at any given instance. Similar observation was registered for other three
In fig. 3, H-C structure demonstrates sensitivity of dispersion for ± 2% variation in the parameter of
r1, a1 of inner region and r, d of outer region. From the curve it is seen that ± 2% variation in r1
results in ~ ± 3% changes in average dispersion with 60% increase in ∆D. Similarly, ± 2% variation in
a1 results in ~ ± 3% changes in average dispersion with 60% increase in ∆D and ± 2% variation in outer region r, d parameters affects ± 4% and ± 3% variation in average dispersion respectively with
80% and 60% increase in ∆D respectively
In fig. 4, H-H structure shows the changes in average dispersion on changing inner (r1, a1) and
outer parameter (r, a). ± 2% variation in r1, a1 results in ± 2% and ± 4% changes in average
dispersion respectively whereas ∆D increases more than 70% and higher than100 % respectively. ±
2% variation in r, a results in ± 5% and ± 8% changes in average dispersion respectively whereas ∆D
increases more than 60% and more than 85 % respectively.
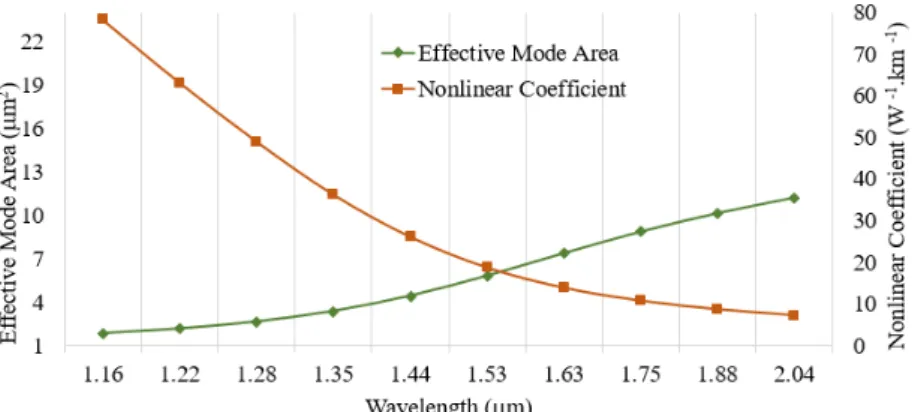
In fig. 5, C-C structure shows the changes in average dispersion on changing inner (r1, d1) and
outer parameter (r, d). ± 2% variation in r1, d1 results in ± 3% and ± 2% changes in average
dispersion respectively while ∆D increases more than 70% and more than 60 % respectively. ± 2%
Fig. 2. C-H: Dispersion vs Wavelength
variation in r, d results ± 5% and ± 8% changes in average dispersion respectively whereas ∆D
increases more than 60% and more than 85 % respectively.
In general, while the pitch a or d of a PCF decreases, the negative dispersion increases whereas
increase in r results in increase in negative dispersion which suggests reduction in effective refractive
index.
Effective mode area represents quantitative measurement of the area covered by the fiber’s guided
mode. Fig. 6, 7, 8 and 9 demonstrate that effective mode area increase with an increase in operating
wavelength and corresponding nonlinear coefficient γ decreases with an increase in operating
wavelength. The calculated nonlinear coefficient of all four proposed structures C-H, H-H, H-C, C-C
are 11, 17.6, 18.67, 25.08 W-1 Km-1 at 1.55 µm respectively with material related nonlinear coefficient
is 2.6 × 10 -20 m2 W-1. Four-wave mixing is considered to be harmful for multi channels fiber optic
communication system such as WDM, therefore lower nonlinear coefficient from transmission
medium is required to reduce four-wave mixing nonlinear effect. Of all the four structures, structure
C-H exhibit smaller nonlinear coefficient and high effective mode area as compared to remaining
three structures.
Fig. 4. H-H: Dispersion vs Wavelength
Fig. 8. C-C: Effective Mode Area & Nonlinear Coefficient Fig. 6. H-H: Effective Mode Area & Nonlinear Coefficient
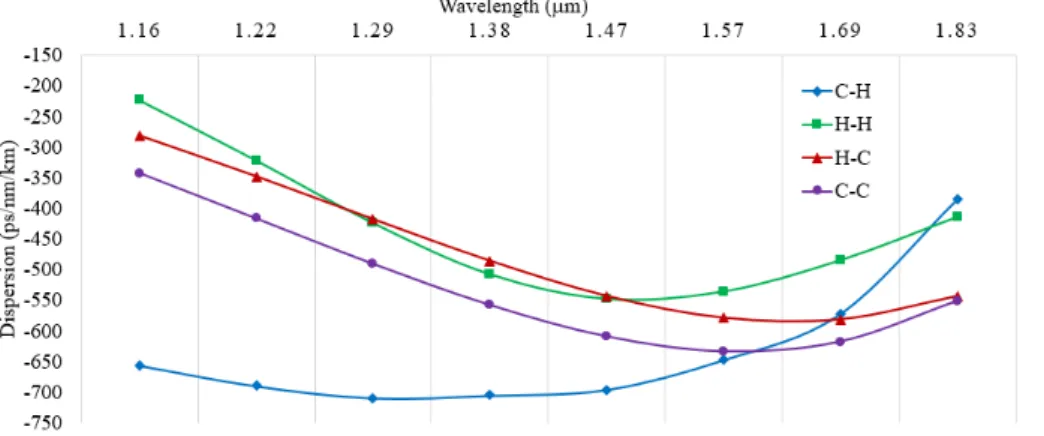
Fig. 10 shows the comparison of dispersion values for four different structures for the optimized
geometric parameters (as shown in table I), against operating wavelength range of 1.16 to 1.83 µm. It
is clearly evident from the figure that structure C-H produces larger and flattened negative dispersion
as compared to other three structures. The dispersion value of the optimized C-H structure is coming
around -704.63 ps/nm/km with ∆D ~ 12.5 ps/nm/km (range from -689.1 to -708.8 ps/nm/km) in the
wavelength range from 1.22 to 1.57 µm. C-H structure shows better flattened negative dispersion for
the wavelength range 1.22 to 1.57 µm as compared to other three structures. Beyond 1.57 µm till
1.675 µm, the dispersion value rises to -560 ps/nm/km. However, still this result is better as compared
to previous best results. Although the total flattened dispersion is not in the entire communication
bands still this high negative dispersion is sufficient to compensate PCF and useful in future
application of WDM optical communication system.
To compensate residual dispersion, both large negative dispersion and small dispersion slope value
are required. From these different proposed structures, C-H structure has dispersion slope range from
-0.26 to 0.53 ps/nm2/km over the 1.22 µm to 1.57 µm wavelength at optimum parameters. At 1.29 µm
to 1.38 µm the slope is 0.05 ps/nm2/km.
Fig. 9. C-H: Effective Mode Area & Nonlinear Coefficient
Brazilian Microwave and Optoelectronics Society-SBMO received 14 June 2016; for review 16 June 2016; accepted 22 Sept 2016 Brazilian Society of Electromagnetism-SBMag © 2016 SBMO/SBMag ISSN 2179-1074
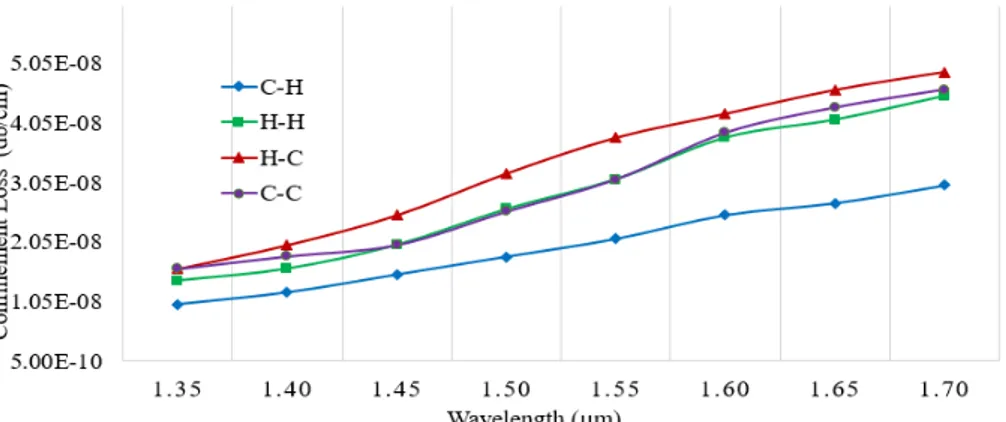
Fig. 11 shows that there is very low or near zero confinement loss in any of the four proposed
different structures. Confinement loss depends on imaginary part of refractive index as given in
equation 2. Light confinement is better around core region as r/a ratio increases. As the radius of air
hole at cladding region increases it prevent light dissipation into cladding region and hence increases
light confinement. All four structures are able to guide light with near zero confinement loss. The
confinement loss for C-H structure is 2×10⁻⁸ dB/cm at wavelength 1.55 µm when N=5. Since the
confinement loss is depending on cladding region, this loss can further be reduced by increasing
number of air hole rings and the radius of air holes [12].
Fig. 12 compares the effective mode area against r1/a1 ratio in case of inner hexagon structure and
r1/d1 in case of inner circular structure at wavelength 1.55 µm. Structure C-H shows larger increase
in effective mode area corresponding to increase in r1/a1 or r1/d1 ratio as compared to other three
structures.
Fig.13 shows the effect of change in r/a ratio on effective mode area for any given value of r1/d1
for C-H structure. It clearly shows that effective mode area increases with reduction in r/a ratio for
Fig. 11. Confinement Loss comparison for all 4 structures
any given ratio of r1/d1. Also there is increase in effective mode area for any given value of r/a ratio
as the ratio r1/d1 increases. This is due to the fact that the average effective refractive index at core
region reduces with respect to increase in r1. Hence light confinement in core region is weaker which
means it is forced out to the cladding region by inner array of circular holes. This also means that light
confinement is better around the core region as the ratio r/a increases.
Fig. 14 compares real and imaginary part of effective refractive index against wavelength for all
four different structures. Real part of refractive index is shown by solid lines whereas imaginary part
of refractive index is shown by dashed lines. Structure C-H shows higher effective refractive index
than the other remaining structures. Linear form of the real part of the refractive index shows that the
light is confined and non-dispersive in nature. Imaginary part of refractive index is nearly zero which
leads to near zero confinement loss based on equation 2.
The absolute birefringence of all these structures are ~10-8 at 1.55 µm wavelength. This is
negligible value due to symmetric structures, hence the effective index of the x-polarized and
y-polarized guided mode is degenerated [13].
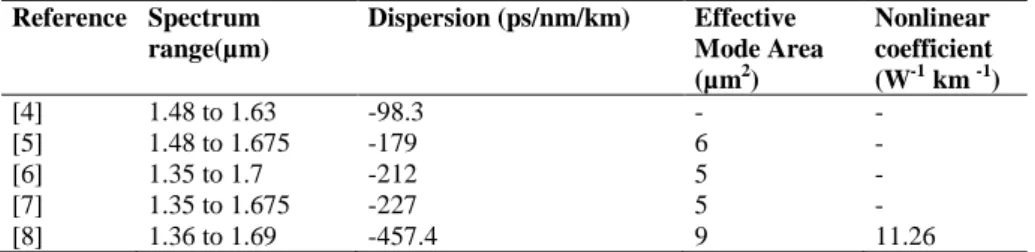
Table II shows comparison of dispersion, effective mode area and nonlinear coefficient obtained
earlier by different research scholars.
TABLE II SUMMARY OF THE PREVIOUS RESULTS
Reference Spectrum range(µm)
Dispersion (ps/nm/km) Effective Mode Area (µm2)
Nonlinear coefficient (W-1 km -1)
[4] 1.48 to 1.63 -98.3 - -
[5] 1.48 to 1.675 -179 6 -
[6] 1.35 to 1.7 -212 5 -
[7] 1.35 to 1.675 -227 5 -
[8] 1.36 to 1.69 -457.4 9 11.26
Table III below shows the range of the dispersion, nonlinear coefficient and Effective mode area
obtained in this research for each geometric structure for fixed wavelength range 1.22 µm to 1.57 µm.
Dispersion range values shown are based on consideration of ± 2% variation in the geometrical
parameters. Effective mode area and nonlinear coefficient values are calculated for nominal
dimensions (without consideration of ± 2% variation) of geometric parameters. Structure C-H is able
to handle wavelength band O+E+S+C and beyond up to certain extent on O band side.
Table III list of the different structures and their parameters
Structure Dispersion (ps/nm/km) (for 1.157 µm to 1.833 µm)
Effective Mode Area µm2(at 1.55 µm)
NonLinear Coefficient W-1km-1 (at 1.55 µm)
Flattened dispersion band
C-H -655.641 to -700.626 9.10 11.02 O+E+S+C
(1.26 µm to 1.565 µm)
H-H -222.050 to -547.430 6.77 17.60 E+S+C
(1.36 µm to 1.675 µm)
H-C -280.760 to -542.689 7.08 18.67 C+L+U
(1.53 µm to 1.675 µm)
C-C -341.530 to -633.126 5.10 25.08 C+L+U
(1.53 µm to 1.675 µm)
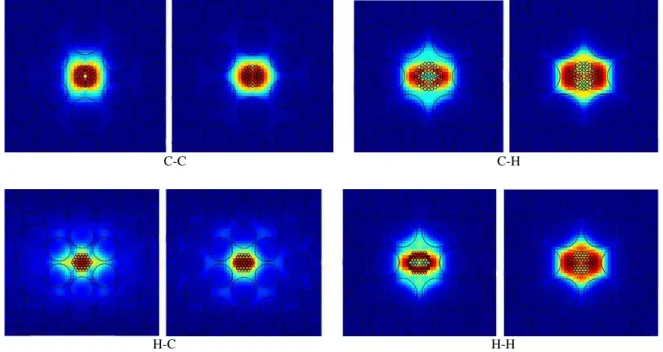
Fig.15 shows the time – averaged poynting vector profile for two degenerate modes at 1.55 µm in
propagation direction. Modes profiles of C-C and H-C structures show that the light propagate
towards inner structure, whereas H-H structure shows the less light intensity. It can be observed that
the modes profile of C-H structure is more confined around outer region of PCF core. This is due to
relatively high refractive index at outer region (cladding) as compared to lower refractive index of
core region.
C-C C-H
H-C H-H
Below given is the comparative study between 2 different structures keeping outer structure shape
same against different inner structure. For example, if outer structure is hexagonal then inner structure
circular and hexagonal is considered for comparative study. Similarly, comparative study is carried
out for 2 different structures keeping inner structure same against different outer structure. This leads
to 4 comparative studies which is explained below.
1. Comparison between structures where outer structure is hexagon: C-H structure is more
suitable for reducing residual dispersion than H-H structure. This is because, inner structure is
more responsible to reducing residual dispersion. However, C-H structure provides more
negative average dispersion than H-H structure, as shown in fig. 10.
2. Comparison between structures where outer structure is circular: C-C structure gives more
linear light propagation than H-C structure. Inner circular shape gives more effective area
which helps to compensate dispersion as compared to inner hexagonal shape. The confinement
loss is also less in C-C as compare to H-C, as shown in fig. 11.
Above two comparative studies suggest that circular shape at the core region is more preferable
over hexagonal shape.
3. Comparison between structures where inner structure is circular: C-H structure gives more
light confinement than C-C structure, the cladding region is responsible to prohibit light to enter
into outer region. The effective mode area is more in C- H as compared to C-C structure, as
shown in fig. 12.
4. Comparison between structures where inner structure is hexagonal: H-H structure is more
preferable over H-C structure because of lower confinement loss and better negative dispersion
in H-H structure as compared to H-C structure, as shown in fig. 10.
Above two comparative studies suggest that outer hexagonal structure is more preferable over
circular shape.
Based on above four comparative studies we can conclude that C-H structure is more preferable
over other three structures.
Overall the proposed optimum C-H structure show the best result i.e. higher negative dispersion
with effective mode area and nonlinear coefficient as well. In addition, this value is nine time higher
than the conventional PCF.
The high negative dispersion can be related to the variation of the fundamental guided mode to the
Gaussian profile of conventional PCF mode. As a result, proposed optimum structure is more
attractive for dispersion compensation at low cost and shorter fiber length as compare to conventional
PCF.
While using standard stack and draw fabrication technique [13] for producing air holes in the core
region precision control is essential. Fabrication of the proposed structures is possible as these four
structures consider 120 nm and 133 nm as the diameter of air holes which are larger than the recent
extrusion technique, it is even possible to fabricate air hole size of the order of 20 nm [15].
IV. CONCLUSION
Four different PCF structures with different cross sections such as Circle in Circle, Hexagon in
Hexagon, Circle in Hexagon and Hexagon in Circle were investigated for the application of
broadband. All structures can be used for different wavelength bands. Structure with cross section of
Circle in Hexagon exhibits excellent results as compared to other three structures which can be used
for larger wavelength band. C-H structure can be used as a PCF based dispersion compensating fiber
over the range of 1.22 µm to 1.57 µm i.e. 190.95 THz to 245.731 THz. It covers O band to C band.
By varying geometrical parameters of the C-H structure, broadband PCF with large negative
dispersion over 350 nm range and very low confinement loss can be obtained. Besides comparing
with previous complicated structures, the design procedure of C-H structure is much easier as very
few parameters need to be optimized. We believe that the proposed C-H structure can be used for
future high speed transmission.
ACKNOWLEDGMENT
The authors wish to thank the anonymous reviewers for their useful comments and constructive
suggestions. The authors would like to thank Sardar Patel Institute of Technology Research Centre,
Mumbai, India for their guidance in numerical analysis and providing facilities.
REFERENCES
[1] G.P.Agrawal, Fiber optic communication systems,2nd ed. Wiley.
[2] Feroza Begum, Yoshinori Namihira ,S.M. Abdur Razzak, Shubi Kaijage, Nguyen HoangHai, Tatsuya Kinjo, Kazuya Miyagi, Nianyu Zou, “Novel broadband dispersion compensating photonic crystal fiber: Application in high-speed transmission systems,” Optics and Laser Technology, vol. 41p.p. 679-686,2009.
[3] S. Makoui,M. Savadi-Oskouei,A. Rostami and Z. D. K. Kanani, "Dispersion Flattened Optical Fiber Design for Large Bandwidth and High-speed Optical Communications using Optimization Technique" PIER B, Vol. 13, 21–40, 2009 [4] S. K. Varshney, N. J. Florous, K. Saitoh, M. Koshiba, and T. Fujisawa, “Numerical investigation and optimization of a
photonic crystal fiber for simultaneous dispersion compensation over S+C+L wavelength bands,” Opt. Commun., vol. 274, pp. 74–79, 2007
[5] M. A. R. Franco, V. A. Serra ˜o, and F. Sircilli, "Microstructured optical fiber for residual dispersion compensation over S+C+L+U wavelength bands", IEEE Photon. Technol. Lett., vol. 20, no. 9, pp. 751–753, May 2008
[6] José Patrocínio da Silva, Diego S. Bezerra, Vitaly F. Rodriguez-Esquerre, Iguatemi Eduardo da Fonseca, and Hugo E. Hernández-Figueroa, Senior Member, IEEE “Ge-Doped Defect-Core Microstructure d Fiber Design by Genetic Algorithm for Residual Dispersion Compensation” IEEE Photon. Technol. Lett., vol. 22, no. 18, Sept 15, 2010 1337 [7] Md. Asiful Islam and M. Shah Alam, Senior Member, IEEE , “Design of a Polarization-Maintaining Equiangular Spiral
Photonic Crystal Fiber for Residual Dispersion Compensation Over E+S+C+L+U Wavelength Bands” IEEE Photon. Technol. Lett., VOL. 24, NO. 11, JUNE 1, 2012
[8] D. C. Tee, M. H. Abu Bakar, N. Tamchek, and F. R. Mahamd Adikan “Photonic Crystal Fiber in Photonic Crystal Fiber for Residual Dispersion Compensation Over E + S+ C+ L+ U Wavelength Bands” IEEE Photon. Technol. Lett., VOL. 5, NO.3, JUNE 1, 2013.
[9] M.H.Waghmare, Dr. K.T.V.Reddy “Analysis of Photonic Bandgap Structure in 2-D hexagonal and square lattice structure of Photonic Crystal” IEEE Explore Digital Library Proc. ICACACT-2014
[10]R.P. Photonics buyer’s guide https://www.rp-photonics.com/buyersguide.html
[11]F. Poletti, V. Finazzi, T. M. Monro, N. Broderick, V. Tse, and D. J. Richardson, “Inverse design and fabrication tolerances of ultra-flattened dispersion holey fibers”, Opt. Exp., vol. 13, no. 10, pp. 3728–3736, May 2005.
K. Saitoh, M. Koshiba, T. Hasegawa, and E. Sasaoka, B “Chromatic dispersion control in photonic crystal fibers: Application to ultra-flattened dispersion” ,Opt. Exp., vol. 11, no. 8, pp. 843–852, Apr. 2003.
[12]Y. Ruan, S. Afshar, and T. M. Monro, “Light enhancement within nanoholes in high index contrast nanowires”, IEEE Photon. J., vol. 3, no. 1, pp. 130–139, Feb. 2011
[14]G.S. Wiederhecker, C.M. B. Cordeiro, F.Couny,F.Benabid, S. A. Maier, J. C.Knight, C.H.B. Cruz, andH.L. Fragnito, B “Field enhancement within an optical fibre with a subwavelength air core”,Nat.Photon.,vol.1,no.2,pp.115–118,2007. [15]Y. Ruan, H. Ebendorff-Heidepriem, V. Afshar, and T. M. Monro, “Light confinement within nanoholes in