www.clim-past.net/9/1613/2013/ doi:10.5194/cp-9-1613-2013
© Author(s) 2013. CC Attribution 3.0 License.
Climate
of the Past
Geoscientiic
Geoscientiic
Geoscientiic
Geoscientiic
A comparative study of large-scale atmospheric circulation in the
context of a future scenario (RCP4.5) and past warmth
(mid-Pliocene)
Y. Sun1,2,3, G. Ramstein3, C. Contoux3,4, and T. Zhou1,5
1LASG, Institute of Atmospheric Physics, Chinese Academy of Sciences, Beijing, China 2University of Chinese Academy of Sciences, Beijing, China
3Laboratoire des Sciences du Climat et de l’Environnement/IPSL, UMR8212, CEA-CNRS-UVSQ, Gif-sur-Yvette, France 4Universit´e Pierre et Marie Curie & CNRS, Sisyphe, Paris, France
5Climate Change Research Center, Chinese Academy of Sciences, Beijing, China
Correspondence to:G. Ramstein ([email protected]) and Y. Sun ([email protected]) Received: 21 February 2013 – Published in Clim. Past Discuss.: 20 March 2013
Revised: 13 June 2013 – Accepted: 17 June 2013 – Published: 25 July 2013
Abstract. The mid-Pliocene warm period (∼3.3–3.0 Ma)
is often considered as the last sustained warm period with close enough geographic configurations compared to the present one associated with atmospheric CO2concentration (405±50 ppm) higher than the modern level. For this
rea-son, this period is often considered as a potential analogue for the future climate warming, with the important advantage that for mid-Pliocene many marine and continental data are available. To investigate this issue, we selected the RCP4.5 scenario, one of the current available future projections, to compare the pattern of tropical atmospheric response with the past warm mid-Pliocene climate.
We use three Atmosphere-Ocean General Circulation Model (AOGCM) simulations (RCP4.5 scenario, mid-Pliocene and present-day simulation) carried out with the IPSL-CM5A model and investigate atmospheric tropical dy-namics through Hadley and Walker cell responses to warmer conditions, considering that the analysis can provide some assessment of how these circulations will change in the fu-ture. Our results show that there is a damping of the Hadley cell intensity in the northern tropics and an increase in both subtropics. Moreover, northern and southern Hadley cells ex-pand poleward. The response of the Hadley cells is stronger for the RCP4.5 scenario than for the mid-Pliocene, but in very good agreement with the fact that the atmospheric CO2 concentration is higher in the future scenario than in the mid-Pliocene (543 versus 405 ppm). Concerning the response of
the Walker cell, we show that despite very large similarities, there are also some differences. Common features to both scenarios are: weakening of the ascending branch, leading to a suppression of the precipitation over the western trop-ical Pacific. The response of the Walker cell is stronger in the RCP4.5 scenario than in the mid-Pliocene but also de-picts some major differences, as an eastward shift of its rising branch in the future scenario compared to the mid-Pliocene.
In this paper, we explain the dynamics of the Hadley and Walker cells, and show that despite a minor discrepancy, the mid-Pliocene is certainly an interesting analogue for future climate changes in tropical areas.
1 Introduction
reached 360–440 ppm, and sea level was 22±10 m above the modern levels (Krantz, 1991; Dowsett et al., 1992; Raymo et al., 1996; Miller et al., 2012). Given the availability of relatively large sets of palaeoenvironmental proxy data, the mid-Pliocene has become an unequalled “palaeo-analogue” for future climate predictions by the end of 21st century (Thompson and Fleming, 1996; Jansen et al., 2007).
Indeed, future environmental scenarios and model predic-tions cannot be tested by observational data. However, look-ing at geological analogues, we can use the past environment as a guide for the understanding of future climate change and a test of the validity of climate models. The most recent warm climate associated with higher CO2values than modern is the mid-Pliocene; thereby there is no other way to learn about warm climate than to study deep-past climates that are geo-logically different from the present-day one, except for the mid-Pliocene (Salzmann et al., 2008). To better understand the dynamical causes for the mid-Pliocene warmth, and to further assess the ability of climate models to simulate past warm climate, a suite of simulations have been conducted for the mid-Pliocene warm period under the frame of the Pliocene Modeling Intercomparison Project (PlioMIP). Ac-cording to the PlioMIP, two experimental designs are recom-mended for each participating model. PlioMIP experimen-tal designs are well documented in literature (Haywood et al., 2010, 2011). Previously, there have been long-term ef-forts to reconstruct global sea surface temperature datasets (Dowsett et al., 1996; Dowsett and Robinson, 2009), which are very useful to validate PlioMIP simulations and further document the possible causes of the mid-Pliocene warm cli-mate by modelling studies. However, how far does the mid-Pliocene represent what may happen during the 21st century? We shall focus here on tropical–subtropical atmospheric dy-namics analysis in the mid-Pliocene and future climate by investigating the response of Hadley and Walker cells to past and future warm climates.
Modelling studies reveal that the simulated mid-Pliocene global annual surface air temperature and global mean sea surface temperature are warmer compared with a pre-industrial control experiment (Haywood et al., 2013). The increase of surface air temperature is non-uniform, with the most significant heating at higher latitudes. As has been shown (Masson-Delmotte et al., 2006), when greenhouse gas concentration increases, climate change shows a polar am-plification (i.e. decrease of equator-to-pole temperature gra-dient); therefore cooling or warming leads to an increased or reduced temperature gradient that modulates the Hadley cell intensity and extent (Ramstein et al., 1998). We also point out here that tropical atmospheric dynamics are very sensi-tive to this reduced temperature gradient. Reconstruction of sea surface temperature (SST) depicts a permanent El Ni˜no-like condition over the tropical Pacific in mid-Pliocene, char-acterized by reduced east–west asymmetry in SST and sub-surface thermocline depth (Wara et al., 2005; Ravelo et al., 2006). Some features of the atmospheric general circulation
in the mid-Pliocene have been also investigated using Atmo-sphere General Circulation Model (AGCM) simulation. The Kamae et al. (2011) study presented an AGCM simulation with specified PRISM3 SST and found one of the key as-pects of the mid-Pliocene climate was a slowdown of Walker circulation, resulting from a reduced east–west gradient of SST in the tropics, particularly in the Pacific Ocean and In-dian Ocean. The ascending branch of the Hadley cell in each hemisphere expands poleward in the mid-Pliocene warm pe-riod when the width of the ascending branch is defined as the range between the equator and the maximum of mass stream function (MSF) at 500hPa. This widening in the southern cell is larger than that in the northern cell. Additional sensitiv-ity experiments indicate that the ascending branches of the Hadley cells expand poleward in response to the warmer SST at higher latitudes (Kamae et al., 2011).
As discussed above, most previous studies focused on mechanisms responsible for the mid-Pliocene warmth. The increasing importance of the mid-Pliocene as an analogue of future climate warming induced by greenhouse gases is highlighted by the IPCC AR4 (Jansen et al., 2007). Thus the aim of the present study is to investigate whether the mid-Pliocene represents a plausible comparative climate for at-mospheric circulation changes in a future scenario. Here, we depict not only the similarity of Hadley cells and Walker cir-culation produced by the mid-Pliocene and future projection, but also pinpoint the differences and find out possible dynam-ical explanations for these differences between both simula-tions.
The structure of the present paper is organized as follows. A brief description of data and analysis method is given in Sect. 2. In Sects. 3 and 4, we carry out a comparative analysis of Hadley and Walker circulations between the RCP4.5 mod-erate scenario and the mid-Pliocene climate relative to the pre-industrial experiment. Similarities and differences in the response of Hadley and Walker cells to global mid-Pliocene and future warm climate are discussed in Sect. 5. The impact of Hadley and Walker circulation changes on precipitation in both climates is discussed in Sect. 6. Summary and general discussions conclude this study in Sect. 7.
2 Data and analysis method
2.1 The IPSL-CM5A atmosphere–ocean general circulation model
mid-resolution is 1.25◦in latitude by 2.5◦in longitude with 39 vertical levels (143×144, L 39) (Hourdin et al., 2013). The land surface model used is ORCHIDEE (Organizing Carbon and Hydrology In Dynamic Ecosystems), consist-ing of three modules: hydrology, carbon cycle and vegeta-tion dynamics (Krinner et al., 2005). The ocean model ver-sion is NEMOv3.2 (182×149, L 31) and mean grid spacing
is about 2◦with latitudinal resolution of 0.5◦near the equa-tor, 1◦in the Mediterranean Sea and 31 vertical levels in the ocean with 10 levels in the top 100 m (Madec, 2008). The sea ice model used here is LIM2 (Louvain-la-Neuve Sea Ice Model) (Fichefet and Maqueda, 1997). The four components are coupled together using OASIS3 coupler (Valcke, 2006).
There are two versions of the IPSL model (IPSL-CM5A-LR and IPSL-CM5A-MR) and both are used for CMIP5 pro-jection. Only the low resolution (IPSL-CM5A-LR) is avail-able for the mid-Pliocene simulation (Contoux et al., 2012), thus we select IPSL-CM5A-LR used for present compari-son between the RCP4.5 scenario and mid-Pliocene. Details of the IPSL-CM5A model are available in previous studies (Marti et al., 2010).
2.2 Pre-industrial experiment (control run)
The pre-industrial experiment is performed as required by CMIP5/CMIP3 using the IPSL-CM5A-LR model. Green-house gases, solar constant and orbital parameters are set to pre-industrial values recommended by CMIP5/CMIP3. So-lar constant is 1365 W m−2; CO2and CH4concentrations are fixed at 280 ppm and 760 ppb, respectively.
2.3 Mid-Pliocene warm period experiment
Recently, PlioMIP was established to assess the ability of various climate models to simulate the mid-Pliocene warm period (Haywood et al., 2010, 2011). The IPSL-CM5A-LR model as part of the PlioMIP has been used for the sim-ulation of the mid-Pliocene warm climate. The results are in good agreement with data globally and depict the same main features as other AOGCM models involved in PlioMIP (Contoux et al., 2012). The boundary conditions for the mid-Pliocene simulation are set following the PlioMIP experi-ment guidelines (Haywood et al., 2010, 2011) and are thor-oughly described in Contoux et al. (2012). Modern coast-line is employed in this simulation due to the challenge of changing the land–sea mask in the ocean model. Accord-ing to PlioMIP, differences between mid-Pliocene and mod-ern topographies are added as anomalies to IPSL-CM5A-LR model topography (Sohl et al., 2009; Edwards, 1992). Im-posed ice-sheet and vegetation reconstructions are derived from PRISM3D (Hill et al., 2007; Salzmann et al., 2008). Orbital configuration, solar constant, greenhouse gases and aerosols were specified as similar to the pre-industrial con-trol run, except for atmospheric CO2 concentration which was fixed at 405 ppm.
2.4 Future climate projections
According to CMIP5 experiment design, future projections are required for each participating model under the represen-tative concentration pathways (RCPs) proposed by CMIP5. RCPs represent pathways of radiative forcing (in W m−2)
that reach a specific value by the end of the 21st century relative to the pre-industrial. There are four RCP scenarios: RCP2.6 (low), RCP4.5 (medium), RCP6.0 (medium-high) and RCP8.5 (high). RCP4.5 is the current moderate sce-nario we choose for comparison with mid-Pliocene warm climate. The integration length of the RCP4.5 scenario is almost 300 yr, from 1 January 2006 to 31 December 2300. The atmospheric CO2concentration increases from 378 ppm and then stabilizes at 543 ppm in 2150. Results from the IPSL-CM5A-LR model are compared to the last 50 yr of the 300 yr RCP4.5 simulations of six other CMIP5 mod-els (MPI-ESM-LR, BCC-CSM1.1, NorESM1-M, NCAR-CCSM4, FGOALS-S2, MIROC-ESM), as listed in Table 1.
Here, we analyze the large-scale atmospheric circulation produced by RCP4.5 and compare it with the mid-Pliocene warm period. However, previous studies argued that the mid-Pliocene should not be considered as an analogue for the future warming, which represents a non-equilibrium pertur-bation of the climate system, whereas mid-Pliocene climate is an equilibrium response to long-term changes in external forcing (Crowley, 1996). It is possible that ocean processes in response to CO2increase are still not equilibrated due to the large inertia of the ocean. We here will consider the fast atmospheric tropical response and choose the last 50 yr of the 300 yr RCP4.5 simulation used for comparison with the mid-Pliocene.
2.5 Method description
The mass stream function is a conventional way to depict the Hadley circulation (Cook, 2003). Using pressure as the vertical coordinate, conservation of mass requires
1
a×cosφ ∂u ∂λ+
1
a×cosφ
∂(v×cosφ) ∂φ +
∂ω
∂p =0, (1)
whereuis zonal velocity, v the meridional velocity, ωthe verticalpvelocity,athe earth’s radius,λlongitude, and ø lat-itude. If Eq. (1) is averaged over longitude, around the entire globe, then the first term on the left-hand side of the equation is zero. Using square brackets to denote this zonal average, the continuity equation is
1
a×cosφ
∂([v]×cosφ) ∂φ +
∂[ω]
∂p =0. (2)
Table 1.Multi-model comparative analysis of Hadley circulation properties (maximum of MSF and corresponding position, Hadley cell boundaries) in the RCP4.5 scenario, and Hadley cell boundaries and maximum MSF from pre-industrial control run (in parentheses).
Southern Hadley Cell Northern Hadley Cell Model maximum location edge maximum location edge
(1010kg s−1) (1010kg s−1)
IPSL-CM5A-LR −10.07 (−9.18) (12.3◦S, 700 hPa) 30.5◦S (28.6◦S) 6.93 (8.01) (14.2◦N, 500 hPa) 28.8◦N (28.0◦N) MPI-ESM-LR –10.35(−10.17) (14.0◦S,700 hPa) 30.9◦S (30.2◦S) 7.10(7.4) (15.8◦N, 600 hPa) 29.5◦N(29.0◦N) BCC-CSM1.1 −8.00 (−8.1) (12.5◦S,700 hPa) 31.1◦S (30.3◦S) 7.49 (7.8) (15.4◦N, 600 hPa) 29.4◦N(28.9◦N) NorESM1-M –10.11(−10.19) (10.4◦S, 700 hP) 33.4◦S (32.6◦S) 8.62 (9.17) (14.2◦N, 600 hPa) 30.8◦N (30.5◦N) NCAR-CCSM4 −8.95 (−9.46) (13.7◦S, 700 hP) 33.9◦S (33.0◦S) 7.23 (7.78) (14.6◦N, 600 hPa) 31.8◦N (31.3◦N) FGOALS-S2 −8.33 (−10.07) (14.1◦S, 700 hP) 31.5◦S (29.7◦S) 7.33 (7.11) (14.1◦N, 600 hPa) 29.6◦N(28.5◦N) MIROC-ESM −11.9 (−11.14) (9.8◦S, 700 hPa) 29.2◦S (28.4◦S) 8.74 (9.34) (12.6◦N,500 hPa) 27.9◦N (27.7◦N)
The italics represent the modelling consistency of Hadley circulation properties in the RCP4.5 scenario between the IPSL model and other models.
to characterize the Hadley circulation, defined by [v]= g
2π a×cosφ ∂9
∂p (3)
and
[ω]= − g
2π a2×cosφ
∂9
∂φ. (4)
Theoretically, stream function can be calculated from obser-vation of either [v] or [ω], but [v] is used for practical reasons because meridional velocities are more frequently and accu-rately observed. Solving forψand integrating from the top of the atmosphere yields
9(φ, p)=2π a×cosφ
g
p
Z
P0
[v(φ, p)]dp. (5)
3 Changes of Hadley circulation in RCP4.5 and mid-Pliocene compared to pre-industrial control run
We use mass stream function (hereafter MSF) to depict the Hadley circulation. Positive (negative) values of MSF indi-cate net northward (southward) mass transport. The intensity of Hadley cells is usually defined as the maximum of abso-lute MSF between 30◦S and 30◦N (Oort and Yienger, 1996). Before discussing the MSF changes in the mid-Pliocene and RCP4.5 simulations, we first examine the intensity and ex-tent of Hadley circulation derived from the pre-industrial, mid-Pliocene and RCP4.5 scenario. The observed Hadley circulation is well captured by annual averaged MSF derived from the control run (not shown). Hadley circulation con-sists of two close loops with ascending motion near the equa-tor and descending motion in both subtropics (green vec-tors); one is in the Northern Hemisphere (northern Hadley cell) and the other is in the Southern Hemisphere (south-ern Hadley cell). As listed in Table 1, the simulated inten-sity of northern and southern Hadley cells derived from the
IPSL pre-industrial experiment is close enough to the ob-served maximal MSF (8.76×10¹⁰kg s−1)and minimal MSF (−9.48×10¹⁰kg s−1), respectively. The positions of maxi-mal and minimaxi-mal MSF from the control run are compara-ble to the observed (12.5◦N, 600 hPa) and (10◦S, 700 hPa). As shown in Fig. 1a, b, the structures of MSF derived from the mid-Pliocene and RCP4.5 scenario are almost identical to that of the pre-industrial simulation.
Statistically significant changes of Hadley circulation can be found in the future projection relative to the control run (Fig. 1c, dotted area indicates statistical significance level of 95 %). The Hadley circulation in the future sce-nario is characterized by weakening Hadley cells in the trop-ics (10◦S–20◦N) and strengthening Hadley cells in the sub-tropics (23◦26′S–35◦S and 23◦26′N–35◦N). Hadley circu-lation also depicts significant changes in the mid-Pliocene in comparison with the control run (Fig. 1d). Coherent in-tensification occurs on the southern Hadley cell in the mid-Pliocene, while the Hadley cell in the Northern Hemisphere has obvious regional changes associated with weakening of Hadley circulation in the northern tropics (equator–20◦N) and intensified Hadley circulation in the northern subtropics (23◦26′N–35◦N).
Thus, Hadley circulations in the two warm climates share many similarities when compared to the pre-industrial con-trol run, i.e. the strength of Hadley cells intensifies in both subtropics (23◦26′S–35◦S; 23◦26′N–35◦N) and decreases in the northern tropics (equator–20◦N). However, large dif-ferences still exist between the RCP4.5 and mid-Pliocene ex-periments, as displayed in Fig. 1e. The strength of Hadley circulation in the RCP4.5 scenario is weakened in the tropics (20◦S–20◦N) and enhanced in the subtropics of both hemi-spheres (23◦26′S–35◦S; 23◦26′N–35◦N) compared with that in the mid-Pliocene warm period. This difference con-tributes to the different behaviour of Hadley cell boundaries between both simulations.
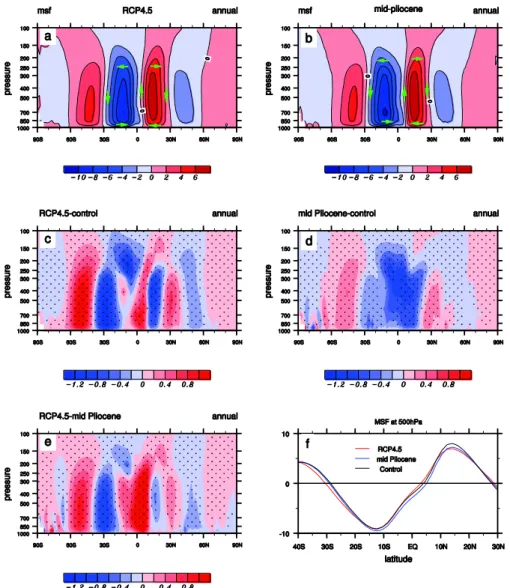
Fig. 1.Climatological annual average mass stream function (units: 1010kg s−1)simulated by RCP4.5(a)and mid-Pliocene (b). Mass stream function changes in RCP4.5 and mid-Pliocene compared to the control run are displayed in(c, d), respectively. Mass stream function differences between RCP4.5 and mid-Pliocene shown in(e), and(f)represents mass stream function at 500 hPa (red line: RCP4.5; blue line: mid-Pliocene; black line: control run). The dot area represents statistical significance with a 95 % confidence.
Hadley cell boundaries. MSF at 500 hPa is chosen to quanti-tatively illustrate the changes of the Hadley cell boundaries in both simulations relative to the control run (Fig. 1f). Hadley cell boundaries are identified as the latitudes where MSF equals 0 kg s−1. The latitudinal positions where the values of MSF are zero in both subtropical regions shift poleward in both warm climates, resulting from the intensified MSF in the subtropics compared with the control run. Widening of Hadley cells also can be confirmed using another measure-ment of Hadley circulation, as the vertical shear of merid-ional velocity (V250 minus V850) shown in the Fig. 2a (Quan et al., 2004).
Figure 2b quantifies the edge latitudes of northern and southern Hadley cells, derived from the definition of MSF. The analysis suggests that the width of the southern Hadley
Fig. 2. (a) Simulated vertical shear of meridional wind (V250– V850) derived from three different simulations (control run, RCP4.5 and mid-Pliocene).(b)Hadley cell edges in the three ex-periments.
Properties of the Hadley cells generated by the IPSL-CM5A-LR model are close to those projected from the CMIP5 dataset, as listed in Table 1; thus the results derived from IPSL are not model-dependent. As mentioned above, the observed intensity of northern and southern Hadley cells can be realistically reproduced by IPSL-CM5A-LR. All the models show a weakened maximal MSF in the Northern Hemisphere when compared to the pre-industrial experi-ment, while the enhanced minimal MSF in the Southern Hemisphere derived from the IPSL-CM5A-LR is in good agreement with the results of MPI-ESM-LR and MIROC-ESM. More important, widening of Hadley cells can also be seen in other models.
4 Changes of Walker circulation in RCP4.5 and mid-Pliocene compared to pre-industrial control run
Walker circulation is the most important large-scale zonal overturning circulation in the tropics. It is characterized by rising air in the equatorial western Pacific, flowing eastward in the upper troposphere and sinking in the eastern Pacific, returning towards the western Pacific in the lower levels (Walker and Bliss, 1932, 1937). Changes in Walker circula-tion have a large impact on global and regional climate (Ro-pelewski and Halpert, 1989; Power et al., 1999; Holmgren et al., 2001). Thus, it has been a major research focus for many
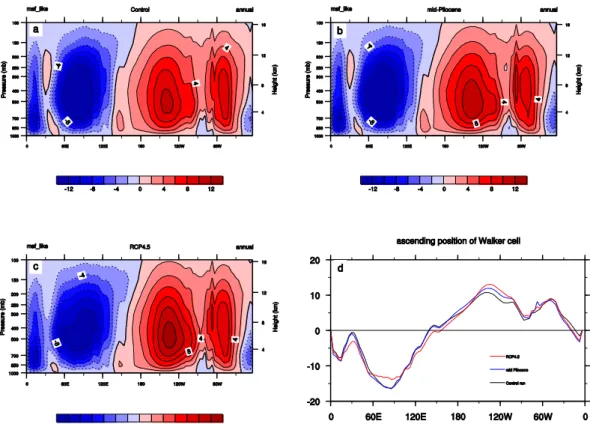
Fig. 3.Climatological annual average potential velocity (contours; 107m2s−1)and divergent wind (blue vectors; m s−1)at 200 hPa height, as well as vertically averaged vertical wind (ω, 10−2m s−1)
weighted by the level’s pressure depth (shaded dot region), derived from different simulations:(a)pre-industrial control run;(b) mid-Pliocene warm period; and(c)the RCP4.5 scenario. The response of multi-variables (potential velocity, divergent wind,ω) to the future and mid-Pliocene warming when compared to control run are dis-played in(d, e), and(f)represents differences between the RCP4.5 scenario and mid-Pliocene.
years (Trenberth and Hoar, 1997; Collins et al., 2010; Sohn et al., 2013).
Figure 3a–c shows the Walker circulation defined by the divergent component of the horizontal vector, correspond-ing potential velocity (contours) at 200 hPa and the verti-cal weighted average of vertiverti-cal windωover each grid cell at each level (from 100 hPa to 1000 hPa), weighted by the level’s pressure depth (shaded dots), derived from the con-trol run, mid-Pliocene and RCP4.5 scenario, respectively.ω
is the pressure vertical velocity, so positive (negative) values represent descending (ascending) motion. The annual mean Walker circulation is represented by ascending motion over the tropical western Pacific and descending motion over the eastern Pacific, as displayed in Fig. 3a–c.
circulation is weakened compared to the pre-industrial con-trol run, and is characterized by a statistically significant de-cay (95 % confidence, not shown) of upward motion in the tropical western Pacific “warm pool” (90–150◦E) and a de-crease of upper level divergence in this region (Fig. 3d). Walker circulation in the RCP 4.5 scenario is also quite dif-ferent from the control simulation, associated with a large weakening of ascending motion (90–120◦E) to the west of the divergent centre and an increase of ascending motion (140–180◦E) to the east of the maximal divergence. As a result, the rising branch of the Walker circulation in the fu-ture scenario is weakened in the tropical western Pacific and shifted eastward (Fig. 3e). These behaviours of Walker cells in both warm climates depict clear changes of Walker circu-lation in comparison with the control run; nevertheless, large differences of Walker cell responses exist between RCP4.5 and mid-Pliocene, as shown in Fig. 3f. The ascending branch of the Walker cell in the future scenario is more decreased over the tropical western Pacific, but an increase of diver-gence at 200 hPa takes place over the central Pacific, whereas these changes do not occur in the mid-Pliocene warm cli-mate.
To display the vertical profile of the Walker cell and quan-tify the ascending branch of the Walker cell, we computed a MSF-like indicator, defined as the vertical integration of the divergent component of zonal wind in low latitude (30◦S– 30◦N) (Kamae et al., 2011). The positive values of the MSF-like indicator represent net eastward divergent trans-port, while the negative values indicate net westward diver-gent transport. There are two enclosed zonal cells as dis-played by Fig. 4a–c. One is the clockwise cell located over the Pacific and the other is anticlockwise, associated with the principal part over the Indian Ocean. The former is indeed Walker circulation over the Pacific Ocean (i.e. the character-istic of the Walker cell can be captured by the MSF-like in-dicator), and thus longitudinal position where the MSF-like value equals zero at 500 hPa over the region (120–180◦E) enables us to describe the differences of longitudinal posi-tion of the ascending branch of the Walker cell between the RCP4.5 scenario and mid-Pliocene (Fig. 4d). The ascending branch of the Walker cell slightly shifts eastward in the mid-Pliocene warm climate (139.7◦E) compared with the control run (138.5◦E), while the longitudinal position of this ascend-ing branch in the future scenario (156.2◦E) shifts eastward much more than for the mid-Pliocene compared to the con-trol run, which is consistent with previous results from the divergent horizontal vector at 200 hPa (Fig. 3d–f).
To evaluate the robustness of our results, we also examine the Walker cell in the RCP4.5 scenario derived from CMIP5 models. The weakened ascending motion over the western Pacific and increasing ascending motion over the central Pa-cific can be seen in the MPI-ESM-LR model and NorESM1-M model (not shown). Therefore, the behaviour of the Walker cell in the future warm climate is not model dependent.
5 Dynamical explanations of Hadley and Walker cell responses to both warm climate conditions
5.1 Hadley and Walker circulation changes in RCP4.5 and mid-Pliocene in response to global warming
Observational analyses have demonstrated that the Hadley cells expanded poleward in recent decades (Hu and Fu, 2007), and various modelling studies have investigated the Hadley cell expansion under global warming (Lu et al., 2007). Results suggested that climate models have the ca-pability of simulating the observed poleward shift of the Hadley cells, despite that the simulated expansion of the Hadley cells in terms of magnitude is smaller than the ob-served values (Johanson and Fu, 2009). A recent modelling study suggested that increasing greenhouse gases play an important role in causing the observed poleward expansion of the Hadley circulation (Hu et al., 2013). Climate models predict a weakening of the atmospheric convective overturn-ing in response to surface warmoverturn-ing driven by an increase in greenhouse gases (Knutson and Manabe, 1995; Tanaka et al., 2004; Held and Soden, 2006). Subsequent analysis argued that the weakening of tropical Pacific atmospheric circula-tion is due to anthropogenic forcing (Vecchi et al., 2006). Widening of the Hadley cells and slowdown of the Walker cell are detectable in both warm climates, and whether these changes of Hadley and Walker cells in response to future and past global warming are related to the increasing atmospheric CO2concentration will be clarified in Sects. 5.2 and 5.3.
Fig. 4.MSF-like function (units: 1010kg s−1)simulated by three different simulations (control run, mid-Pliocene, and RCP4.5 scenario) as displayed in(a–c), respectively, and the MSF-like function at 500 hPa used for description of the longitudinal position of the ascending branch of the Walker cell(d).
the relatively larger warming can be observed in the eastern tropical Pacific (Fig. 5e), when compared to the western trop-ical Pacific. This warming pattern agrees with observations. In contrast, the RCP4.5 experiment actually was run for 150 yr, after the atmospheric CO2became stable at 543 ppm. In this experiment, the upper ocean cannot reach equilibrium. When compared to the control run, strong warming appears along the equatorial Pacific (Fig. 5d). Seen in this way, due to the different experimental design, the responses of tropical Pacific SST to increases of CO2concentration should be dis-tinguished in the mid-Pliocene and the RCP4.5 experiment. The different changes in tropical Pacific SST highly likely cause the different responses of the Walker cell in these two experiments.
Indeed, the detailed response of Hadley and Walker cells to increasing greenhouse gases is complex, as Hadley and Walker cells are influenced by many factors. In this study, we attempt to give the explanation of the Hadley cell and Walker circulation changes from the perspective of atmospheric dy-namics.
5.2 Dynamical mechanism of Hadley cell response to global warming
In theory, both the Hadley and Walker cells are directly driven by the south–north and east–west thermal contrast,
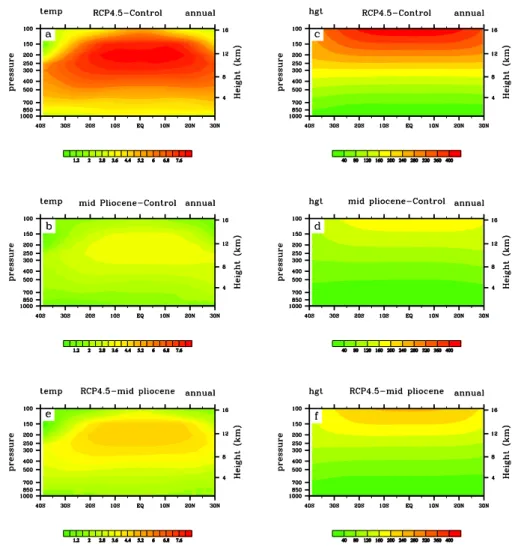
respectively. It means that the Hadley cells are directly driven by the zonal average equator-to-pole pressure gradient in the upper troposphere, which is largely determined by the zonal average temperature gradient from equator to pole in the upper troposphere (Webster, 2004). As shown in Fig. 6a and b, tropospheric warming is not globally uniform in both warm climates with maximal centre in the tropical upper tro-posphere, and this non-uniform warming would lead to an increase of poleward air temperature gradient in the future scenario and past warm climate (Fig. 6a, b). An increase of equator-to-pole temperature gradient is responsible for in-creasing the poleward pressure gradient (Fig. 6c, d), and should thereby be beneficial for the poleward expansion of the Hadley cells simulated by the future scenario and mid-Pliocene warm period. Moreover, meridional air temperature gradient increases more in the RCP4.5 scenario in terms of magnitude than in the mid-Pliocene climate (Fig. 6e), which would lead to a larger poleward pressure gradient in the RCP4.5 than in the mid-Pliocene (Fig. 6f), and thus could ex-plain the larger expansion of the Hadley cells in the RCP4.5 scenario than in the mid-Pliocene.
Fig. 5.Annual mean sea surface temperature (units:◦C) in(a)pre-industrial control run,(b)mid-Pliocene and(c)RCP4.5. Annual mean sea surface temperature anomalies(d)between RCP4.5 and control run,(e)between mid-Pliocene and control run, and(f)between RCP4.5 and mid-Pliocene.
that anthropogenic CO2 increase plays an important role in the observed widening of Hadley circulation (Hu et al., 2013). In the present study, we consider that CO2 concen-tration increase would be the possible factor responsible for non-uniform warming in both warm climates. Indeed, the magnitude of this non-uniform warming increases with CO2concentration, which could explain the poleward expan-sion of the Hadley cells in the RCP4.5 scenario (543 ppm) and mid-Pliocene (405 ppm) compared to the pre-industrial run (280 ppm), and the larger widening of the Hadley cells in the future scenario (543 ppm) than in the mid-Pliocene (405 ppm).
5.3 Dynamical mechanism of Walker circulation response to global warming
We first examine the annual mean west/east thermal contrast over the tropical upper level troposphere. Figure 7 represents
Fig. 6.Zonal average air temperature anomalies (units:◦C)(a)between RCP4.5 and control run,(b)between mid-Pliocene and control run. Potential height changes (units: m)(c)between RCP4.5 and control run, and(d)between mid-Pliocene and control run. Zonal average anomalies of air temperature(e)and potential height(f)between RCP4.5 and mid-Pliocene.
Non-uniform zonal atmospheric warming explains the different behaviour of the Walker circulation between the RCP4.5 scenario and mid-Pliocene warm period. The most significant zonal warming in the mid-Pliocene is to the west of the annual averaged maximal air temperature of the pre-industrial simulation, with a reversed air temperature gra-dient generated from the Indian Ocean to the western Pa-cific (Fig. 8a). This leads to a pressure gradient from the Indian Ocean to the western Pacific (Fig. 8b) and thereby suppresses upper-level divergence, thus weakening the as-cending branch of the Walker cell over the western Pacific during the mid-Pliocene. Projected warming features two significant peaks located in the west and east sides of the present-day maximum of air temperature, respectively, asso-ciated with two valleys confined over the tropical western and eastern Pacific, respectively. Therefore, there are two re-versed air temperature gradients generated over the tropical western Pacific in comparison with present-day conditions and both are directed to the tropical western Pacific, whereas
two reversed temperature gradients dominate the central Pa-cific. The first is from central to western Pacific and the sec-ond is from central to eastern Pacific (Fig. 8c). The first tem-perature gradient leads to a central-to-western Pacific pres-sure gradient and directly suppresses the ascending motion of the Walker circulation over the western Pacific. The sec-ond one leads to a central-to-eastern Pacific pressure gradient and thereby increases the divergence over the central Pacific (Fig. 8d). The response of the pressure gradient to the non-uniform warming exhibits large differences between RCP4.5 and mid-Pliocene (Fig. 8e, f), which is responsible for the differences of the Walker cell between both simulations.
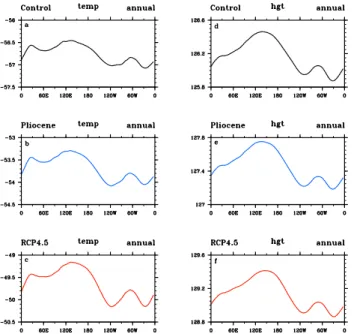
Fig. 7.Annual mean vertically averaged air temperature (◦C) in the upper troposphere (400 hPa to 100 hPa) derived from(a)the control run,(b)mid-Pliocene and(c)the RCP4.5 scenario. Potential height (units: 102m) derived from(d) the control run,(e)mid-Pliocene and(f)the RCP4.5 scenario.
6 The impact of Hadley and Walker circulations on the regional hydrological cycle
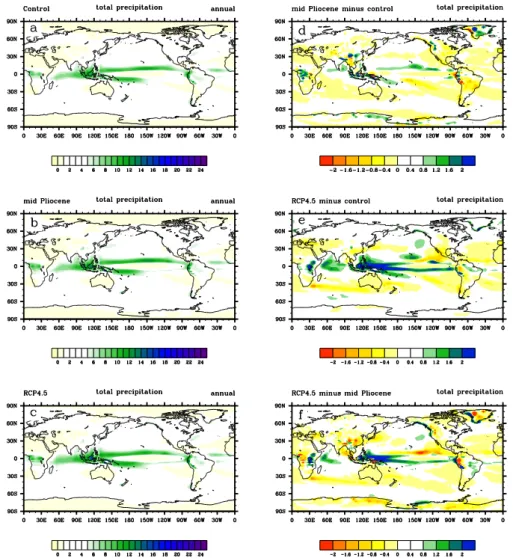
In this section, we will examine the response of the hydro-logical cycle associated with Hadley cells and Walker circu-lation under the global warming scenario. Figure 9a–c shows simulated annual mean precipitation for the three different experiments (pre-industrial control run, mid-Pliocene and RCP4.5 scenario). Spatial patterns of precipitation distribu-tion have large similarities, characterized by increased rain-fall in the tropics and middle-latitude ocean but decreased precipitation in the subtropics and higher latitudes. Double Intertropical Convergence Zone (ITCZ) phenomenon is still depicted in the coupled model simulations.
It is well known that the subtropics experience relatively lower levels of precipitation due to subsidence of the Hadley circulation. As suggested in Sect. 3, the strength of the Hadley cells increase remarkably in the subtropics and the edge latitudes of Hadley cell boundaries shift poleward in both warm climates, which leads to much drier subtropical regions and poleward expansion of the edges of subtropical dry zones in the mid-Pliocene and RCP4.5 scenario (Fig. 9d, e). For example, a decrease in annual mean precipitation can be seen between 20 and 35◦N over Africa in the mid-Pliocene simulation compared to the control run (Fig. 9d). This feature is in good agreement with the data compila-tion of Salzmann et al. (2008) over the Mediterranean coast of Morocco and Tunisia, which shows temperate xerophytic shrubland, i.e. drier conditions than the present-day temper-ate sclerophyll woodland (Salzmann et al., 2011). However,
Fig. 8. (a)Vertically averaged upper level (from 400 hPa to 100 hPa) temperature anomaly (units: ◦C) between mid-Pliocene and the control run.(b)Potential height anomaly (units: m) between mid-Pliocene and control run.(c)and(d)are the same as(a)and(b)but for differences between RCP4.5 and the control run, respectively. (e)and(f)are the same as(a)and(b)but for differences between RCP4.5 and mid-Pliocene.
Australia and South Africa are more vegetated during the mid-Pliocene than at present (Salzmann et al., 2008), a fea-ture that is not reproduced by our climate simulation which depicts similar or drier conditions than today. Nevertheless, increase in precipitation over South Africa could have been triggered by varying orbital configurations during the Piacen-zian. In addition, the East Asian summer monsoon (EASM) area is much wetter in mid-Pliocene than for present day, which is consistent with other modelling studies which show stronger EASM in the mid-Pliocene (Yan et al., 2012; Zhang et al., 2013) and with reconstructed biomes for the mid-Pliocene (Salzmann et al., 2008). Subtropics in both hemi-spheres are much drier in the future scenario than in the mid-Pliocene, which is consistent with stronger Hadley cells in the subtropics and larger expansion of Hadley cell bound-aries (Fig. 9f).
Fig. 9.Simulated annual mean total precipitation (units: mm day−1) from(a)the control run,(b)the mid-Pliocene warm period and(c) the RCP4.5 scenario. Simulated responses of the total precipitation to mid-Pliocene(d)and future warm climate(e), and total precipitation difference between the RCP4.5 and mid-Pliocene(f)are displayed in(d–f), respectively.
7 Discussion and conclusion
In this paper, we investigated the changes of Hadley and Walker circulations in the mid-Pliocene and future warm cli-mates based on the comparison with the pre-industrial con-trol experiment. We analyzed the response of Hadley and Walker cells in both contexts of warm climates and explained most of the changes occurring in the tropics through large-scale atmospheric dynamics. The main conclusions are as follows.
There are many similarities in Hadley cell response to both warm climates. The strength of the Hadley cells shows ob-vious intensification in both subtropics and a decrease in the northern tropics. The intensified Hadley cells in both subtropics lead to widening of Hadley cell boundaries in both warm climates. Moreover, the Hadley cell poleward ex-pansion is larger in the RCP4.5 scenario than in the mid-Pliocene, which is very consistent with the higher CO2
concentration (543 ppm) in the future scenario than in the mid-Pliocene (405 ppm).
The simulated Walker cell exhibits many similarities for both climates but also depicts some differences between the mid-Pliocene and the RCP4.5 scenario. For instance, the as-cending branch of the Walker cell is suppressed over the western tropical Pacific compared to the present day, leading to a slowdown of the Walker cell and a suppression of precip-itation over the western Pacific in both simulations. The ma-jor difference of Walker cell responses is that the ascending branch of the Walker cell in the RCP4.5 scenario is shifted eastward while this is not the case in the mid-Pliocene. The response of west-to-east thermal contrast exhibits large dif-ferences between RCP4.5 and mid-Pliocene, which could ex-plain the differences in the Walker cell between both simula-tions.
mid-Pliocene are a good analogue for the projected Hadley cells, whereas the response of west-to-east thermal contrast to CO2increasing concentration is not similar, which implies some limits to the analogue hypothesis.
Multi-model comparison studies have been performed on the Hadley and Walker cells in the future climate. The re-sults suggested that the widening of the Hadley cells, the weakening of the ascending branch of the Walker cell over western Pacific and the increased divergence over the cen-tral Pacific are robust features, i.e. not model-dependent. Our results demonstrate that a simulated Walker cell generally slows down and Hadley cells expand poleward in the mid-Pliocene warm climate, in agreement with recent modelling studies (Kamae et al., 2011). This paper mainly focuses on the model comparison of past and future warm climates. An interesting issue beyond our investigation would be whether the weakened rising motion of the Walker cell is relevant to the permanent “El Ni˜no-like” condition in the mid-Pliocene.
Acknowledgements. We are particularly grateful to the JOINT DOCTORAL PROMOTION PROGRAMME (DPP) between Chinese Academy of Sciences (CAS) and Centre National de la Recherche Scientifique (CNRS) for providing financial support during my visit. Thanks also to Yan Zhao (LSCE/IPSL, CEA-CNRS-UVSQ, Gif-sur-Yvette, France) for comments on an earlier version of this manuscript. Two anonymous reviewers also made a large number of helpful suggestions. We acknowledge all those who contributed to producing the PlioMIP and CMIP5 multi-model ensembles and data syntheses, without which this work would not exist.
Edited by: A. Haywood
The publication of this article is financed by CNRS-INSU.
References
Collins, M., An, S.-I., Cai, W., Ganachaud, A., Guilyardi, E., Jin, F.-F., Jochum, M., Lengaigne, M., Power, S., Timmermann, A., Vecchi, G., and Wittenberg, A.: The impact of global warming on the tropical Pacific Ocean and El Nino, Nat. Geosci., 3, 391–397, 2010.
Contoux, C., Ramstein, G., and Jost, A.: Modelling the mid-Pliocene Warm Period climate with the IPSL coupled model and its atmospheric component LMDZ5A, Geosci. Model Dev., 5, 903–917, doi:10.5194/gmd-5-903-2012, 2012.
Cook, K. H.: Role of continents in driving the Hadley cells, J. At-mos. Sci., 60, 957–976, 2003.
Crowley, T. J.: Pliocene climates: the nature of the problem, Mar. Micropaleontol., 27, 3–12, 1996.
Dowsett, H. J. and Robinson, M. M: Mid-Pliocene equatorial Pa-cific sea surface temperature reconstruction: a multi-proxy per-spective, Philos. Trans. R. Soc. A., 367, 109–125, 2009. Dowsett, H. J., Cronin, T. M., Poore, R. Z., Thompson, R. S.,
What-ley, R. C., and Wood, A. M: Micropaleontological Evidence for Increased Meridional Heat Transport in the North Atlantic Ocean During the Pliocene, Science, 258, 1133–1135, 1992.
Dowsett, H., Barron, J., and Poore, R: Middle Pliocene sea surface temperatures: a global reconstruction, Mar. Micropaleontol., 27, 13–25, 1996.
Dufresne, J.-L., Foujols, M.-A., Denvil, S., Caubel, A., Marti, O., Aumont, O., Balkanski, Y., Bekki, S., Bellenger, H., Benshila, R., Bony, S., Bopp, L., Braconnot, P., Brockmann, P., Cadule, P., Cheruy, F., Codron, F., Cozic, A., Cugnet, D., de Noblet, N., Duvel, J.-P., Eth´e, C., Fairhead, L., Fichefet, T., Flavoni, S., Friedlingstein, P., Grandpeix, J.-Y., Guez, L., Guilyardi, E., Hauglus-taine, D., Hourdin, F., Idelkadi, A., Ghattas, J., Jous-saume, S., Kageyama, M., Krinner, G., Labetoulle, S., Lahellec, A., Lefebvre, M.-P., Lefevre, F., Levy, C., Li, Z. X., Lloyd, J., Lott, F., Madec, G., Mancip, M., Marchand, M., Masson, S., Meurdesoif, Y., Mignot, J., Musat, I., Parouty, S., Polcher, J., Rio, C., Schulz, M., Swingedouw, D., Szopa, S., Talandier, C., Terray, P., and Viovy, N: Climate change projections using the ISPL-CM5 earth system model: from CMIP3 to CMIP5, Clim. Dynam., 40, 2123–2165, doi:10.1007/s00382-012-1636-1, 2013. Edwards, M.: Global Gridded Elevation and Bathymetry, in: Global Ecosystems Database, Version 1.0 (on CD-ROM), Documenta-tion anual, Disc-A: NaDocumenta-tional Geophysical Data Center, Key to Geophysical Records Documentation No. 26 (incorporated in: Global Change Database, Volume 1), edited by: Kineman, J. J. and Ohrenschall, M. A., Boulder, CO, National Oceanic and At-mospheric Administration, A14.1–A14.4, 1992.
Fichefet, T. and Maqueda, M. A. M.: Sensitivity of a global sea ice model to the treatment of ice thermodynamics and dynamics, J. Geophys. Res., 102, 12609–12646, 1997.
Foley, K. M., Dowsett, H. J., Robinson, M. M., and Stoll, D. K.: Global warming analysis – PRISM 3D: Pliocene Research, Interpretation and Synoptic Mapping, USGS, available at: http://geology.er.usgs.gov/eespteam/prism/index.html (last ac-cess: 22 July 2013), 2009.
Foster, G. L., Lunt, D. J., and Parrish, R. R.: Mountain uplift and the glaciation of North America – a sensitivity study, Clim. Past, 6, 707–717, doi:10.5194/cp-6-707-2010, 2010.
Haywood, A. M. and Valdes, P. J.: Modelling Pliocene warmth: con-tribution of atmosphere, oceans and cryosphere, Earth Planet. Sc. Lett., 218, 363–377, 2004.
Haywood, A. M., Valdes, P. J., and Sellwood, B. W.: Global scale palaeoclimate reconstruction of the middle Pliocene climate us-ing the UKMO GCM: initial results, Global Planet. Change, 25, 239–256, 2000.
Haywood, A. M., Dowsett, H. J., Otto-Bliesner, B., Chandler, M. A., Dolan, A. M., Hill, D. J., Lunt, D. J., Robinson, M. M., Rosen-bloom, N., Salzmann, U., and Sohl, L. E.: Pliocene Model Inter-comparison Project (PlioMIP): experimental design and bound-ary conditions (Experiment 1), Geosci. Model Dev., 3, 227–242, doi:10.5194/gmd-3-227-2010, 2010.
experi-mental design and boundary conditions (Experiment 2), Geosci. Model Dev., 4, 571–577, doi:10.5194/gmd-4-571-2011, 2011. Haywood, A. M., Hill, D. J., Dolan, A. M., Otto-Bliesner, B. L.,
Bragg, F., Chan, W.-L., Chandler, M. A., Contoux, C., Dowsett, H. J., Jost, A., Kamae, Y., Lohmann, G., Lunt, D. J., Abe-Ouchi, A., Pickering, S. J., Ramstein, G., Rosenbloom, N. A., Salz-mann, U., Sohl, L., Stepanek, C., Ueda, H., Yan, Q., and Zhang, Z.: Large-scale features of Pliocene climate: results from the Pliocene Model Intercomparison Project, Clim. Past, 9, 191–209, doi:10.5194/cp-9-191-2013, 2013.
Held, I. M. and Soden, B. J.: Robust Responses of the Hydrological Cycle to Global Warming, J. Climate, 19, 5686–5699, 2006. Hill, D. J., Haywood, A. M., Hindmarsh, R. C. A., and Valdes, P.
J.: Characterising ice sheets during the mid-Pliocene: evidence from data and models, in: Deep Time Perspectives on Climate Change: Marrying the Signal from Computer Models and Bio-logical Proxies, edited by: Williams, M., Haywood, A. M., Gre-gory, F. J., and Schmidt, D. H., Micropalaeontol. Soc., Spec. Pub. Geol. Soc., London, 517–538, 2007.
Holmgren, M., Scheffer, M., Ezcurra, E., Guti´errez, J. R., and Mohren, G. M. J.: El Ni˜no effects on the dynamics of terrestrial ecosystems, Trends Ecol. Evol., 16, 89–94, 2001.
Hourdin, F., Foujols, M.-A., Codron, F., Guemas, V., Dufresne, J.-L., Bony, S., Denvil, S., Guez, J.-L., Lott, F., Ghattas, J., Braconnot, P., Marti, O., Meurdesoif, Y., and Bopp, L.: Climate and sensi-tivity of the IPSL-CM5A coupled model: impact of the LMDZ atmospheric grid configu-ration, Clim. Dynam., 40, 2167–2192, doi:10.1007/s00382-012-1411-3, 2013.
Hu, Y. and Fu, Q.: Observed poleward expansion of the Hadley circulation since 1979, Atmos. Chem. Phys., 7, 5229–5236, doi:10.5194/acp-7-5229-2007, 2007.
Hu, Y. Y., Tao, L. J., and Liu, J. P.: Poleward expansion of the Hadley circulation in CMIP5 simulations, Adv. Atmos. Sci., 30, 790–795, doi:10.1007/s00376-012-2187-4, 2013.
Jansen, E., Overpeck, J., Briffa, K. R., Duplessy, J.-C., Joos, F., Masson-Delmotte, V., Olago, D., Otto-Bliesner, B., Peltier, W. R., Rahmstorf, S., Ramesh, R., Raynaud, D., Rind, D., Solom-ina, O., Villalba, R., and Zhang, D.: Palaeoclimate, in: Cli-mate Change 2007: The Physical Science Basis. Contribution of Working Group I to the Fourth Assessment Report of the In-tergovernmental Panel on Climate Change, edited by: Solomon, S., Qin, D., Manning, M., Chen, Z., Marquis, M., Averyt, K. B., Tignor, M., and Miller, H. L., Cambridge University Press, Cam-bridge, United Kingdom and New York, NY, USA, 2007. Johanson, C. M. and Fu, Q.: Hadley Cell Widening: Model
Simula-tions versus ObservaSimula-tions, J. Climate, 22, 2713–2725, 2009. Kamae, Y., Ueda, H., and Kitoh, A.: Hadley and Walker
Circula-tions in the Mid-Pliocene Warm Period Simulated by an Atmo-spheric General Circulation Model, J. Meteor. Soc. Jpn., 89, 475– 493, 2011.
Knutson, T. R. and Manabe, S.: Time-Mean Response over the Tropical Pacific to Increased 10 CO2 in a Coupled
Ocean-Atmosphere Model, J. Climate, 8, 2181–2199, 1995.
Knutson, T. R., Delworth, T. L., Dixon, K. W., Held, I. M., Lu, J., Ramaswamy, V., Schwarzkopf, M. D., Stenchikov, G., and Stouf-fer, R. J.: Assessment of Twentieth-Century Regional Surface Temperature Trends Using the GFDL CM2 Coupled Models, J. Climate, 19, 1624–1651, 2006.
Krantz, D. E.: A chronology of Pliocene sea-level fluctuations: The U.S. Middle Atlantic Coastal Plain record, Quaternary Sci. Rev., 10, 163–174, 1991.
Krinner, G., Viovy, N., de Noblet-Ducoudr´e, N., Og´ee, J., Polcher, J., Friedlingstein, P., Ciais, P., Sitch, S., and Prentice, I. C.: A dynamic global vegetation model for stud-ies of the cou-pled atmosphere-biosphere system, Global Biogeochem. Cy., 19, GB1015, doi:10.1029/2003GB002199, 2005.
Lu, J., Vecchi, G. A., and Reichler, T.: Expansion of the Hadley cell under global warming, Geophys. Res. Lett., 34, L06805, doi:10.1029/2006GL028443, 2007.
Madec, G: NEMO ocean engine, note du Pole de modelisation, In-stitut Pierre-Simon Laplace (IPSL), 2008.
Marti, O., Braconnot, P., Dufresne, J. L., Bellier, J., Benshila, R., Bony, S., Brockmann, P., Cadule, P., Caubel, A., Codron, F., No-blet, N., Denvil, S., Fairhead, L., Fichefet, T., Foujols, M. A., Friedlingstein, P., Goosse, H., Grandpeix, J. Y., Guilyardi, E., Hourdin, F., Idelkadi, A., Kageyama, M., Krinner, G., L´evy, C., Madec, G., Mignot, J., Musat, I., Swingedouw, D., and Talandier, C.: Key features of the IPSL ocean atmosphere model and its sen-sitivity to atmospheric resolution, Clim. Dynam., 34, 1–26, 2010. Masson-Delmotte, V., Kageyama, M., Braconnot, P., Charbit, S., Krinner, G., Ritz, C., Guil-yardi, E., Jouzel, J., Abe-Ouchi, A., Crucifix, M., Gladstone, R. M., Hewitt, C. D., Kitoh, A., LeGrande, A. N., Marti, O., Merkel, U., Motoi, T., Ohgaito, R., Otto-Bliesner, B., Peltier, W. R., Ross, I., Valdes, P. J., Vettoretti, G., Weber, S. L., Wolk, F., and Yu, Y.: Past and future polar amplification of climate change: climate model intercomparisons and ice-core constraints, Clim. Dynam., 26, 513–529, 2006. Miller, K. G., Wright, J. D., Browning, J. V., Kulpecz, A., Kominz,
M., Naish, T. R., Cramer, B. S., Rosenthal, Y., Peltier, W. R., and Sosdian, S.: High tide of the warm Pliocene: Implications of global sea level for Antarctic deglaciation, Geology, 29, 1679– 1715, 2012.
Oort, A. H. and Yienger, J. J.: Observed Interannual Variability in the Hadley Circulation and Its Connection to ENSO, J. Climate, 9, 2751–2767, 1996.
Power, S. B. and Smith, I. N.: Weakening of the Walker Circula-tion and apparent dominance of El Ni˜no both reach record levels, but has ENSO really changed?, Geophys. Res. Lett., 34, L18702, doi:10.1029/2007GL030854, 2007.
Power, S. B., Casey, T., Folland, C., Colman, A., and Mehta, V.: Inter-decadal modula-tion of the impact of ENSO on Australia, Clim. Dynam., 15, 319–324, doi:10.1130/1052-5173(2006)016<4:EFENLC>2.0.CO;2, 1999.
Quan, X. W., Diaz, H. F., and Hoerling, M. P.: Changes in the trop-ical Hadley cell since 1950, in: Hadley Circulation: Present, Past and Future, edited by: Dias, H. F. and Bradley, R. S., Amsterdam: Springer, 85–120, 2004.
Ramstein, G., Serafini-Le Treut, Y., Le Treut, H., Forichon, M., and Joussaume, S.: Cloud pro-cesses associated with past and future climate changes, Clim. Dynam., 14, 233–247, 1998.
Ravelo, A. C., Dekens, P. S., and McCarthy, M.: Evidence for El Ni˜no-like conditions during the Pliocene, GSA Today, 16, 4–11, 2006.
Rayner, N. A., Parker, D. E., Horton, E. B., Folland, C. K., Alexan-der, L. V., Rowell, D. P., Kent, E. C., and Kaplan, A.: Global analyses of sea surface temperature, sea ice, and night marine air temperature since the late nineteenth century, J. Geophys. Res. 108, 4407, doi:10.1029/2002JD002670, 2003.
Ropelewski, C. F. and Halpert, M. S.: Precipitation Patterns Asso-ciated with the High Index Phase of the Southern Oscillation, J. Climate, 2, 268–284, 1989.
Salzmann, U., Haywood, A. M., Lunt, D. J., Valdes, P. J., and Hill, D. J.: A new global biome reconstruction and data-model comparison for the Middle Pliocene, Global Ecol. Biogeogr., 17, 432–447, 2008.
Salzmann, U., Williams, M., Haywood, A. M., Johnson, A. L., Kender, S., and Zalasiewicz, J.: Climate and environment of a Pliocene warm world, Palaeogeogr. Palaeoclim., 309, 1–8, 2011. Sohl, L. E., Chandler, M. A., Schmunk, R. B., Mankoff, K., Jonas, J. A., Foley, K. M., and Dowsett, H. J.: PRISM3/GISS topographic reconstruction, US Geol. Surv. Data Series, 419, 6 pp., 2009. Sohn, B. J., Yeh, S.-W., Schmetz, J., and Song, H.-J.: Observational
evidences of Walker cir-culation change over the last 30 years contrasting with GCM results, Clim. Dynam, 40, 1721–1732, doi:10.1007/s00382-012-1484-z, 2013.
Sun, Y., Zhou, T., and Zhang, L.: Observational analysis and numer-ical simulation of the inter-annual variability of the boreal winter Hadley circulation over the recent 30 years, Sci. China Earth Sci., 56, 647–661, doi:10.1007/s11430-012-4497-x, 2012.
Tanaka, H. L., Ishizaki, N., and Kitoh, A.: Trend and interannual variability of Walker, monsoon 10 and Hadley circulations de-fined by velocity potential in the upper troposphere, Tellus A, 56, 250–269, 2004.
Thompson, R. S. and Fleming, R. F.: Middle Pliocene vegetation: reconstructions, paleoclimatic inferences, and boundary condi-tions for climate modeling, Mar. Micropaleontol., 27, 27–49, 1996.
Trenberth, K. E. and Hoar, T. J.: El Ni˜no and climate change, Geo-phys. Res. Lett., 24, 3057–3060, 1997.
Valcke, S: OASIS3 user guide (prism 2–5), technical report TR/CMGC/06/73, PRISM Report No 2. CERFACS, Toulouse, 60 pp., 2006.
Vecchi, G. A. and Soden, B. J.: Global Warming and the Weakening of the Tropical Circulation, J. Climate, 20, 4316–4340, 2007. Vecchi, G. A., Soden, B. J., Wittenberg, A. T., Held, I. M.,
Leet-maa, A., and Harrison, M. J.: Weakening of tropical Pacific at-mospheric circulation due to anthropogenic forcing, Nature, 441, 73–76, 2006.
Walker, G. T. and Bliss, E. W.: World Weather V. Memo, Roy. Me-teor. Soc., 4, 53–84, 1932.
Walker, G. T. and Bliss, E. W.: World Weather VI. Memo., Roy. Meteor. Soc., 4, 119–139, 1937.
Wara, M. W., Ravelo, A. C., and Delaney, M. L.: Permanent El Ni˜no-Like Conditions During the Pliocene Warm Period, Sci-ence, 309, 758–761, 2005.
Webster, J. P.: The elementary Hadley circulaiton, in: Hadley Cir-culation: Present, Past and Future, edited by: Dias, H. F. and Bradley, R. S., Amsterdam: Springer, 9–60, 2004.
Yan, Q., Zhang, Z.-S., and Gao,Y.-Q.: An East Asian monsoon in the mid-Pliocene, Atmos. Ocean. Sci. Lett., 5, 449–454, 2012. Zhang, R., Yan, Q., Zhang, Z. S., Jiang, D., Otto-Bliesner, B.