Article
J. Braz. Chem. Soc., Vol. 26, No. 9, 1879-1886, 2015. Printed in Brazil - ©2015 Sociedade Brasileira de Química 0103 - 5053 $6.00+0.00
A
*e-mail: [email protected]
Contributions on the Use of Bismuth as Internal Standard for Lead Determinations
Using ICP-Based Techniques
Marcos A. Bechlin,a Edilene C. Ferreira,a José A. Gomes Neto,*,a Juliano C. Ramosb and
Daniel L. G. Borgesb
aDepartamento de Química Analítica, Universidade Estadual Paulista (UNESP),
Rua Prof. Francisco Degni, 55, Quitandinha, 14800-060 Araraquara-SP, Brazil
bDepartamento de Química, Universidade Federal de Santa Catarina (UFSC),
Campus Trindade, 88040-900 Florianópolis-SC, Brazil
Bismuth was evaluated as internal standard for Pb determinations and showed usefulness to minimize variations due to changes in the experimental conditions of the inductively coupled plasma optical emission spectrometry (ICP OES), inductively coupled plasma mass spectrometry (ICP-MS) and electrothermal vaporization inductively coupled plasma mass spectrometry (ETV-ICP-MS). Thirty four samples were analyzed and the Pb contents obtained by ICP-MS and ETV-ICP-MS were in agreement at 95% confidence level. Plant, biological tissue and soil reference materials were also analyzed and the results were close to certified values upon the use of the internal standard. Recoveries for Pb spikes (ICP OES: 95-110%; ICP-MS: 95-106%; ETV-ICP-MS: 92-119%) were better than those obtained with external calibration (ICP OES: 56-91%; ICP-MS: 36-136%; ETV-ICP-MS: 5-123%). The relative standard deviations (n = 12) was improved from 1-9% to 0.2-6% (ICP OES), from 0.5-11% to 0.1-7% (ICP-MS) and from 0.4-7% to 0.1-4% (ETV-ICP-MS) by using external and internal standard calibrations, respectively.
Keywords:lead determination, Bi internal standard, ICP OES, ICP-MS, ETV-ICP-MS
Introduction
Internal standard (IS) technique is a simple, effective and well-established calibration method to compensate for
a wide range of interferences, as matrix effects.1 After the
first proposal of IS in flame emission spectrometry,2 it has
been currently used with inductively coupled plasma mass
spectrometry (ICP-MS)3 and inductively coupled plasma
optical emission spectrometry (ICP OES).4
The effectiveness of using IS on analytical accuracy and precision depends on the choice of an adequate internal standard. According to the literature, some parameters are important to select an internal standard for ICP-based techniques. For ICP OES, the main criteria are similar excitation energies for IS and analyte, appropriated plasma operation conditions (radio-frequency power and nebulizer gas flow rate), absence of spectral interferences between analyte and IS emission lines and absence of the IS in the
sample.5-7 In ICP-MS, the selection parameters for the IS
are: atomic weight, ionization energy closely of the analyte
and absence of isotopes of IS in the sample.8-10
Usually, some elements are used as internal standards for a wide range of analytes in ICP OES (Y and Sc) and
ICP-MS (103Rh and 115In), and generally improvements are
observed in the results. These internal standards commonly used present physicochemical properties similar to some analytes, however, not follow the same behavior of all studied elements presenting results not so satisfactory. However, with using an “ideal internal standard” better
accuracy and precision will be obtained.9
Thus, the evaluation and application of one element for the determination of a specific analyte is interesting for improvement of the results obtained in determinations at complex matrices. Bismuth was recently evaluated as a general internal standard for Pb in atomic absorption
spectrometry for wide range of applications.11 Reports on
the use of Bi internal standard for Pb determinations by
ICP-MS12-14 and ICP OES15 are found for some matrices
including maple syrup,12 residual oil,13 plant materials14 and
biological tissues.15 Analysis of these papers and elemental
standard for Pb for general applications in ICP-based techniques.
To further confirm that hypothesis, in this work the performance of Bi as internal standard for Pb determinations was evaluated and assessed by analyzing assorted samples that cause different kinds of matrix effects by ICP OES, ICP-MS and ETV-ICP-MS.
Experimental
Instrumentation
A Varian Vista AX inductively coupled plasma optical emission spectrometer (Mulgrave, Australia) with plasma axial viewing equipped with a 40 MHz radiofrequency generator, an echelle polychromator with a spectral window range of 167 nm to 785 nm and a simultaneous CCD solid-state detector was employed for emission measurements. A Meinhard concentric nebulizer (Meinhard, Santa Ana, USA) and a Sturman-Masters spray chamber (Varian, Mulgrave, Australia) were used for sample introduction. An end-on gas interface was used to remove the tail of the plasma and reduce interferences by recombination and self-absorption processes. All measurements (n = 3) for Bi and Pb were carried out at 223.061 nm (I) and 217.000 nm (I), respectively, been these wavelengths selected due to the similarity in excitation energies. The integration time of the analytical signals was
of 1.0 s with sampling flow rate of 1.0 mL min−1, other
operating parameters are summarized in Table 1.
A Perkin Elmer NexION 300X inductively coupled plasma mass spectrometer (Waltham, USA) was used for ICP-MS measurements. A Meinhard concentric nebulizer (Meinhard, Santa Ana, USA) and a quartz cyclonic spray chamber (Perkin Elmer, Waltham, USA) were used for sample introduction. Measurements (n = 3) of the isotopes
208Pb and 209Bi were carried at peak hopping mode with a
dwell time of 25 ms, other operating parameters are shown in Table 1.
A Perkin Elmer Elan 6000 inductively coupled plasma mass spectrometer (Thornhill, Canada) coupled to a HGA 600 MS electrothermal vaporization system equipped with an AS-60 autosampler was used for ETV-ICP-MS measurements. The ETV was coupled to the ICP-MS by means of a 125-cm length and 0.5-cm internal diameter polytetrafluoroethylene tubing. Longitudinal-heating pyrolytically-coated graphite tubes were used throughout
the work. All measurements (n = 3) of isotopes 208Pb and
209Bi were carried out using peak hopping mode with a
dwell time of 25 ms. The following four steps heating program of the graphite tube was used through the work
(temperature, °C; ramp time, s; hold time, s): dry step (130; 15; 30); argon-assisted pyrolysis step (500; 10; 10); vaporization step (2200; 1; 9); cleaning step (2600; 1; 1).
Argon flow rate was fixed at 300 mL min−1 for all steps.
Other operating parameters are described in Table 1.
Microwave-assisted acid digestion of samples and certified reference materials (CRM) were carried out employing an Anton Paar Multiwave microwave oven (Graz, Austria) equipped with 25-mL quartz vessels and an Anton Paar Multiwave 3000 microwave oven (Graz, Austria) equipped with 15-mL PTFE vessels.
Reagents and analytical solutions
High-purity water obtained from a Millipore Rios 5®
reverse osmosis and a Millipore Milli-Q™ Academic®
deionizer system (resistivity 18.2 MΩ cm, Millipore, USA)
was used to prepare all solutions. Suprapur™ (Merck, Germany) nitric acid and hydrochloric acid were also used to prepare solutions and/or samples. A 30% (m/v) hydrogen peroxide (Merck, Germany) was employed for sample preparation.
Single stock standard solutions containing 1000 mg L−1
Pb and Bi (Merck, Germany) were properly diluted in order to daily prepare working standard solutions in the following
concentration ranges: 5.0-500 µg L−1 Pb spiked with
200 µg L−1 Bi (ICP OES); 0.05-10 µg L−1 Pb spiked with
1.0 µg L−1 Bi (ICP-MS) and 0.5-50 µg L−1 Pb spiked with
10 µg L−1 Bi (ETV-ICP-MS). Blanks, working solutions
and samples were acidified to 2.0% (v/v) HNO3.
Influence of variation of radio-frequency power and nebulizer gas flow rate on Pb signals was studied using
100 µg L−1 Pb + 200 µg L−1 Bi (ICP OES), 1.0 µg L−1 Pb
and Bi (ICP-MS) and 10 µg L−1 Pb and Bi (ETV-ICP-MS).
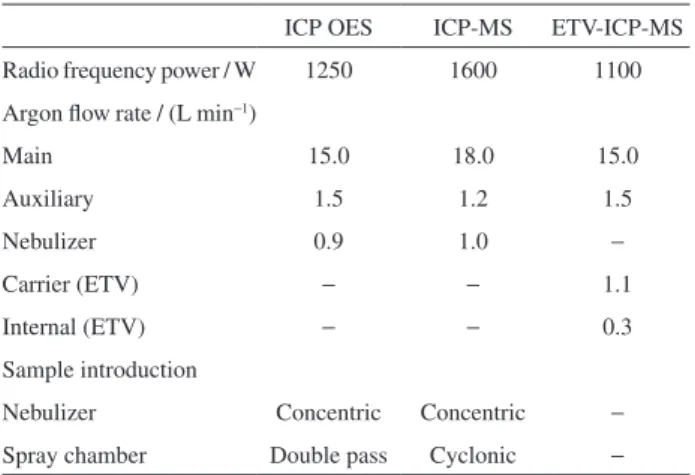
Table 1. Operating parameters for Bi and Pb measurements by ICP OES, ICP-MS and ETV-ICP-MS
ICP OES ICP-MS ETV-ICP-MS
Radio frequency power / W 1250 1600 1100
Argon flow rate / (L min−1)
Main 15.0 18.0 15.0
Auxiliary 1.5 1.2 1.5
Nebulizer 0.9 1.0 −
Carrier (ETV) − − 1.1
Internal (ETV) − − 0.3
Sample introduction
Nebulizer Concentric Concentric −
The latter solution was also employed to assess the thermochemical behavior of Pb and Bi in ETV-ICP-MS.
A 1000 mg L−1 Pd(NO
3)2 stock solution (Fluka GmbH,
Switzerland) was used as conventional chemical modifier and carrier in ETV-ICP-MS measurements.
All solutions were stored in high-density polypropylene bottles (Nalgene, USA). Cleaned plastic bottles and glassware were obtained by soaking them in 10% (v/v)
HNO3 for at least 24 h followed by rinsing abundantly in
deionized water before use.
Procedure
Sample preparation
Thirty four assorted samples (household cleaning solutions, colored sugars, hard candies, mouthwash, orange, lemon and grape juices, energy drink, tea drink, soft drinks, beer, vodka; sugar cane spirit, mineral water, vinegar, ethanol fuels, peanut, polyethylene terephthalate
(PET) bottle, Maytenus ilicifolia, Peumus boldus, liquid
fertilizer, solid fertilizer, shampoo, milk) were acquired at the local market of Araraquara city (São Paulo, Brazil). Ethanol fuels, sugar cane spirit, vodka, beer, fruit juices, energy drink, tea drink, soft drinks, water and vinegar were diluted 1:1 (ETV-ICP-MS), 1:100 (ICP OES) and 1:200
(ICP-MS) with 2% (v/v) HNO3. Colored sugars, hard
candies and household cleaning samples were digested according to the following procedure: 0.25 g of sample was accurately weighed and transferred to a microwave flask. Aliquots of 3.0 mL of concentrated nitric acid, 2.0 mL
of H2O2 and 1.0 mL of deionized water were then added
and the mixture was submitted to the following optimized
3-step microwave-assisted digestion program: (i) 15 min
from 0 to 600 W; (ii) 20 min at 1400 W and (iii) 20 min
at 0 W (ventilation). After digestion and cooling, the resulting solutions were transferred to 25-mL volumetric flasks and the volumes were made up to the mark using distilled deionized water. Other samples and three CRMs (3246 Ginkgo Biloba, 2976 Mussel Tissue and 2709a San Joaquin Soil) from the National Institute of Standards and Technology (Gaithersburg, USA) were digested according
to the procedure describe elsewhere.11 All samples
and CRMs were prepared in triplicate and spiked with
200 µg L−1 Bi (ICP OES), 1.0 µg L−1 Bi (ICP-MS) and
10 µg L−1 Bi (ETV-ICP-MS).
Analytical procedure
The influences of fluctuations in plasma operating parameters on emission signals in ICP OES were studied by varying the nebulizer gas flow rate and radio frequency power. Measurements were carried out using a solution
containing 100 µg L−1 Pb + 200 µg L−1 Bi and with flow rates
of main and auxiliary gases fixed at 15.0 and 1.5 L min−1,
respectively. First, with the radio frequency (RF) power fixed at 1.25 kW, the nebulizer gas flow rate was varied
between 0.7-1.1 L min−1, after the nebulizer gas flow rate
was fixed at 0.9 L min−1 and the RF power was ranged from
0.9 to 1.25 kW.
For ETV-ICP-MS, the influence of internal and carrier gas flow rates were evaluated by measuring a solution
containing 10 µg L−1 Pb and Bi with the RF power and
main and auxiliary gases flow rates fixed at 1.1 kW, 15.0
and 1.5 L min−1, respectively. The carrier gas flow rate was
varied between 0.6-1.3 L min−1 with the internal gas flow
rate at 300 mL min−1, after the carrier gas flow rate was fixed
at 1.1 L min−1 and the internal gas flow rate was ranged
from 0 to 300 mL min−1. Following, the thermochemical
behaviors of Pb and Bi were evaluated in aqueous solutions,
lemon juice and sugar cane spirit media with 10 µg L−1
of both analytes, acidified to 2.0% (v/v) HNO3, with and
without 2 µg Pd as chemical modifier/carrier.
The determination of Pb in samples and CRMs by studied techniques was carried out using both external calibration (EC) and IS method. For analysis by ICP OES, operating parameters were previously optimized and fixed
at 1.25 kW (RF power) and 0.9 L min−1 for nebulizer gas
flow rate, respectively, which allowed calibration in the
interval of 5.0-500 µg L−1 Pb + 200 µg L−1 Bi. In ICP-MS,
the RF power was fixed at 1.6 kW and the nebulizer gas flow
rate at 1.0 L min−1 with a work range of 0.05-10 µg L−1 Pb +
1.0 µg L−1 Bi. For ETV-ICP-MS, a calibration in the
0.5-50 µg L−1 Pb + 10 µg L−1 Bi range was built up with
instrumental parameters at 1.1 kW (RF power) and flow
rates of 1.1 and 0.3 L min−1 for carrier and internal gases,
respectively. The analysis was carried out employing 2 µg Pd as modifier/carrier and pyrolysis and vaporization temperatures of 500 and 2200 °C, respectively.
An addition/recovery test was carried out to evaluate the accuracy of internal standard method. The samples were
spiked with 100 µg L−1 Pb + 200 µg L−1 Bi (ICP OES),
1.0 µg L−1 Pb + 1.0 µg L−1 Bi (ICP-MS), 10 µg L−1 Pb +
10 µg L−1 Bi (ETV-ICP-MS) and analyzed in the same
conditions of non-spiked samples.
The influence of different sample matrix on Pb and Bi signals was evaluated by means of correlation graphs (Pb
signals versus Bi signals) obtained from spiked samples.
The signals of Pb sample content without spike were adopted as the blank signals and subtracted from the total signal obtained.
International Union of Pure and Applied Chemistry
(IUPAC) recommendation.16
Results and Discussion
Studies on ICP OES
Variations in the plasma operating parameters may alter the temperature and residence time and therefore
cause fluctuations in signal intensities of the analytes.17
The effect of variation of the radio frequency power
(0.9-1.25 kW) and nebulizer gas flow rate (0.7-1.1 L min−1)
on Pb determination by ICP OES was evaluated. The
increase in RF power raises the plasma temperature,18,19
improving the sensitivity for Pb in almost 33% (Figure S1, in the Supplementary Information (SI) section). Bismuth presented similar behavior and its use as an internal standard efficiently minimized the fluctuations in Pb signals. The increase in nebulizer gas flow rate did not alter significantly the Pb and Bi signals. When the nebulizer gas flow rate is increased, larger amounts of sample are inserted in the plasma, which should improve emission intensities. However, this was not observed due to the lower plasma temperatures and shorter residence time of sample
at higher flow rates.17-19 The variation of nebulizer flow
rate from 0.7 to 1.1 L min−1, the Pb and Bi signals reduced
only ca. 4%. Nevertheless, these small variations were minimized employing internal standardization (Figure S2), which reinforced the benefits of using Bi.
The evaluation of RF power and nebulizer gas flow rate studied intervals (Figures S1 and S2) showed better analytical signal and the lowest standard deviation for Bi and Pb at 1.25 kW, that was the condition fixed for further experiments. For nebulizer gas flow rates, the interval
between 0.85 and 0.95 L min−1 presented the smallest
standard deviation in the studied range. The 0.9 L min−1
was chosen for further measurements. Moreover, these conditions were selected to perform the experiments in robust plasma conditions.
After fixed these operational parameters, calibrations
by EC and IS (200 µg L−1 Bi) were built up using standard
solutions in the 5.0-500 µg L−1 Pb range. Internal standard
calibration plots with correlation coefficients better than 0.9992 were consistently obtained. Accuracy was evaluated by analyzing plant, biological and soils CRMs. Results of analysis of CRM by using EC and IS were in agreement with certified values at 95% confidence level
(t-test), although better recoveries were obtained for the
IS calibration method.
Afterwards, thirty four samples were analyzed and the Pb concentrations found were lower than the LOQ
(4.4 µg L−1 Pb). Accuracy was also assessed by addition/
recovery studies by spiking samples with 100 µg L−1 Pb +
200 µg L−1 Bi (Table S1). For comparison purposes,
recoveries for only eighteen samples are shown in Table 3. Recoveries varied from 56.2 to 91.1% (EC) and from 95.5 to 110.3% (IS). The relative standard deviations (n = 12) ranged from 0.8 to 9.0% (EC) and from 0.2 to 5.8% (IS).
Correlation graph between Pb and Bi signals measured for thirty-four spiked samples was built up and is shown in Figure 1. Data refers to net integrated emission signals correlated only with spikes, or else, any signal generated
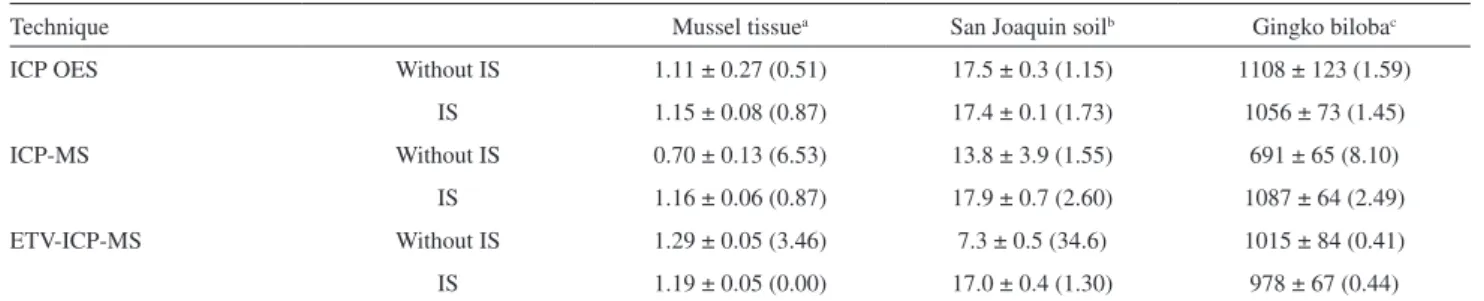
Table 2. Results (mean ± SD) for Pb determination in CRMs by ICP OES, ICP-MS and ETV-ICP-MS (n= 3). In parenthesis are shown the results for t-test (t = 4.30, at 95% confidence level)
Technique Mussel tissuea San Joaquin soilb Gingko bilobac
ICP OES Without IS 1.11 ± 0.27 (0.51) 17.5 ± 0.3 (1.15) 1108 ± 123 (1.59)
IS 1.15 ± 0.08 (0.87) 17.4 ± 0.1 (1.73) 1056 ± 73 (1.45)
ICP-MS Without IS 0.70 ± 0.13 (6.53) 13.8 ± 3.9 (1.55) 691 ± 65 (8.10)
IS 1.16 ± 0.06 (0.87) 17.9 ± 0.7 (2.60) 1087 ± 64 (2.49)
ETV-ICP-MS Without IS 1.29 ± 0.05 (3.46) 7.3 ± 0.5 (34.6) 1015 ± 84 (0.41)
IS 1.19 ± 0.05 (0.00) 17.0 ± 0.4 (1.30) 978 ± 67 (0.44)
aCertified value: 1.19 ± 0.18 µg g−1; bcertified value: 17.3 ± 0.1 µg g−1; ccertified value: 995 ± 30 ng g−1; IS: internal standard.
by the original concentrations of Pb and Bi in samples was considered as blank.
Different matrices caused significant fluctuations in emission signals mainly due to the physicochemical
properties of analyzed samples (e.g., viscosity, superficial
tension), which may affect the aerosol characteristics and consequently their efficiency of generation and transport, reducing or enhancing the measured signals. Besides, many processes that may alter emission intensities take place at the plasma due to concomitant elements from the matrix affecting the mechanisms of atomization, excitation and
ionization of analyte.17,20
The signals of Pb and Bi presents a correlation of 0.968, a statistical F test was applied to verify that considering the experimental error the correlation coefficient is equal to 1, the results confirmed this hypothesis. The great correlation between signals means that alterations in aerosol transport, plasma conditions and atom generation and excitation, affect similarly Bi and Pb. These elements present close enthalpy
of vaporization (Bi: 151 kJ mol−1; Pb: 179.5 kJ mol−1) and
excitation energies (Bi: 5.55 eV; Pb: 5.71 eV).21 Moreover,
Bi presents a simple emission spectrum and no interfering line at Pb line. These facts could explain the performance of Bi as internal standard for Pb in ICP-OES.
Studies on ICP-MS
Because ICP-MS is deeply affected by matrix effects due to its relative complexity, elemental determinations
by ICP-MS are commonly carried out using internal
standard calibration.9 The influence of RF power and
nebulizer gas flow rate on the analytical signals were evaluated, however, no significant changes were observed for analyte and IS, similar to observed for ICP OES. Then, robust plasma operating parameters were fixed for further measurements with RF power at 1.6 kW and nebulizer gas
flow rate at 1.0 L min–1. External (0.05-10 µg L−1 Pb) and
IS (0.05-10 µg L−1 Pb + 1.0 µg L−1 Bi) calibrations were
built up and correlation coefficients better than 0.997 were
consistently obtained with a calculated LOQ of 0.02 µg L−1
Pb. These calibrations were employed to analyze different CRMs. Table 2 reveals that recoveries of CRMs for EC ranged between 59 and 80% and only for the soil CRM the obtained value were in agreement with the certified value
at 95% confidence level (t-test). These findings show the
influence of concomitants during the transference of 208Pb
from plasma to the detector.9 The use of IS furnished more
accurate and precise results for all CRMs, with recoveries between 97 and 109% (Table 2), moreover the obtained values were in agreement with the certified value at 95%
confidence level (t-test).
After, thirty four samples were analyzed by ICP-MS (Table S2) and the concentrations found using IS were
in the 0.08-5.19 µg L−1 range. The obtained results were
compared with those determined by ETV-ICP-MS, only twenty samples presented concentrations above of the LOQ of this technique. These values were compared using the
paired t-test and are in agreement at 95% confidence level.
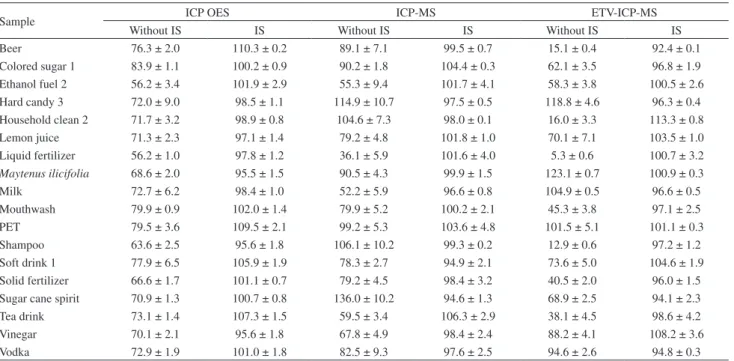
Table 3. Results (mean ± SD, %) of recoveries of Pb in samples obtained by ICP techniques (n = 3)
Sample ICP OES ICP-MS ETV-ICP-MS
Without IS IS Without IS IS Without IS IS
Beer 76.3 ± 2.0 110.3 ± 0.2 89.1 ± 7.1 99.5 ± 0.7 15.1 ± 0.4 92.4 ± 0.1
Colored sugar 1 83.9 ± 1.1 100.2 ± 0.9 90.2 ± 1.8 104.4 ± 0.3 62.1 ± 3.5 96.8 ± 1.9 Ethanol fuel 2 56.2 ± 3.4 101.9 ± 2.9 55.3 ± 9.4 101.7 ± 4.1 58.3 ± 3.8 100.5 ± 2.6 Hard candy 3 72.0 ± 9.0 98.5 ± 1.1 114.9 ± 10.7 97.5 ± 0.5 118.8 ± 4.6 96.3 ± 0.4 Household clean 2 71.7 ± 3.2 98.9 ± 0.8 104.6 ± 7.3 98.0 ± 0.1 16.0 ± 3.3 113.3 ± 0.8 Lemon juice 71.3 ± 2.3 97.1 ± 1.4 79.2 ± 4.8 101.8 ± 1.0 70.1 ± 7.1 103.5 ± 1.0 Liquid fertilizer 56.2 ± 1.0 97.8 ± 1.2 36.1 ± 5.9 101.6 ± 4.0 5.3 ± 0.6 100.7 ± 3.2 Maytenus ilicifolia 68.6 ± 2.0 95.5 ± 1.5 90.5 ± 4.3 99.9 ± 1.5 123.1 ± 0.7 100.9 ± 0.3
Milk 72.7 ± 6.2 98.4 ± 1.0 52.2 ± 5.9 96.6 ± 0.8 104.9 ± 0.5 96.6 ± 0.5
Mouthwash 79.9 ± 0.9 102.0 ± 1.4 79.9 ± 5.2 100.2 ± 2.1 45.3 ± 3.8 97.1 ± 2.5 PET 79.5 ± 3.6 109.5 ± 2.1 99.2 ± 5.3 103.6 ± 4.8 101.5 ± 5.1 101.1 ± 0.3 Shampoo 63.6 ± 2.5 95.6 ± 1.8 106.1 ± 10.2 99.3 ± 0.2 12.9 ± 0.6 97.2 ± 1.2 Soft drink 1 77.9 ± 6.5 105.9 ± 1.9 78.3 ± 2.7 94.9 ± 2.1 73.6 ± 5.0 104.6 ± 1.9 Solid fertilizer 66.6 ± 1.7 101.1 ± 0.7 79.2 ± 4.5 98.4 ± 3.2 40.5 ± 2.0 96.0 ± 1.5 Sugar cane spirit 70.9 ± 1.3 100.7 ± 0.8 136.0 ± 10.2 94.6 ± 1.3 68.9 ± 2.5 94.1 ± 2.3 Tea drink 73.1 ± 1.4 107.3 ± 1.5 59.5 ± 3.4 106.3 ± 2.9 38.1 ± 4.5 98.6 ± 4.2 Vinegar 70.1 ± 2.1 95.6 ± 1.8 67.8 ± 4.9 98.4 ± 2.4 88.2 ± 4.1 108.2 ± 3.6
Vodka 72.9 ± 1.9 101.0 ± 1.8 82.5 ± 9.3 97.6 ± 2.5 94.6 ± 2.6 94.8 ± 0.3
Analysis of Table S2 also reveals the significant effect of miscellaneous sample matrices on accuracy, been the values obtained by EC very different in comparison with those found by IS. To evaluate the accuracy of IS method addition/recovery studies were carried out. Data for eighteen samples are presented in Table 3 and recoveries obtained for all samples are shown in Table S3.
The recoveries were within the 36-136% for EC and 95-106% for IS. The RSD (n = 12) improved from 0.5-11.3% (EC) to 0.1-6.6% (IS). Several effects may
explain variations in Pb and Bi signals such as (i) increased
atom collisions and analyte ionization; (ii) the presence
of easily-ionized elements which increases the electron density of plasma, reducing the ionization of elements
and (iii) the presence oxide-forming elements can settle at
sampler and skimmer cones hindering the ion sampling.22-25
These effects can explain divergences observed between EC and IS for Pb concentrations.
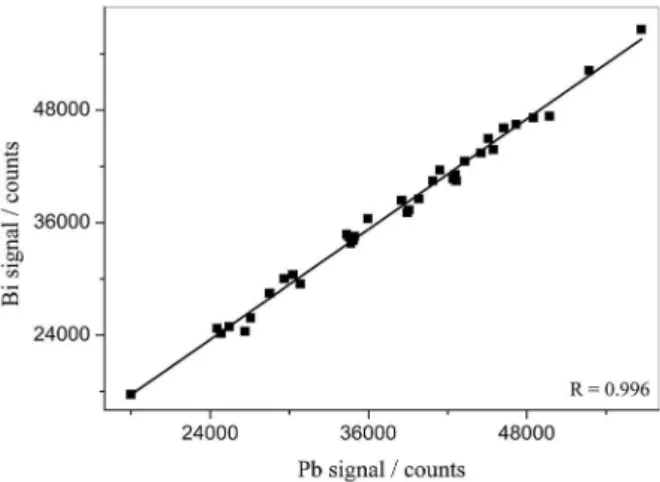
However, a good correlation (0.996) was obtained between Bi and Pb signals (Figure 2) and confirmed by F-test, which establishes a good similarity in the behaviors of Pb and Bi in relation to the sample matrix variations. Similarities between atomic masses for Bi (208.980 amu) and Pb (207.977 amu), and ionization energy (Bi: 7.28 eV;
Pb: 7.41 eV)21 make Bi a suitable internal standard for Pb
in ICP-MS.
Studies on ETV-ICP-MS
The ETV-ICP-MS is a powerful hyphenated technique
for direct analysis of complex samples, including solids.26
However, it is not surprising that coupling is susceptible to interferences typically associated with graphite furnace reactor and ICP-MS, and transport efficiency is frequently referred to as a key aspect that defines the success of
quantitative analysis using ETV.27
The RF power was fixed at 1.1 kW for all measurements. The carrier and internal gas flow rate were optimized to improve the transport of Pb atoms from the ETV to the ICP. First, the carrier gas flow rate was fixed at
1.1 L min−1, while the internal gas flow rate was varied
from 0 to 300 mL min−1. Both Bi and Pb signals increased
consistently with increasing flow rates (Figure S3). When
the flow rate reached 300 mL min−1, signals improved
ca. 82%. Then, the carrier gas flow rate was varied from
0.6 to 1.3 L min−1 (Figure S4), and Bi and Pb signals
increased similarly. Considering that the best sensitivity was obtained for internal and carrier gas flow rates fixed at
0.3 L min−1 and 1.1 L min−1, respectively, these flow rates
were then fixed for further experiments.
Afterwards, the thermochemical behaviors of Bi and Pb in different media (aqueous solution, sugar cane spirit and lemon juice) were evaluated with and without 2.0 µg Pd as modifier/carrier by means of pyrolysis (300-1200 °C) and vaporization (1200-2500 °C) temperature curves (Figure S5). When no modifier was used, Bi and Pb presented similar behavior only for the aqueous medium. On the contrary, different behaviors were observed in the presence of samples since some species from matrices (e.g., Na, Cl, K) acting as
a carrier28,29 may transport Pb and Bi not similarly.
Palladium improved the transport of Pb and Bi from ETV to ICP, and provided stabilization of both analytes at higher pyrolysis and vaporization temperatures. Lead and Bi were stabilized up to 600 °C, but the selected pyrolysis temperature was 500 °C considering the lower RSD. Suitable transient peak profiles, precision and sensitivity were obtained at 2200 °C vaporization temperature for all media. The similarities between Bi and Pb in terms of thermochemical behaviors and transport efficiencies to the plasma were achieved by using Pd modifier.
Using the optimized instrumental conditions and
heating program, calibration curves (0.5-50 µg L−1 Pb) were
build up using EC and IS. Correlation coefficient better than 0.9993 were typically obtained for IS calibration with
calculated LOQ of 0.3 µg L−1 Pb. Accuracy was checked by
analysis of CRMs (Table 2), for EC only the concentration obtained for the soil CRM was not in agreement with the
certified value at 95% confidence level (t-test). Better
results were observed for IS calibration, in this condition, the values for Pb determination in CRMs were in agreement
with certified values at 95% confidence level (t-test),
revealing once again the potential of Bi as an internal standard for Pb determination in ICP-based techniques.
Samples were then analyzed by ETV-ICP-MS and the Pb contents were below the LOQ for fourteen samples and
varied from 0.32-4.90 µg L−1 Pb (IS) in the other samples.
In general, Pb levels (mean values) found by EC did not
agree with those obtained with IS (Table S2). However, the results obtained by ETV-ICP-MS were in agreement
at 95% confidence level (paired t-test), with those obtained
by ICP-MS using a pneumatic nebulizer.
The influence of matrix on Bi and Pb signals was studied by analysis of thirty four samples spiked with
10 µg L−1 Pb + 10 µg L−1 Bi (Table S4). Recoveries were in
the 5.3-123% (EC) and 92.4- 119% (IS) ranges. The RSD (n = 12) improved from 0.4-7.1% (EC) to 0.1-4.2% (IS).
The transport of atoms from the electrothermal vaporizer to the plasma is a crucial step, for which the matrix effects are more pronounced. The transport of analyte is made by the formation of a cluster which is
carried by the argon flow to the plasma.30 Concomitants of
samples may act as analyte carriers, affecting the signals positively or negatively. A noteworthy depreciative effect (low recovery) was observed for samples presenting high-salt contents (e.g., liquid fertilizer), suggesting that the selection of the same pyrolysis temperature (heating program) for diverse samples is difficult, however, these effects can be minimized by the IS calibration.
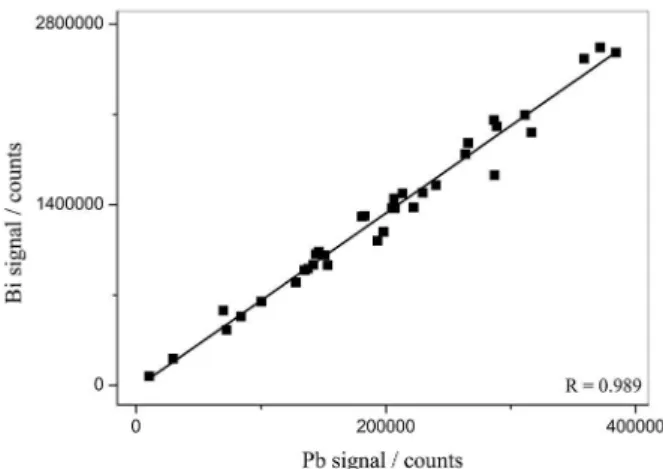
Measurements from addition/recovery studies were employed to illustrate influence of matrices on Bi and Pb signals and to generate the correlation graph depicted in Figure 3. The good correlation (0.989) obtained and evaluated by F test, between Bi and Pb may be attributed to their close enthalpy of vaporization, dissociation energy of oxides and chlorides (favoring similar vaporization mechanism), atomic masses (favoring similar transport efficiency) and ionization energy (favoring similar degree
of ionization).21,26
Conclusions
The selection of Bi as unique internal standard for analysis of assorted samples that cause different kinds
of matrix effects on Pb determinations by ICP-based techniques is remarkable and very useful from the practical point of view. Improved determinations of Pb by ICP OES, ICP-MS and ETV-ICP-MS employing Bi as general internal standard were demonstrated here. The effectiveness of Bi as internal standard for Pb is due to the similarity of their behaviors because of the closeness of the physicochemical properties of both elements.
Supplementary Information
Some Figures (S1-S5) and Tables (S1-S4) containing relevant results are available free of charge at http://jbcs. sbq.org.br as PDF file.
Acknowledgements
The authors would like to thank FAPESP (grant 2012/13500-9), FAPESC (grant 11.344/2012-1) and Conselho Nacional de Desenvolvimento Científico e Tecnológico (CNPq, grant 471453/2013-7) for fellowship to M. A. B. and J. C. R. and researchships to D. L. G. B. and J. A. G. N.
References
1. Skoog, D. A.; West, D. M.; Holler, F. J.; Fundamentals of Analytical Chemistry, 7th ed.; Saunders College: Fort Worth,
1996.
2. Gerlach, W.; Schweitezer, E.; Foundations and Methods of Chemical Analysis by Emission Spectrometry, 1st ed.; Adam
Hilger: London, 1929.
3. Nguyen, T. K. D.; Ludwig, R.; Anal. Sci.2014, 30, 1089. 4. Scheffler, G. L.; Pozebon, D.; Anal. Methods2013, 5, 4371.
5. Barnett, W. B.; Fassel, V. A.; Kniseley, R. N.; Spectrochim. Acta, Part B1968, 23, 643.
6. Myers, S. A.; Tracy, D. H.; Spectrochim. Acta, Part B1983, 38, 1227.
7. Wallace, G. F.; At. Spectrosc.1984, 5, 5.
8. Vanhaecke, F.; Vanhoe, H.; Dams, R.; Vandecasteele, C.; Talanta
1992, 39, 737.
9. Finley-Jones, H. J.; Molloy, J. L.; Holcombe, J. A.; J. Anal. At. Spectrom.2008, 23, 1214.
10. Thompson, J. J.; Houk, R. S.; Appl. Spectrosc.1987, 41, 801. 11. Bechlin, M. A.; Fortunato, F. M.; Ferreira, E. C.; Gomes Neto,
J. A.; Nóbrega, J. A.; Donati, G. L.; Jones, B. T.; Anal. Chim. Acta2014, 831, 24.
12. Bhandari, S. A.; Amarasiriwaderna, D.; Microchem. J.2000, 64, 73.
13. Xie, H.; Huang, K.; Liu, J.; Nie, X.; Fu, L.; Anal. Bioanal. Chem.2009, 393, 2075.
14. Koplic, R.; Curdová, E.; Suchánek, M.; Fresenius’ J. Anal. Chem.1998, 360, 449.
15. http://www.fsis.usda.gov/wps/wcm/connect/b9a63ea1-cae9-423b-b200-36a47079ae49/CLG-TM3.pdf?MOD=AJPERES accessed in June, 2015.
16. Currie, L. A.; Anal. Chim. Acta1999, 391, 105.
17. Todolí, J. L.; Gras, L.; Hernandis, V.; Mora, J.; J. Anal. At. Spectrom.2002, 17, 142.
18. Iglésias, M.; Vaculovic, T.; Studynkova, J.; Poussel, E.; Mermet, J. M.; Spectrochim. Acta, Part B2004, 59, 1841.
19. Romero, X.; Poussel, E.; Mermet, J. M.; Spectrochim. Acta, Part B1997, 52, 487.
20. Vogiatzis, C.; Zachariadis, G.; J. Anal. At. Spectrom.2011, 26, 2030.
21. Lide, D. R.; CRC Handbook of Chemistry and Physics, 88th ed.; CRC Press: Boca Raton, 2007.
22. Agatemor, C.; Beauchemin, D.; Anal. Chim. Acta2011, 706, 66.
23. Vandecasteele, C.; Nagels, M.; Vanhoe, H.; Dams, R.; Anal. Chim. Acta1988, 211, 91.
24. Tan, S. H.; Horlick, G.; J. Anal. At. Spectrom.1987, 2, 745. 25. Evans, E. H.; Giglio, J. J.; J. Anal. At. Spectrom.1993, 8, 1. 26. Aramendía, M.; Resano, M.; Vanhaecke, F.; Anal. Chim. Acta
2009, 648, 23.
27. Kántor, T.; Spectrochim. Acta, Part B2001, 56, 1523. 28. Ediger, R. D.; Beres, S. A.; Spectrochim. Acta, Part B1992, 47,
907.
29. Grégoire, D. C.; Al-Maawali, S.; Chakrabarti, C. L.; Spectrochim. Acta, Part B1992, 47, 1123.
30. Hu, B.; Li, S.; Xiang, G.; He, M.; Jiang, Z.; Appl. Spectrosc. Rev.2007, 42, 203.
Submitted: May 4, 2015
Published online: July 3, 2015