Ar
ti
cle
0103 - 5053 $6.00+0.00
*e-mail: [email protected]
Study on the Interaction between Doxorubicin and Deoxyribonucleic Acid
with the use of Methylene Blue as a Probe
Reza Hajian,* Nafiseh Shams and Majid Mohagheghian
College of Science, Chemistry Department, Islamic Azad University Branch of Gachsaran, Gachsaran, 75818-63876, Iran
Neste trabalho, a interação de doxorrubicina com DNA (obtido de timo de bezerro) em ita dupla foi investigada através de técnicas de espectrofotometria UV-Vis, voltametria e espectroluorometria, usando azul de metrileno (MB) como marcador. O comportamento voltamétrico da doxorrubicina foi investigado em eletrodo de carbono vítreo usando voltametria de pulso diferencial. A doxorrubicina é reduzida, produzindo um pico de redução. Os dois estudos, espectrofotometria UV-Vis e voltametria de pulso diferencial, conirmam a reação de intercalação. Os resultados mostraram que a doxorrubicina e a molécula de MB foram intercaladas na dupla hélice do DNA. A constante de ligação aparente de doxorrubicina com DNA foi 3,2 × 10⁴ L mol-1. O sinal de
luorescência da doxorrubicina e azul de metileno é suprimido com a adição de DNA. A equação de Stern-Volmer baseou-se na supressão do sinal de luorescência da doxorrubicina.
In this work, the interaction of doxorubicin with calf thymus double strand Deoxyribonucleic acid (ds-DNA) has been investigated with the use of Methylene Blue (MB) dye as a probe by the application of UV-Vis spectrophotometry, voltammetry and spectroluorometry. The voltammetric behavior of doxorubicin has been investigated at glassy carbon electrode using differential pulse voltammetry. Doxorubicin is reduced, yielding one reduction peak. Both UV-Vis spectrophotometry and differential pulse voltammetry studies conirm the intercalation reaction. The results showed that both doxorubicin and the MB molecule could intercalate into the double helix of the DNA. The apparent binding constant of doxorubicin with DNA has been found to be 3.2 × 10⁴ L mol-1.
The luorescence signal of doxorubicin and methylene blue was quenched with DNA addition. The Stern-Volmer equation was plotted based on quenching luorescence signal of doxorubicin.
Keywords: doxorubicin, DNA, chemotherapy, spectrophotometry, voltammetry, spectroluorometry
Introduction
Study of interactions between drugs and DNA is very interesting and significant not only in understanding the mechanism of interaction, but also for the design of new drugs.1,2 However mechanism of interactions
between drug molecules and DNA is still relatively little known. It is necessary to introduce more simple methods for investigating the mechanism of interaction. By understanding the mechanism of interaction,designing of new DNA-targeted drugs and the screening of these in vitro will be possible.
A great variety of substances, including several agents of importance in cancer chemotherapy,3 are known
to bind to DNA by intercalation.4 Attention has been
concentrated on the classical intercalating drugs, acridines and ethidium bromide.4-6 Studies on the binding of various
dyes, drugs and antibiotics to DNA and chromatin have contributed to the understanding of the structure of these macromolecules,6-14 and have suggested possible
mechanisms of the biological activity of some drugs.3
Molecular models of the intercalation of some drugs into DNA have been described,4 and it is already apparent that
differences in the binding speciicity must be expected.15
Indeed, different intercalating agents produce different effects on DNA.6 It remains to be elucidated if such
differences may inluence their selectivity in drug action. Chemotherapy is an important part of the program for cancer treatment. A lot of compounds are developed as potential candidates for anticancer drugs, but only a handful of them have become effective clinical drugs.16,17
mechanism of the drug action at the cellular and molecular levels be better understood. Many anticancer drugs have been known to interact with DNA to exert their biological activities. Methylene blue (MB, Scheme 1) is a phenothiazinyl dye, which is a kind of photosensitizer drug molecules showing promising applications in the photodynamic therapy (PDT) for anticancer treatment.18-20 Due to its
planar structure, which is similar to acridine dyes, MB can interact easily with DNA and has been used as a stain agent for DNA.21
The interaction of methylene blue with DNA has been studied with various methods.22-26 Most studies have indicated
that at low ionic strength buffer and low concentration of DNA, the major binding mode of MB with DNA is through intercalation.24,27 Moreover, MB has a low toxicity. Data
from material safety data sheet of Vanderbilt Environmental Health & Safety (VEHS) show that MB is slightly hazardous in case of skin contact, eye contact, ingestion, inhalation and no evidence shows that MB is a carcinogenic compound.28
The interaction of doxorubicin (Scheme 2) (the main representative of the anthracycline group of antibiotics) with DNA is of general interest in connection with questions regarding drug-nucleic acid interactions, since its biological activity is thought to reside in the ability to bind to DNA.29According to our knowledge, study on
the interaction between doxorubicin and DNA have been reported by resonance Raman spectroscopy,30 FT-IR,31 and
circular dichromism spectroscopies.32
In this work, the interaction between doxorubicin and calf thymus DNA has been investigated by absorption and luorescence spectroscopies as well as by electrochemical
methods. Because the interaction between MB and DNA is known (intercalation mechanism), we used it as a probe for comparing its behavior against DNA in comparison with doxorubicin. The results showed that doxorubicin, similarly to methylene blue can intercalate into the double helix of DNA. The apparent binding constant of doxorubicin-DNA complex is found to be 3.2 ×10⁴ L mol-1.
The aim of this study is to ind the mode of the interaction between doxorubicin and DNA by using spectroscopy and electrochemical methods. This will help us to design new drugs, which have biological and antitumour activities. The advantages of the proposed method involve simplicity and cheap devices.
Experimental
Reagents
All the chemicals were of analytical grade and have been purchased from Aldrich. Doubly distilled water was used throughout.
Stock solution (3.7 × 10⁻³ mol L-1) of doxorubicin
dissolved in sodium chloride (0.01 mol L-1) was purchased
from Pharmacia Limited, Italy.
A 1.0 × 10⁻³ mol L-1MB solution was prepared by
dissolving 0.0374 g of methylene blue. 3H2O in water and the solution was diluted to 100 mL with water in a 100 mL volumetric lask. The solution was kept in a refrigerator at 4 oC and in darkness. More dilute solutions were prepared
by appropriate dilution with water.
Calf thymus DNA was used without further puriication. Its concentration was determined spectrophotometrically using the molar absorbtivity value, ε
260 = 6600 mol
-1cm-1.25
For making a 1.76 × 10⁻⁴ mol L-1 DNA, 0.010 g of calf
thymus DNA was dissolved in 0.010 mol L-1 phosphate
buffer (pH 7.4) and 0.05 mol L-1 sodium chloride solution
in a 25 mL volumetric lask.
All solutions were adjusted with the phosphate buffer (0.01 mol L-1, pH 7.4) in the presence of 0.05 mol L-1
sodium chloride.
Apparatus
UV-Vis absorption spectra were measured on an Agilent UV-Vis spectrophotometer, Perkin Elmer (Lambda 25), with the use of 1.0 cm quartz cells.
Voltammetric measurements were carried out using an EG&G instrument, Model 394, with three-electrodes containing glassy carbon as a working electrode, a platinum electrode as an auxiliary electrode and a Saturated Calomel Electrode (SCE) as a reference electrode.
Scheme 1. Molecular structure of methylene blue.
All spectrofluorometric assays were made on a spectroluoromrtric, JASCO, equipped with a xenon lamp and a 1.0 cm quartz cell. Both excitation and emission slits were set at 5 nm, and the scan rate at 500 nm min-1.
A Pentium IV (2.0 MHz) computer controlled all of the settings and data processing.
A Mettler MP 225 pH meter with a combined glass electrode was used for pH measurements.
All experiments were carried out at room temperature (25 ± 1 oC) in 0.01 mol L-1 phosphate buffer solution, pH 7.4
containing 0.05 mol L-1 NaCl.
Preparation of the glassy carbon electrode
Before each experiment, glassy carbon (GC) electrode was irst polished to a mirror inish with 0.05-µm alumina polishing suspension (Buehler) and then cleaned sonication in acetone and water, respectively, for 3 min. Then it was transferred into a blank buffer solution (phosphate buffer (0.01 mol L-1, pH 7.4) plus NaCl (0.05 mol L-1)), and a
continuous voltammetric scan (n = 5) with a scan rate of 50 mV s-1 was carried out in the range of 0.0 to +1 V.
Results and Discussion
Spectrophotometric studies
Interaction of doxorubicin with ds-DNA
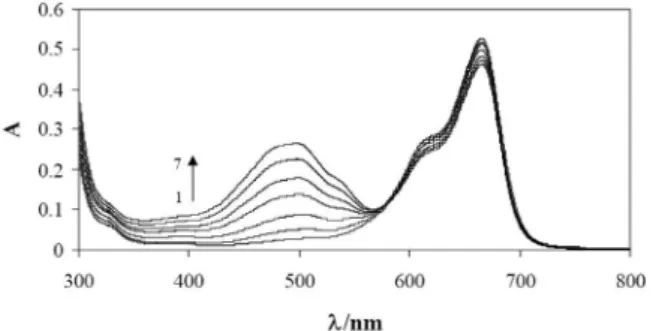
UV-Vis absorption spectra have been obtained by titration of a 1.0 × 10⁻⁵ mol L-1 doxorubicin solution with
increasing concentration of ds-DNA (Figure 1). There is an absorption band at 493.4 nm in the absence of ds-DNA. With the increase of DNA concentration, the absorption band decreases continuously. It is similar to the phenomenon caused by the interaction between DNA and its typical intercalate.26 Based on the variations of absorbance at the
absorption band, the binding constant, K, of complex-DNA can be obtained according to the following equation:33
(1)
Where “A0” and “A” are the absorbance of drug in the absence and presence of DNA, ε
G and εH-G are
their absorption coeficients, respectively. G and H-G represent to drug and drug-DNA species respectively. The result of itting the experimental data with equation 1 is shown in Figure 2. It suggests that the complex of doxorubicin with ds-DNA is relative to a 1:1 complex. From the plot of A0/(A-A0) to 1/[DNA], the ratio of the intercept to the slope gives the binding constant, K = 3.2 (±0.23) × 104 L mol-1 (n = 4).
In order to clarify the presence of interaction between doxorubicin and ds-DNA, the absorption spectra of methylene blue in the presence of ds-DNA was compared with doxorubicin-DNA spectra.
Interaction of MB with ds-DNA
The changes of the absorption spectra of MB are shown in Figure 3. The absorption spectra of MB upon increasing the concentration of DNA showed gradually decreases in the peak intensities with a red shift. This phenomena is usually associated with molecular intercalation into the base stack of the ds-DNA.34 The strength of this electronic interaction
is expected to decrease as the cube of the distance between the chromophore and the DNA bases.35,36 By decreasing
the distance between intercalated MB and DNA bases, hypochromism take place obviously. Thus, this is consistent with the combination of MB π electrons and π electrons of DNA’s bases.36 Consequently, the energy level of the π-π*
electron transition decreases, which causes a red shift. This contributes to the hypochromic effect discussed above.
Competitive interaction of doxorubicin with MB-ds-DNA
The observed band of MB-doxorubicin complex at 668 nm gradually decreases in intensity with the increasing Figure 1. Absorption spectra of doxorubicin in the presence of ds-DNA at different concentrations. CDNA= 0, 5.0, 10.0, 15.0, 20.0 and 25.0 µmol L-1 for curves 1-6, and 10.0 µmol L-1 doxorubicin in phosphate buffer (0.01 mol L-1, pH 7.4) plus NaCl (0.05 mol L-1).
concentration of the added doxorubicin. This band almost shifts towards the blue end of the spectrum with the appearance of a new peak at 504 nm, which increases progressively in intensity (Figure 4). An isobestic point at 580 nm provides evidence that a new species is forming during the competitive interaction. The observed changes in intensity and position of the bands with increasing amounts of doxorubicin added to the MB-DNA solution, suggest that doxorubicin intercalates into the double helix of the DNA through exchanging with the MB luorophoric dye probe.
Electrochemical studies
Interaction of doxorubicin with ds-DNA
Typical differential pulse voltammetry behavior of doxorubicin in the absence and presence of DNA has been shown in Figure 5. Addition of DNA causes the peak current of the oxidation wave of doxorubicin to diminish considerably. Additionally, the peak potential (Epc) shifts to more positive values, from 0.41 to 0.45 V (vs. SCE), indicating that the action of doxorubicin with ds-DNA may be intercalation.37,38
According to the equation ∆E
b
0’ – ∆E
f
0’ = 59.15log(K
R/KO),
37
where E0’b and E f
0’ are the formal potentials of the drug in the
presence and absence of DNA and kR/kO is the ratio of the
formation constant between drug and DNA in the reduction and oxidation forms, the value was calculated to be 4.7. This suggests that the formation constant for the doxorubicin binding to DNA is about 4.7 times larger than in its oxidized form.
Interaction of MB with ds-DNA
A differential pulse voltammogram of the MB dye probe (Figure 6) at a glassy carbon electrode exhibits a cathodic peak. The peak at approximately –0.13 V corresponds to the reduction of MB. As the concentration of ds-DNA is increased, no new waves are formed, but a decrease in peak current for reduction peak occurs. Positive shift was observed for reduction peak potential, which again suggests that the MB molecule has intercalated into the DNA.
In order to demonstrate that the decrease in current is not due to the increased viscosity of the solution or the blockage of the electrode surface by ds-DNA adsorption, a special differential pulse voltammetry experiment has been designed with a solution with or without DNA (Figure 7). In these solutions, the ions don’t interact with DNA because of coulombic repulsion between their negative charges.39 It shows that the addition of DNA only
affects the current slightly, and there was no shift in the peak potential. Therefore, there are only few effects of the Figure 3. Absorption spectra of methylene blue in the presence of DNA
at different concentrations. CDNA= 0.0, 11.7, 23.4, 35.1 and 46.8 µmol L-1 for curves 1-5, and CMB= 1 µmol L-1 in phosphate buffer (0.01 mol L-1, pH 7.4) plus NaCl (0.05 mol L-1).
Figure 4. Absorption spectra of the competitive reaction between doxorubicin and methylene blue bonded to DNA. Cdoxorubicin = 0.0, 6.8, 13.6, 20.4, 27.2, 34.0 and 40.8 µmol L-1 for curves 1-7, C
MB = 10.0 µmol L -1 and CDNA = 10.0 µmol L-1 in phosphate buffer (0.01 mol L-1, pH 7.4) plus NaCl (0.05 mol L-1).
Figure 5. Differential pulse voltammograms of doxorubicin (0.7 to 0.2 V/ SCE) in the presence of different concentrations of DNA on the surface of glassy carbon electrode (GCE). CDNA = 0.0, 1.0, 10.0 and 50.0 µmol L-1 for curves 1-4, and Cdoxorubicin = 10 µmol L-1 in phosphate buffer (0.01 mol L-1, pH 7.4) plus NaCl (0.05 mol L-1), scan rate 33.3 mV s-1.
Figure 6. Differential pulse voltammograms of methylene blue in the presence of different concentrations of DNA. CDNA = 0.0, 1.9, 3.8, 5.7 and 7.6 µmol L-1 for curves 1-5, and C
MB = 10 µmol L
change in viscosity (ds-DNA addition) on the diffusion, and no signiicant obstruction on the GC surface from ds-DNA adsorption. The great decrease in current of doxorubicin in the presence of ds-DNA could be attributed to the decrease of diffusion coeficient of the complex and decreasing in the free drug concentration because of the complex formation.
Spectroluorometry studies
Interaction of doxorubicin with ds-DNA
Doxorubicin has two maxima luorescence peaks at ca.
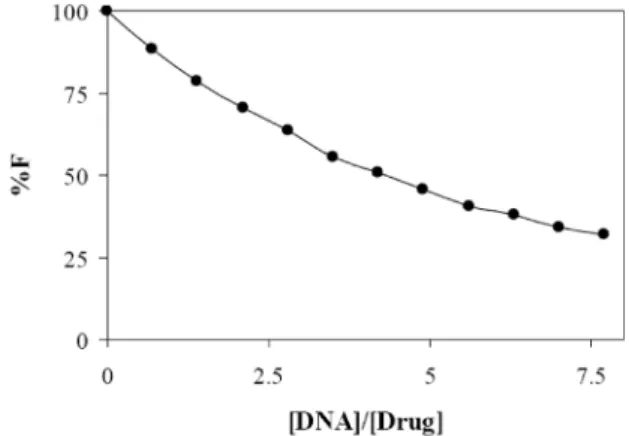
560 nm and ca. 590 nm when excited at 480 nm. When the ds-DNA solution was added to the doxorubicin solution, the luorescence intensity decreased (quenched luorescence). Figure 8 shows the luorescence spectra of doxorubicin in the presence and absence of calf thymus DNA. The inset of Figure 8 shows a Hill plot of luorescence quenching as a function of increasing ds-DNA concentration. Also, the plot in Figure 9 shows the variation of the luorescence intensity of doxorubicin as a function of CDNA/Cdoxorubicin
ratio. It is clear that the luorescence of doxorubicin was not completely quenched by ds-DNA, indicating that only a fraction of the binding sites quenches the luorescence.
The fluorescence quenching of doxorubicin in the presence of DNA may be caused by the fact that, by diffusion of drug into the double helix of DNA, the active surface of doxorubicin will be reduced upon excitation radiation.
Interaction of MB with ds-DNA
Figure 10 shows the synchronous luorescence spectra of MB with ds-DNA. It can be seen that the luorescence of MB was eficiently quenched at the maximum emission wavelength 678 nm upon addition of ds-DNA, indicating that the MB binding to DNA changes the excited state electronic structure of MB luorophore.34
The luorescence quenching constant, KSV, evaluated using the Stern-Volmer equation 2 was 7.60 × 10³ L mol-1.
In equation 2, F0 and F are the luorescence intensities in
the absence and presence of ds-DNA respectively. It is clear that the luorescence of MB was not completely quenched by ds-DNA, indicating that only a fraction of the binding sites quenches the luorescence.
F0
––– = 1 + KSV[DNA] (2)
F Figure 7. Differential pulse voltammograms of in the presence of different
concentrations of DNA. CDNA= 0.0, 1.9, 3.8, 5.7 and 7.6 µmol L-1, and [K4Fe(CN)6] = 10 µmol L-1 in phosphate buffer (0.01 mol L-1, pH 7.4) plus NaCl (0.05 mol L-1), scan rate 50 mVs-1.
Figure 8. Emission luorescence spectra of doxorubicin in the presence of DNA.40C
DNA/Cdoxorubicin = 0.0, 0.01, 0.03, 0.1, 0.3, 0.5, 1.0, 3.0, 5.0, 7.0 and 10.0 for curves 1-11, and Cdoxorubicin = 1.5 µmol L-1 in phosphate buffer (0.01 mol L-1, pH 7.4) plus NaCl (0.05 mol L-1), excitation wavelength 480 nm.
Figure 9. The plot of luorescence intensity (F%) versus CDNA/Cdoxorubicin
at luorescence wavelength of 590.0 nm. Conditions: phosphate buffer (0.01 mol L-1, pH 7.4) plus NaCl (0.05 mol L-1), C
doxorubicin = 1.0 µmol L -1, excitation wavelength 480 nm.40
Figure 10. Synchronous luorescence spectra of methylene blue in the presence of DNA. CDNA = 0.0, 2.93, 5.86, 11.0, 20.7, 25.1, 29.3, 33.3 and 46.5 µmol L-1 for curves 1-9, and C
MB = 10.0 µmol L
Conclusions
In this research, the interaction of anticancer drug (doxorubicin) with ds-DNA has been investigated by UV-Vis spectrophotometry, differential pulse voltammetry and spectroluorometry. All the acquired spectral data showed that a new adduct between doxorubicin and DNA is formed. In solution, the drug can bind to ds-DNA with a binding constant of K = 3.2 (±0.24) × 104 L mol-1. The
quenching constant (KSV) for methylene blue-DNA system was determined 7.60 (±0.71 ) × 103 L mol-1 (n = 4) by
Stern-Volmer equation.
The UV-Vis spectrophotometry, electrochemistry and spectroluorometry techniques show an intercalation mechanism between drug doxorubicin and ds-DNA.
To the best of our knowledge, it is the irst method that allows investigation on the interaction between doxorubicin and DNA using spectrofluorometry and UV-Vis spectrophotometry methods. In conclusion, the above system offers a practical potential for study on the drug-DNA interactions with some advantages such as simplicity, good repeatability, suitable speed and low cost devices which have not been presented together in the previously reported articles.
Acknowledgments
The authors gratefully acknowledge the financial support of this work by Azad University branch of Gachsaran. The authors also thank Dr. Mahshad Yaran from Red cross drug store in Isfahan city for her cooperation.
References
1. Grguric-Sipka, S. R.; Vilaplana, R. A.; Perez, J. M.; Fuertes, M. A.; Alonso, C.; Alvarez, Y.; Sabo, T. J.; Gonzalez-Vilchez, F.; J. Inorg. Biochem. 2003, 97, 215.
2. Rauf, S.; Gooding, J. J.; Akhtar, K.; Ghauri, M. A.; Rahman, M.; Anwar, M. A.; Khalid, A. M.; J. Pharm. Biomed. Anal. 2005,
37, 205.
3. Goldberg, I. H.; Beerman, T. A.; Poon, R.; Cancer, Plenum Press: New York, 1997.
4. Neidle, S.; Progress in Medicinal Chemistry, Elsevier/North-HoUand Biomedical Press: Amsterdam, 1979.
5. Blake, A.; Peacocke, A. R.; Biopolymers 1968, 6, 1225. 6. Waring, M. J.; The Molecular Basis of Antibiotic Action, John
Wiley: London, 1972.
7. Miller, W.; Crothers, D. M.; J. Mol. Biol. 1968, 35, 251. 8. Wang, J. C.; J. Mol. Biol. 1974, 89, 783.
9. Angerer, L. M.; Gerghiou, S.; Moudrianakis, E. N.; Biochemistry
1974, 13, 1075.
10. Lurquin, P. F.; Chem. Biol. Interact. 1974, 8, 303. 11. Lawrence, J. J.; Daune, M.; Biochemistry 1976, 15, 3301. 12. Paoletti, J.; Magee, B. B.; Magee, P. T.; Biochemistry 1977, 16,
351.
13. Houssier, C.; Bontemps, J.; Edmonds-Aft, X.; Fredericq, E.; Ann, N. Y.; Acad. Sci. 1977, 303, 170.
14. Wartell, R. M.; Larson, J. E.; Wells, R. D.; J. Biol. Chem. 1975, 250, 2698.
15. Soben, H. M.; Reddy, B. S.; Bhandary, K. K.; Jain, S. C.; Sakore, T. D., Seshadri, T. P.; Symp. Quant. Biol. 1978,42, 87. 16. Lown, J. W.; Anthracycline and Anthracenedione-Based
Anticancer Agents, Elsevier: Amsterdam, 1988.
17. Priebe, W.; Anthracyclines Antibiotics. New Analogs, Methods of Delivery, and Mechanisms of Action, American Chemical Society: Washington, DC, 1995.
18. Raffaelli, A.; Pucci, S.; Desideri, I.; Bellina, C. R.; Bianchi, R.; Salvadori, P.; J. Chromatogr., A 1999, 854, 57.
19. Bale, M. J.; Yang, C.; Pfaller, M. A.; Diagn. Microbiol. Infect. Dis. 1997, 28, 65.
20. Usacheva, M. N.; Teichert, M. C.; Biel, M. A.; J. Photochem. Photobiol., B 2003, 71, 87.
21. Li, W. Y.; Xu, J. G.; Guo, X. Q.; Zhu, Q. Z.; Zhao, Y. B.; Anal. Lett. 1997, 30, 527.
22. Armstrong, R. W.; Kurucsv, T.; Strauss, V. P.; J. Am. Chem. Soc.
1970, 92, 3174.
23. Erdem, A.; Kerman, K.; Meric, B.; Ozsoz, M.; Electroanal.
2001, 13, 219.
24. Ohuigin, C.; McConnell, D. J.; Kelly, J. M.; Van der Putten, W. J. M.; Nucleic Acids Res. 1987, 15, 7411.
25. Fujimoto, B. S.; Clendenning, J. B.; Delrow, J. J.; Heath, P. J.; Schurr, M.; J. Phys. Chem. 1994, 98, 6633.
26. Kelly, S. O.; Barton, J. K.; Jackson, N. M.; Hill, M. G.;
Bioconjugate Chem. 1997, 8, 31.
27. Norden, B.; Tjerneld, F.; Biopolymers 1982, 21, 1713. 28. Britos, L.; Goyenola, G.; Orono, S. U.; Biochem. Mol. Biol.
Educ. 2004, 32, 341.
29. Di Marco, A.; Areamone, F.; Zunino, F.; Antibiotics, Springer-Verlag: Berlin, 1975.
30. Manfait, M. ; Alixl, A. J. P. ; Jeannesson, P.; Jardillier, J. C.; Theophanides, T.; Nucleic Acids Res. 1982, 10, 3803. 31. Manfait, M.; Theophanides, T.; Biochem. Biophys. Res.
Commun. 1983, 116, 321.
32. Haj, H. T. B.; Salerno, M.; Priebe, W.; Kozlowski, H.; Garnier-Suillerot, A.; Chem.-Biol. Interact. 2003, 145, 349.
33. Ibrahim, M. S.; Shehatta, I. S.; Al-Nayeli, A. A.; J. Pharm. Biomed. Anal. 2002, 28, 217.
34. Long, E. C.; Barton, J. K.; Acc. Chem. Res. 1990, 23, 271. 35. Huang, C. Z.; Li, Y. F.; Feng, P.; Talanta 2001, 55, 321. 36. Ensai, A. A.; Hajian, R.; Ebrahimi, S.; J. Braz. Chem. Soc.
2009, 20, 266.
38. Carter, M. T.; Rodoriguez, M.; Bard, A. J.; J. Am. Chem. Soc. 1989, 111, 8901.
39. Radi, A.; El Ries, M. A.; Kandil, S.; Anal. Bioanal. Chem. 2005,
381, 451.
40. Bagalkot, V.; Farokhzad, O. C.; Langer, R.; Jon, S.; Angew. Chem., Int. Ed. 2006, 45, 1.
Received: December 14, 2008