Abstract— The method currently recommended by the ITU-R for the prediction of rain attenuation in terrestrial line-of sight links considers an equivalent path length over which the rain intensity is assumed to be constant. In other methods, the spatial and temporal variations of the rainfall rate along the path are characterized by an effective rainfall rate that is dependent on the actual path length. Based on experimental measurements, this paper presents a modified effective rainfall rate method that includes the prevailing wind direction during rainy conditions as an additional parameter for the prediction of rain attenuation. The wind direction, which can be obtained from meteorological databases with global coverage, is shown to significantly improve prediction accuracy.
Index Terms— Rain attenuation, radio propagation, propagation measurements.
I. INTRODUCTION
Rain attenuation in terrestrial and earth-space links is due to scattering and absorption of the radio
waves by the falling raindrops in the propagation path. Uniform rain can be characterized by a
specific attenuation factor γR that can be calculated from knowledge of the complex index of the
refraction of water, the terminal velocity and the size distribution of the raindrops [1], [2]. For
practical applications, an approximate power-law expression relating γR (dB/km) and the rainfall rate
R (mm/h), first proposed by Drufuca [3], is given by
(1)
Later, Olsen et al [4] provided tables of k and α values for different frequencies and polarizations.
Horizontally polarized waves are subjected to more attenuation than vertically polarized waves, as
falling raindrops are deformed assuming the shape of oblate spheroids [5], [6]. For practical use,
Recommendation ITU-R P.838-3 [7] gives expressions for the calculation of k and α as functions of
frequency, in the range of 1 to 1000 GHz, for vertically and horizontally polarized waves. These
functions were developed as curve-fittings to power-law coefficients derived from scattering
calculations carried out by Gibbins and Walden [8].
g
R=
k R
aModified Rain Attenuation Prediction Method
Considering the Effect of Wind Direction
L. da Silva Mello, M. S. Pontes, I. Fagundes
Pontifical Catholic University of Rio de Janeiro, Rio de Janeiro, Brazil - [email protected]
M. P. C. Almeida
National Institute of Metrology, Quality and Technology, Rio de Janeiro, Brazil
F. J. A. Andrade
The attenuation due to rain in a fixed link can be obtained by integrating the specific attenuation
along the propagation path. The rainfall rate field shows random space and time variations [9]. Time
series of rainfall rate measured at a point usually show short periods of high rain rate embedded in
longer periods of lighter rain. Rainfall is usually classified as lighter stratiform rain and consisting of
smaller drops, or as convective rain, heavier and more localized. Spatial weather radar maps of
reflectivity, which is a measure of rainfall intensity, show small areas of higher rain rate imbedded in
larger regions of lighter rain and can be used to separate areas of convective and stratiform
precipitation [10], [11]. Tropical rainfall is usually considered convective in nature, but almost all
convection occurs in association with stratiform rain [12].
Methods developed to predict statistics of rain attenuation essentially differ in the models used to
describe the space-time structure of rainfall rate. Synthetic storm methods convert time series of
rainfall rate measured at a point into rainfall rate profiles along the path, using the translation velocity
of the rain cells estimated as the wind speed, to derive attenuation statistics [3], [13], [14]. In recent
years, extensive work has been conducted towards the development of synthesizers, based on the
Maseng-Baken [15] stochastic model, that directly provide rain attenuation time series without relying
on rainfall rate time series. Extensions of the original Maseng-Baken model have been developed for
both earth-space [16] and terrestrial links [17].
Methods oriented to link design normally use the complementary cumulative probability
distribution of point rainfall rate as the input to predict the corresponding attenuation distribution. The
statistical profile of rain along the path is derived assuming a single cell of a particular shape [18] or
multiple cells with a statistical distribution of sizes [19], [20]. Simpler methods for practical
applications apply a reduction or adjustment coefficient to the actual path length to obtain an effective
path length over which the rain intensity is assumed to be constant [21], [22], [23]. This concept is
presently used in the rain attenuation prediction method recommended by the ITU-R [24].
An alternative approach is to characterize the statistical rain profile by an effective rainfall rate,
which may be derived from the spatial correlation function of rainfall, derived from measurements
using rapid response rain gauges spaced along a path [25] or from semi-empirical laws [26], [27].
This paper investigates a modified method for the prediction of rain attenuation in terrestrial
line-of-sight links that includes the prevailing wind direction during rainy conditions as an additional
parameter in the calculation of the effective rainfall rate, significantly improving prediction accuracy.
The wind direction during rainy conditions was obtained from meteorological databases at locations
for links for which rain attenuation and rainfall rate statistics are available in the ITU-R databanks
II. THE ITU-R PREDICTION METHOD
The rain attenuation method recommended by the ITU-R [24] has the point rainfall rate exceeded
for 0.01% of the time (R0.01 mm/h) as input to estimate the corresponding value of attenuation using
the concept of an effective path length, deff. According to the method, the attenuation exceeded for
0.01% of the time (A0.01 dB) in a fixed terrestrial link is given by
(2)
where γR (dB/km) is the specific attenuation, d (km) is the path length and r is a distance factor that
depends on the frequency, on the path length and on α, the exponent in the specific attenuation power
law. The frequency and polarization dependent parameters, k and α, are given in Recommendation
ITU-R P. 838-3 [6]. The point rainfall rate, R0.01 (mm/h), for the link site is preferably obtained from
long-term local measurements. If these are unavailable, which is often the case, it can be estimated
from global maps provided by the ITU-R [29].
To obtain the attenuation, Ap, exceeded for a percentage of time p between 0.001% and 0.1%, an
extrapolation function is used:
(3)
where C1, C2 and C3 are frequency dependent coefficients.
The use of only one value of rainfall rate cumulative probability distribution as representative of the
rain regime in the region where the link is located represents a shortcoming of the method. For two
regions with different distributions of point rainfall rate but similar values of R0.01, the same statistical
distribution for the attenuation will be predicted. Additionally, there is no reason why the distance
factor should be dependent on frequency and on the α parameter. Although the regression using these
variables provides a better fit to experimental data, the method is lacking in physical basis.
III. EFFECTIVE RAINFALL RATE METHODS
A method using the full rainfall rate distribution and the concept of an effective rainfall rate was
developed as an alternative to the ITU-R method. Although effective path length methods are
essentially equivalent of effective rainfall rate methods, the latter approach seemed preferable as the
objective of this work is to investigate possible effects of the wind direction that govern the raincells
movement. The general expression for predicting attenuation from an effective rainfall rate that
represents the variations of rain along the path is given by:
A
0.01= g
Rd
eff=
k R
0.01ad r
A
pA
0.01=
C
1p
Ap=k×éëReff
( )
Rp ùûa
×d
(4)
where Rp is the rainfall rate exceeded during p% of the time. For application in tropical climates,
empirical expressions for the effective rainfall rate were obtained using a data set obtained from
concurrent measurements of point rainfall rate and rain attenuation at 3 sets of converging links at
different sites in Brazil, comprising a total of 17 links. The effective rainfall rate was first obtained as
a function of the measured rainfall rate and the path length.
Having sets of converging links with different orientations and subjected to the same rain regimes
at each of the three sites allowed us to investigate the effect of the wind direction on the attenuation.
The influence of the wind on the cumulative distribution of rain attenuation in a point-to-point links is
considered in synthetic storm methods and the can be explained considering the rain cells movement
along the path. Depending on the relative angle between the path azimuth and the prevailing wind
direction during rainy conditions, the portion of the propagation path the will be affected by the rain
cells will change. It was found that the inclusion of this parameter in the modeling of the effective
rainfall rate significantly improved the attenuation prediction accuracy.
Based on the good results obtained for the tropical sites, a second version of the method was
developed considering data from other regions of the world available in the ITU-R databanks. The
extended method also shows improved prediction accuracy in comparative tests with the ITU-R
prediction method.
A. Effective rainfall rate method for tropical regions
The experimental data were obtained from tipping bucket rain gauge measurements of point rainfall
rate and concurrently measured excess attenuation due to rain in 6 links in São Paulo, 4 links in Rio
de Janeiro and 7 links in Brasília. Figure 1 shows the geometry of the converging links at the
measurements sites.
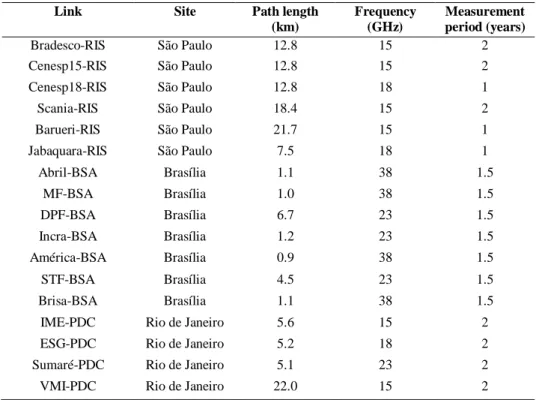
Table I shows the location, duration of measurements, operation frequencies and path lengths for
each link. Time resolution of the attenuation measurements was 10 s for São Paulo and 1 s for Rio de
Janeiro and Brasília. The time series were analyzed to provide complementary cumulative
distributions of rain attenuation. Information obtained from the rain gauge data includes the date and
time of each bucket tip. Knowledge of the bucket rain accumulation and interval between tips allows
for the creation of a time series of quasi-instantaneous rainfall rate, which was then analyzed to
provide the complementary cumulative distributions of rainfall rate for each site. More detailed
Fig. 1. Geometry of the converging links at (a) São Paulo, (b) Rio de Janeiro and (c) Brasília.
TABLE I - CHARACTERISTICS OF THE LINKS IN BRAZIL
Link Site Path length
(km)
Frequency (GHz)
Measurement period (years)
Bradesco-RIS São Paulo 12.8 15 2 Cenesp15-RIS São Paulo 12.8 15 2 Cenesp18-RIS São Paulo 12.8 18 1 Scania-RIS São Paulo 18.4 15 2 Barueri-RIS São Paulo 21.7 15 1 Jabaquara-RIS São Paulo 7.5 18 1 Abril-BSA Brasília 1.1 38 1.5
MF-BSA Brasília 1.0 38 1.5 DPF-BSA Brasília 6.7 23 1.5 Incra-BSA Brasília 1.2 23 1.5 América-BSA Brasília 0.9 38 1.5 STF-BSA Brasília 4.5 23 1.5 Brisa-BSA Brasília 1.1 38 1.5 IME-PDC Rio de Janeiro 5.6 15 2 ESG-PDC Rio de Janeiro 5.2 18 2 Sumaré-PDC Rio de Janeiro 5.1 23 2 VMI-PDC Rio de Janeiro 22.0 15 2
The effective rainfall rate values were estimated from the measured distributions of rainfall rate and
attenuation using the following expression, derived from eq. (4):
(5)
R
eff(
R
p)
=
A
pk d
æ
èç
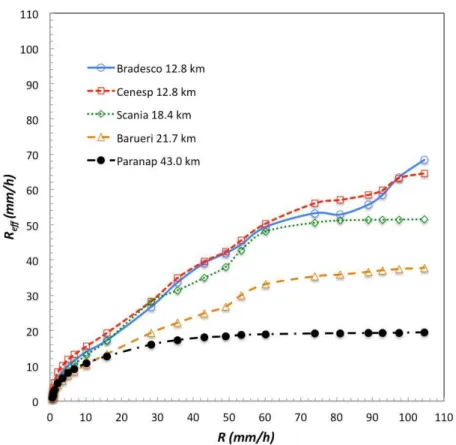
Fig. 2 shows the calculated values of Reff against the measured values of R at the same time
percentages for the 15 GHz links in the São Paulo region, as an example. It can be observed that, for
high values of R, the effective rainfall rate tends to saturate at a value that decreases with the path
length.
This can be explained considering that high rainfall rates are usually associated with smaller
raincells, particularly true for tropical regions, were convective rain is common. As raincell size
decreases, only part of the propagation path will be subjected to rain attenuation and the effective
rainfall rate becomes increasingly smaller than the measured point rainfall rate.
Fig. 2. Effective rainfall rate vs. measured rainfall rate - 15 GHz links in Brazil
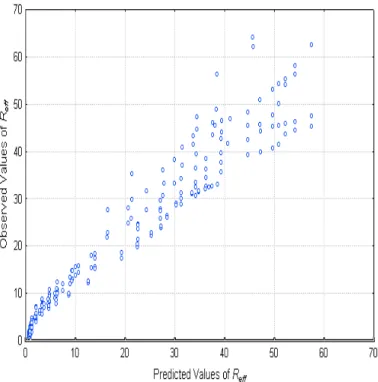
The behavior is well modeled by the following function:
(6)
(7)
Eq. (7) was obtained by non-linear regression using data from the three measurement sites. The
coefficient of determination [31] for the fitting is R-square=0.93. Figure 3 shows a scatterplot of the
measured values of Reff and the values estimated using eqs. (6) and (7).
R
eff(
R
p,
d
)
=
R
p×
R
0(
d
)
R
p+
R
0(
d
)
Fig. 3. Predicted versus observed values of Reff (Rp,d) for the links in Brazil
Although the result can be considered good, it is improved if the angle between the link azimuth and
the prevailing wind direction at each site are included in the regression. The wind direction during
rainy conditions was obtained from the ERA-40 database [32], which provides 40 years of global
meteorological data, including both the average wind direction and the rain accumulation with 6-hour
time resolution in a grid of 1.1250 per 1.1250 degrees. Data from this database were retrieved and
analyzed to provide average values of wind direction for intervals with rain accumulation for the
periods of measurement in each site. The values for each site were calculated by bi-linear
interpolation using the values corresponding to the four nearest points in the grid. Fig. 4 shows one
year of 6-hour resolution rain accumulation for the São Paulo (RIS) site and the distribution of wind
direction during rainy conditions for the same period.
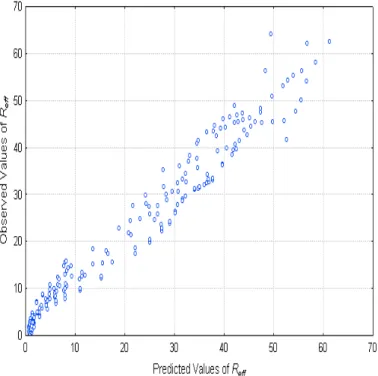
A new regression was obtained by including in the model the angle, θ (degrees), between the link
direction and the prevailing wind direction. The best fit (R-square=0.96) is given by the following
expressions:
Reff(Rp,d)= Rp×R0(d)
Rp+R0(d)(1+0.10q ) for 0£ q £ 90 (8)
(9)
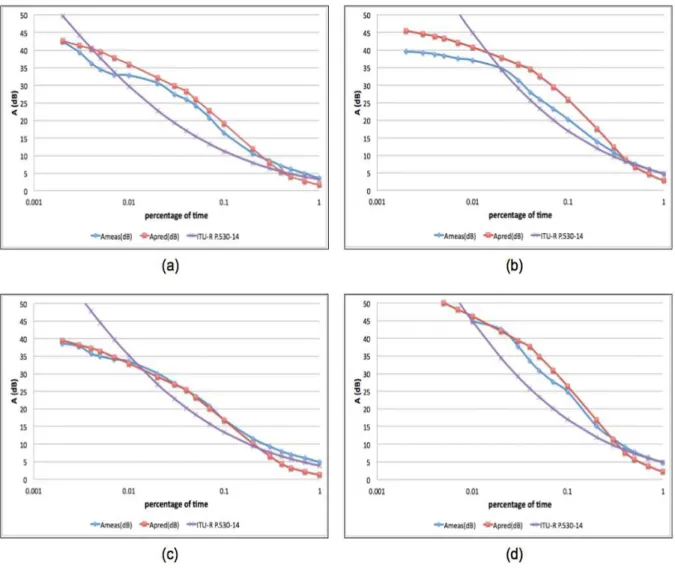
The corresponding scatterplot of measured and estimated values of Reff is shown in Figure 5. Figure
6 shows a comparison between the measured complementary cumulative distributions of rain
attenuation for 4 links in São Paulo and the distributions predicted with the ITU-R method and the
method proposed in this paper. The use of an effective rainfall rate depending on path length and wind
direction improves the fitting, particularly for high values of rainfall rate.
Fig. 5. Predicted versus observed values of Reff (Rp,d,θ) for the links in Brazil
Fig. 6. Predicted and measured distributions of attenuation: (a) Bradesco-RIS; (b) Barueri-RIS; (c) Cenesp15-RIS; (d) Scania-RIS.
B. Extended effective rainfall rate method
The method for tropical regions described in the previous section was generalized using 76 years of
measured data of point rainfall rate and rain attenuation from 25 links in 7 countries, available in the
ITU-R DBSG3 database [ITU-R, 2014]. These are the entries in the database for which the
coordinates of both ends of the link are available, making it possible to determine the azimuth. The links’ main characteristics are shown in Table II.
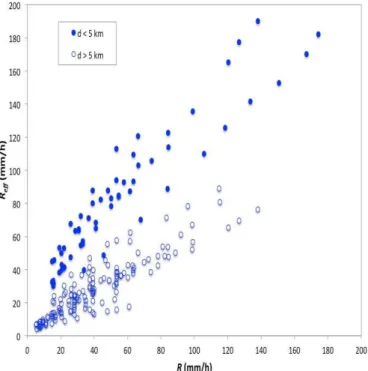
Fig. 7 shows the calculated values of Reff against the measured values of R at the same time
percentages for all datasets corresponding to the links in Table II. The values of Reff were obtained
TABLE II - CHARACTERISTICS OF THE LINKS IN THE ITU-R DATABASE USED TO FIT THE EFFECTIVE RAINFALL RATE Station Country Azimuth (°) Path length
(km)
Frequency (GHz)
Measurements period (years)
Uvaly CZ 75.04 15.30 14.92 4 Mostova CZ 98.28 43.80 13.14 4 Pisek CZ 205.03 39.40 13.03 4 Strahov CZ 198.14 34.00 13.19 4 Strahov CZ 198.14 34.00 13.10 4 Piaseczno PL 224.55 15.40 11.50 4 Piaseczno PL 224.55 15.40 18.60 4 Dubna 3 SU 237.00 12.65 29.30 5 Dubna 3 SU 237.00 12.65 19.30 8 Dubna 3 SU 237.00 12.65 11.50 8 Bradesco BR 259.98 12.79 14.55 2 Cenesp BR 221.10 12.78 14.55 2 Cenesp BR 221.10 12.78 18.61 2 Scania BR 154.40 18.38 14.50 2 Barueri BR 287.07 21.69 14.53 1 Shell BR 126.48 7.48 18.59 1 Paranapiacaba BR 124.27 42.99 14.52 2 Brasília-STF BR 103.86 4.48 23.00 1 Rio de Janeiro BR 216.91 6.55 23.00 2 Fujitsu MY 107.04 1.40 32.60 1 Yotsuya JP 347.37 2.30 33.40 3 Akasaka JP 180.04 2.10 32.60 3 Koenji JP 219.13 1.20 23.20 2 Karagasaki JP 163.59 9.10 15.25 3 Shiyakusyo JP 355.49 6.37 18.58 1
It can be noted that, in this case, where both data from tropical and temperate regions are
considered, the saturation of Reff clearly observed in fig. 4 is not present. Additionally, for links in the
ITU-R database with path lengths smaller than 5 km, the effective rainfall rate can be larger than the
actual rainfall rate. This may be explained by the fact that the measured point rainfall rate values
provided in the ITU-R database have a minute integration time. For low rainfall rates, the
one-minute average may be smaller than the actual rainfall rate. For long links, this effect is compensated
by the spatial non-uniformity of the rain field along the path and the effective rainfall rate becomes
smaller than the measured rainfall rate. For short links the rain tends to be more uniform along the
path resulting in an effective rainfall rate that can be larger than the rainfall rate measured with
one-minute integration time.
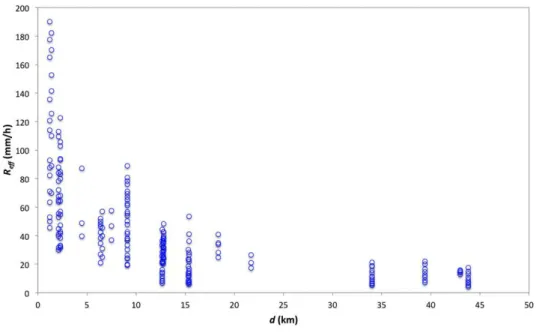
This is not adequately modeled by eq. (6).. For the extended dataset, the variation of Reff with path
length, shown in fig. 8, suggests the fitting by an exponential or a power-law function.
Fig. 8. Effective rainfall rate vs. path length - 25 links in the ITU-R database
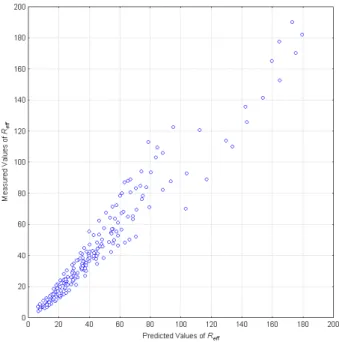
The best fit including the wind direction factor (R-square=0.94) was obtained with the following
expression:
R
eff(
R
p,
d
,
q
)
=
12.98
×
R
0.59×
d
- 0.39×
(1
-
0.105
×
q
) for 0
£
q
£
90
0 (10)Fig. 9. Predicted versus observed values of Reff (Rp,d,θ) - 25 links in the ITU-R database
To better evaluate the proposed method’s accuracy, it was tested in comparison with the measured attenuation distributions and also with the distributions predicted by the current ITU-R method. The
test variable recommended by the ITU-R [33] to access the accuracy of rain attenuation prediction
methods is the weighted natural logarithm of the ratio between the predicted and measured values of
the attenuation exceeded at a given percentage of time:
(11)
where Am,i and Ap,i are the i-th measured and predicted values of attenuation, respectively. The mean
and the standard deviation of the test variable values calculated for all links and percentages of time
for which there are measured data available are used to evaluate the performance of each method.
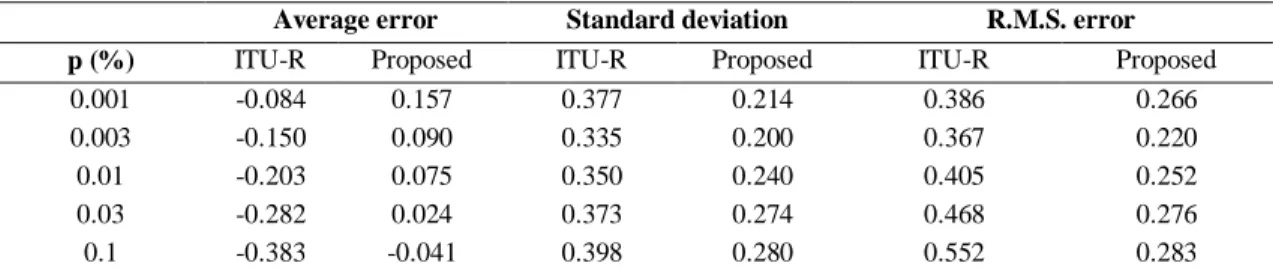
Table III shows the mean value, standard deviation and r.m.s. value of the test variable for the
proposed method and the ITU-R method, for percentages of time between 0.001% and 0.1%. It should
be noted that the values at the 0.001% probability level corresponds to a smaller number of observed
events, limiting the statistical reliability of the results.
For this subset of the ITU-R databank, the method using the effective rainfall rate that is a function
of path length and wind direction shows significant improvement over the ITU-R method. The overall
r.m.s. error of the proposed method considering all probabilities is 0.251, to be compared with 0.428
for the ITU-R method.
V
i=
ln
A
m,iA
p,iæ
èç
ö
ø÷
A
m.i10
æ
èç
ö
ø÷
0.2
for
A
m,i<
10
V
i=
ln
A
m,iTABLE III - PREDICTION ERRORS OF THE ITU-RP.530-15 METHOD AND THE PROPOSED METHOD Average error Standard deviation R.M.S. error
p (%) ITU-R Proposed ITU-R Proposed ITU-R Proposed
0.001 -0.084 0.157 0.377 0.214 0.386 0.266 0.003 -0.150 0.090 0.335 0.200 0.367 0.220 0.01 -0.203 0.075 0.350 0.240 0.405 0.252 0.03 -0.282 0.024 0.373 0.274 0.468 0.276 0.1 -0.383 -0.041 0.398 0.280 0.552 0.283
IV. CONCLUSIONS
A modified effective rainfall rate method is proposed for the prediction of rain attenuation in
terrestrial links. In contrast with the method currently recommended by the ITU-R, the full rainfall
rate distribution is taken into account to predict the attenuation distribution, avoiding extrapolations
dependent on the percentage of time.
The method uses the concept of an effective rainfall rate to represent the temporal and spatial
variations of rain intensity along the path. Based on measurements performed at converging links in
three different tropical sites, it was found that the effective rainfall rate depends on the wind direction
during rainy conditions, in addition to the measured rainfall rate and path length.
The method developed for tropical sites was extended for other climatic regions using data from
additional links available in the ITU-R databanks, and the resulting prediction method shows
significant improvement when tested in comparison the current ITU-R method.
ACKNOWLEDGMENT
CNPq (National Research Council, Brazil) supported this work under covenant 573939/2008-0
(INCT-CSF).
REFERENCES
[1] Oguchi, T., Attenuation of electromagnetic wave due to rain with distorted raindrops, J. Radio Res. Labs. (Japan), 33(7), 467–485, 1960.
[2] Oguchi, T., Attenuation of electromagnetic wave due to rain with distorted raindrops (Part II), J. Radio Res. Labs. (Japan), 11, 19-44, 1964.
[3] Drufuca, G., Rain attenuation statistics for frequencies above 10 GHz from rain gauge observations, Journal Recherches Atmospheriques, vol 1-2, pp. 399-411, 1974.
[4] Olsen, R., D. Rogers, and D. Hodge, The aRb relation in the calculation of rain attenuation, IEEE Trans. Ant. Prop., 26(2), 318-329, 1978.
[5] Pruppacher, H. R., and R. L. Pitter, A semi-empirical determination of the shape of cloud and rain drops, J. Atmos. Sci., 28(1), 86–94, 1971.
[6] Oguchi, T., Scattering properties of Pruppacher-and-Pitter form raindrops and cross-polarization due to rain: calculations at 11,13, 19-3 and 19-34-8 GHz, Radio Sci., 12, 41-51, 1977.
[7] ITU-R Recommendation P.838-3, 2005, Specific attenuation model for rain for use in prediction methods, International Telecommunication Union, http://www.itu.int/rec/R-REC-P.838/en.
[8] Gibbins, C. J., and C. J. Walden, A study into the derivation of improved rain attenuation regression coefficients, Radiocommunications Agency Report No. AY4359, 2003, http://www.radio.gov.uk/topics/research/research-index.htm.
[9] Capsoni, C., and M. D'Amico, Morphological description of the rain structures in the Padana Valley, Proceedings of the Third European Conference on Radar Meteorology (ERAD), 541-544, 2004.
[10] Steiner, M. and R.A. Houze Jr., Sensitivity of estimated monthly convective rain fraction to the choice of Z-R relation, J Appl. Meteor., 36, 452-462, 1997.
[12] Houze, R.A., Stratiform precipitation in regions of convection, Bull. Amer. Meteor. Soc., 78, 2179-95, 1997Matricciani E., Physical-mathematical model of the dynamics of rain attenuation based on rain rate time series and a two-layer vertical structure of precipitation, Radio Science, vol. 31, no. 2, pp. 281-296, 1996.
[13] Matricciani E. (2008), Global formulation of the Synthetic Storm Technique to calculate rain attenuation only from rain rate probability distributions, IEEE Antennas and Propagation Society International Symposium, 1-4, 2008, doi: 10.1109/APS.2008.4619006.
[14] Maseng, T., and P. M. Bakken (1981), A Stochastic Dynamic Model of Rain Attenuation, IEEE Trans. Com., 29(5), 660-669, 1981. [15] Lacoste, F., M. Bousquet, L. Castanet, F. Cornet, and J. Lemorton, Improvement of the ONERA-CNES rain attenuation time series
synthesizer and validation of the dynamic characteristics of the generated fade events, Space Comm. Journal, 20(1-2), 45-59, 2005. [16] Andrade, F. J. A., and Da Silva Mello, L., Rain Attenuation Time Series Synthesizer Based on the Gamma Distribution, IEEE Ant.
Wireless Prop. Letters, 10, 1381-1384, 2011.
[17] Misme, P., and J. Fimbel, Theoretical and experimental determination of rain-induced attenuation on a radioelectric path, Ann. Téléc., 30, 149-158, 1975.
[18] Capsoni, C., F. Fedi, C. Magistroni, A. Paraboni, and A. Pawlina, Data and theory for a new model of the horizontal structureof rain cells for propagation applications, Radio Sci., 2293), 395-404, 1987.
[19] Paraboni, A., G. Masini, and A. Elia, The Effect of Precipitation on Microwave LMDS Networks – Performance Analysis using a Physical Raincell Model, IEEE J. on Selected Areas in Commun., 20(3), 615-619, 2002.
[20] Lin, S. H., A method for calculating rain attenuation distributions on microwave paths, Bell Syst. Tech. J., 1051-1086, 1975.
[21] Garcia Lopez, J.A., and J. Peiro, Simple rain attenuation prediction technique for terrestrial radio links, Elect. Letters, 19, 879-881, 1983.
[22] Moupfouma, F., Improvement of a rain attenuation prediction method for terrestrial microwave links, IEEE Trans. Ant. Prop., 32, 1368-1372, 1984.
[23] ITU-R Recommendation P.530-15, 2013, Propagation data and prediction methods required for the design of terrestrial line-of-sight systems, International Telecommunication Union, http://www.itu.int/rec/R-REC-P.530/en.
[24] Crane, R. K., Prediction of attenuation by rain, IEEE Trans. Commun., 28, 1717-1733, 1980.
[25] Da Silva Mello, L., M. S. Pontes, R. M. de Souza and N. A. Pérez Garcia, Prediction of rain attenuation in terrestrial links using the full rainfall rate distribution, Elec. Letters, 43, 1442-1443, 2007.
[26] Da Silva Mello, Luiz and M. S. Pontes, Unified Method for the Prediction of Rain Attenuation in Satellite and Terrestrial Links, J. Micr. Optoelec. Elect. Appl., 11, 1-14, 2012.
[27] ITU-R Databank DBSG3, 2014, http://www.itu.int/pub/R-SOFT-SG3/en.
[28] ITU-R Recommendation P.837-6, 2012, Characteristics of precipitation for propagation modeling, International Telecommunication Union, http://www.itu.int/rec/R-REC-P.837/en.
[29] Silva Mello, L. A. R, E. P. O. Costa, R. S. L. Souza, Rain attenuation measurements at 15 and 18 GHz, Electronics Letters, 40(11), 683-684, 2004.
[30] Draper, N. R., Smith, H. (1998). Applied Regression Analysis. Wiley-Interscience. ISBN 0-471-17082-8. [31] ECMWF (2013), ERA-40, http://www.ecmwf.int/products/data/archive/descriptions/e4/.