Brazilian Microwave and Optoelectronics Society-SBMO received 24 Feb 2014; for review 26 Feb 2014; accepted 24 July 2014 Brazilian Society of Electromagnetism-SBMag © 2014 SBMO/SBMag ISSN 2179-1074
Abstract — The description of an interrogation system for fiber
Bragg grating sensors is reported. The full implementation in hardware of the required signal processing is proposed and made publicly available. The hardware description is implemented in a field programmable gate array (FPGA) development kit and the processing units allow one to control an optoelectronic interrogation system that uses the tunable filter method. Since the signal that drives the used Fabry-Perot filter (FFP) using a digital-to-analog converter (DAC) requires the generation of a triangular/saw-tooth waveform, the non-linear behavior of the DAC is compensated with a new methodology in this application using FPGA. When it operates controlled by a personal computer, off-board additional adaptive signal processing is used to suppress optical interference in an innovative way while removing undesired distortions in the signals caused by reflections in the optical circuit.
Index Terms— FBG, Field Programmable Gate Array, Fiber Sensors Interrogation, Peak detection.
I. INTRODUCTION
A fiber Bragg grating (FBG) is characterized by the periodic modulation of the refractive index in
the core of an optical fiber. This modulation causes the FBG to reflect a range of wavelengths of the
incident light and transmit the remaining wavelength band. Such gratings are intrinsic sensing
elements that can be photo-inscribed into the optical fiber usually by exposing its core to an
interference pattern from an ultraviolet laser [1]. However, there is a set of other methods [2] for this
purpose.
An interrogation system for such sensors can operate based on the multiplexing of several FBGs in
a single fiber, when the sensors operate as a quasi-distributed sensing network [3]. Following this
idea, grating-based sensors have been employed in a wide variety of applications in sensing and
communications [4], including the sensing of temperature, from the date of its discovery [5], and also
to measure strain [6] or refractive index [7], to name a few.
One feature of the FBG sensors relies on its inherent self-referencing capability, as the sensed
information is wavelength-encoded. One way to interrogate it is to illuminate the FBG with a
Hardware Embedded Fiber Sensor
Interrogation System using Intensive Digital
Signal Processing
Yujuan Wang, Lucas H. Negri, Hypolito J. Kalinowski
Federal University of Technology – Paraná 80230-901 Curitiba, Brazil
Daniel S. Mattos, Gabriel H. Negri, Aleksander S. Paterno*
Brazilian Microwave and Optoelectronics Society-SBMO received 24 Feb 2014; for review 26 Feb 2014; accepted 24 July 2014 Brazilian Society of Electromagnetism-SBMag © 2014 SBMO/SBMag ISSN 2179-1074 narrowband light source, either a tunable laser or a combination of broadband source followed by a
tunable filter, and measure the intensity of the resulting reflected signal after a periodical sweep of the
tuned source. The widely used tunable filter method [8] allows the interrogation of multiplexed
sensors and it is going to be used in this work. Different multiplexing schemes [9] and signal
processing methods [10] have been proposed to increase the number of sensors and quality of the
results that can be produced in this type of interrogation process. Usually the FBG interrogation goes
beyond just illuminating the FBG sensor and acquiring its reflected signal. Due to noise and
distortions in the acquired signal, it is common to use filters and special peak detection algorithms to
enhance the system precision and accuracy.
When considering embedded interrogation systems, the interrogation process needs a signal
processor. In this case, a digital signal processor (DSP) may be used to control the interrogation [11]
and to process the data, also sending the acquired data to a computer. This would illustrate a DSP
based strategy to embed the system. In [12], FBGs are used to characterize failure modes and predict
lifetime in composite laminate structures, where a field-programmable gate array (FPGA) is
employed. In this case, it would operate as a customized embedded system, taking the place of a DSP.
Another work [13] proposes the usage of FBGs to monitor mechanical equipment, where FBGs are
also interrogated by the tunable filter method implemented by an FPGA.
The use of a digital hardware like an FPGA allows one to fully synchronize the system at the clock
level. In addition, it can process the data to enhance the system precision and extract information of
the measured quantity directly on the interrogation system. There is also a higher flexibility, as the
system can be easily reprogrammed to adhere to new requirements, since the FPGA operates as a set
of logical gates in a digital circuit described by a hardware description language.
Because the tunable filter method requires the parallel generation of the tuning signal and data
acquisition (usually followed by data processing), an implementation with a low cost DSP or
microprocessor must schedule these different processes quickly enough to satisfy the project timing.
As the operations are usually performed in a sequential manner in a microprocessor or DSP, the
system performance can be greatly limited when comparing it to a solution with several dedicated
digital circuits operating in parallel at a high frequency. Using an FPGA to implement parallel digital
circuits is a strategy to overcome the microprocessor performance and precision limitations [11], [13],
yet retaining its rapid prototyping capabilities.
This paper describes the development of an FBG interrogator that implements the tunable filter
method in an FPGA. The FPGA is used to implement both the control circuits and the data processing
circuits that implement filtering and centroid computation algorithms. The system is able to
interrogate multiple non-overlapping FBG spectral signals in the wavelength domain, while the data
Brazilian Microwave and Optoelectronics Society-SBMO received 24 Feb 2014; for review 26 Feb 2014; accepted 24 July 2014 Brazilian Society of Electromagnetism-SBMag © 2014 SBMO/SBMag ISSN 2179-1074 without the need of a computer, microcontroller, DSP or instantiated intellectual property cores from
the FPGA producers.
Besides, a calibration procedure is proposed here, to our knowledge for the first time in this
application, to correct the non-linear behavior of digital to analog converters. It can be used to correct
similar interrogators, enhancing the results by reducing the error of the tuning signal. All the digital
circuits were described in VHDL1, and the entire project is available online [14] with an open source
license (GPLv3+2), allowing its use in other open projects and giving it also a pedagogical feature,
which is also an innovative approach in the work. The developed FBG interrogation system is also
validated and characterized by temperature monitoring experiments, in agreement with the uncertainty
determination procedure defined in [15].
II. METHODOLOGY
This section describes the working principles, components, and details of the developed FBG
interrogation system. This system was developed by using a Nexys 3 FPGA kit (Digilent, Inc.), with
the FPGA being used to implement all the digital circuitry needed to control the interrogation system
and to process the acquired data. It has also been implemented using behavioral VHDL code that
would allow their use in other FPGAs from the same manufacturer.
A. System Description
An illustration of an FBG sensor and its optical circuit used in a possible interrogation is
shown in Fig. 1. The sensor is illuminated through a fiber coupler by a broadband source and
reflects a narrowband spectrum centered at approximately the Bragg wavelength ( B). In Fig. 1, a
schematic structure illustrating the FBG is zoomed to show the grating pattern inscribed into the
fiber core and the refractive indexes (n0, n1, n2, n3) from outside to inside of the fiber. n0 is the
environment’s refractive index, n1 is the cladding’s refractive index, n2 and n3 are refractive
indexes that characterize the dip and peak of index modulation in the core of the fiber grating,
which is usually sinusoidal. The Bragg wavelength, B, as in Equation 1, is the parameter of
interest that characterizes the sensor behavior, where neis the effective index of the fundamental
mode in the fiber and is the grating period.
Λ
= e
B 2n
λ (1)
With uniform perturbations, FBG sensors are point sensors with a spectrum modeled by a
reflectivity function to be photo-detected while sweeping the tunable source of the interrogation.
Brazilian Microwave and Optoelectronics Society-SBMO received 24 Feb 2014; for review 26 Feb 2014; accepted 24 July 2014 Brazilian Society of Electromagnetism-SBMag © 2014 SBMO/SBMag ISSN 2179-1074
Fig. 1. Illustration of FBG characteristics and optical signals in the interrogation.
The intensity of the reflected spectrum, RFBG( ) as a function of wavelength (it will be shown as a
function of time that is proportional to wavelength) is characterized by a peak reflectivity RG and the
spectrum peak position in wavelength, G, which in a quasi-distributed sensor has the same behavior
as the B.
A change in refractive index caused by a mechanical perturbation in the fiber is associated with the
photo-elastic effect in the sensor, (related to the photo-elastic constant pe), whereas the thermal
perturbation in the fiber can also be caused by its expansion related to the thermal expansion
coefficient Λ and a change in the refractive index that has a dependence with temperature by the
photo-thermal effect associated with the coefficient n. The shift of the Bragg wavelength, B, is due
to the strain and temperature perturbations expressed by Equation 2, where ε and T represent the
applied strain and temperature, respectively.
(
)
(
)
[
e n]
BB
p
ε
α
α
T
λ
λ
=
−
∆
+
+
∆
∆
1
Λ(2)
Since the measurand is directly associated with B in the spectrum of the reflected light, an FBG
interrogation instrumentation must monitor the shift of the Bragg wavelength. In this FBG
interrogation system, an amplified spontaneous emission (ASE) light source is employed together
with a fiber Fabry-Perot (FFP) tunable filter (Micronoptics), in order to offer a narrowband incident
light to the FBGs with a tunable center wavelength. The bandwidth of the filter is 55.8pm, with a
central wavelength depending on the distance of the two mirrors of the Fabry-Perot cavity. The
maximum tuning frequency limits the system, however the signals produced by the FPGA and
mounted electronics can reach higher frequencies. For this purpose, a simple constant used in the
clock division in the VHDL scripts can be changed. In this project, the FFP is tuned by a triangular
voltage waveform whose peak-to-peak amplitude is 3.3 V. The frequency of the triangular wave may
be adjusted from 20 to 50 Hz for this FFP, while the DC offset of the tuning voltage can be adjusted
from 0 to 9.6 V. The tuning resolution of the piezoelectric actuator of the FFP filter is 4.1 nm/V, with
a free spectral range of 49.2 nm. The FFP has built-in temperature compensation, provided by
negative thermal coefficients of expansion of the internal material. Also, the effects of the hysteresis
exhibited by the FFP were reduced by using only the signals acquired during the first half (rising
Brazilian Microwave and Optoelectronics Society-SBMO received 24 Feb 2014; for review 26 Feb 2014; accepted 24 July 2014 Brazilian Society of Electromagnetism-SBMag © 2014 SBMO/SBMag ISSN 2179-1074 The FBGs in this project have a FWHM (Full-spectral width at half maximum) of approximately
208 pm, relatively greater than the FWHM of the FFP filter. The resulting photo-detected spectrum
would have a FWHM of 263.8 pm. To illustrate the modeling of the photo-detected signal, the
transmitted light intensity by the FFP filter, RFFP( ), must be integrated.
The photo-detected signal reflected by an FBG sensor illuminated by the output of the FFP filter
can be represented by the overlap integral of RFBG( ) and RFFP( ). The resulting photo-detected signal
has a peak wavelength that follows the Bragg wavelength of the sensor, and the signal profile has
approximately the same shape of the FBG reflectivity spectrum.
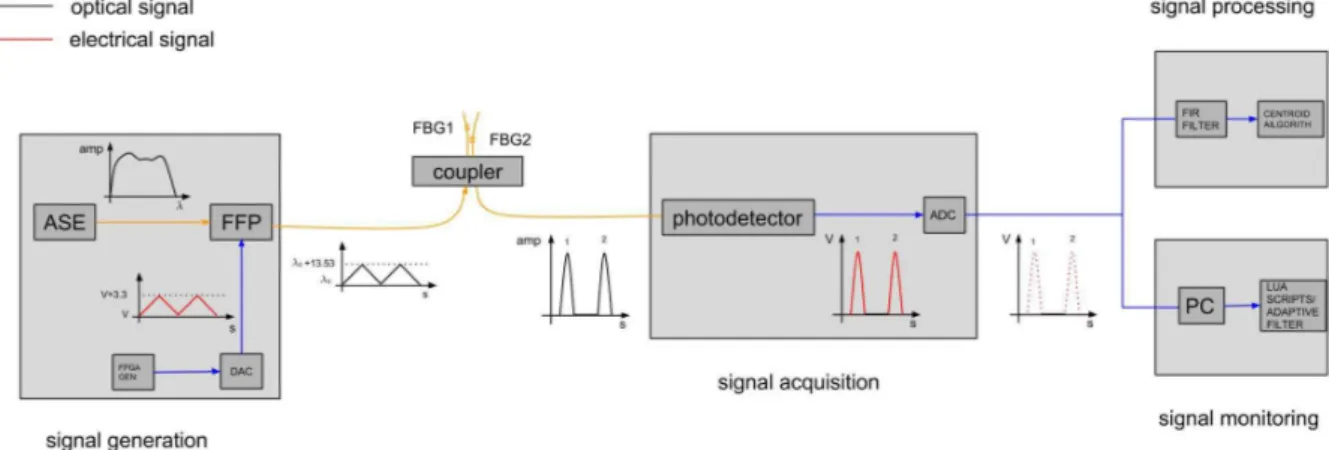
In the used experimental optical setup, Fig. 2 shows the data flow of the proposed interrogation
system of the FBG sensors, with the use of an ASE light source and FFP tunable filter. As shown in
Fig. 2, the optical signal is represented in color orange whereas the electric signal is represented in
color blue. The tunable light signal varies with time/wavelength and is the incident light into 2 FBGs
(with Bragg wavelengths at 1540 nm and 1542 nm).
Fig. 2. Schematic diagram of the interrogation system showing the dataflow in the system – orange lines indicate optical fiber connections and blue lines indicate electrical connections.
Fig. 2 shows also the schematic diagram of the proposed interrogation system. Since each block
contains one digital circuit, the FPGA covers the whole system at each task of signal processing,
while the development is based on the Xilinx Spartan 6 LX 16 FPGA and was chosen to generate the
digital tuning signal, together with its DC offset as illustrated in the diagrammatic signal in the box
‘signal generation’. A 12-bit digital-to-analog converter (DAC) PmodDA2 (Digilent Inc.) converts
these two digital signals which are then treated with instrumentation operational amplifier circuits to
analog voltages for the FFP filter. The light source is then directed to an optical coupler to illuminate
the FBGs. Each FBG is characterized at different Bragg wavelengths usually in the experimental case
over wavelengths from 1520 nm to 1570 nm. The signal reflected by the FBGs is photo-detected and
Brazilian Microwave and Optoelectronics Society-SBMO received 24 Feb 2014; for review 26 Feb 2014; accepted 24 July 2014 Brazilian Society of Electromagnetism-SBMag © 2014 SBMO/SBMag ISSN 2179-1074 produces the digital signal to be processed by the FPGA.
The FPGA employed in this project is mainly used to produce the following digital circuits,
synchronized by the FPGA’s crystal clock of 100 MHz:
• Digital signal generator, which produces the tuning signal and a DC offset signal for the FFP
filter.
• D/A controller to generate the analog tuning signal, combined with a look-up table (LUT) circuit
for calibration.
• A/D controller to acquire the photo-detected signal.
• Data processing circuit that implements peak detection algorithms for the acquired data.
• Visualization circuit that shows the detected peak or peak difference in the 4 seven segment
displays, adapted from standard circuits proposed in the literature [16].
• Serial communication circuit that transmits entire spectra to a computer, also adapted from
standard circuits proposed in the literature [16].
• Auxiliary circuits for the system configuration, such as the debouncing circuits for switches and
buttons, as well as the selection of reference FBG and sensor FBG, the frequency of tuning signal and
its DC offset, and the detection algorithm, which were adapted from the literature for the used digital
circuit [16].
B. Peak detection algorithms
When considering the described algorithms, one way to monitor the wavelength shifts in an FBG
sensor is by monitoring its reflective spectrum peak. Due to the presence of optical and electrical
noise, quantization error, and non-uniform perturbations, the signal peak cannot be precisely
determined just by searching for the largest value point in the acquired signal.
To solve this problem, the peak must be computed using more robust algorithms such as the
centroid computation [17], filtering the signal with digital filters [18], or using specially developed
artificial neural networks [17], [19], to name a few. Some peak detection methods, such as the ones
based on artificial neural networks, as seen on [17], [19], are not promptly suitable for implementation
in digital circuits due to its complexity and numerical precision requirements. Other methods, such as
filtering the signal with a finite impute response (FIR) filter or by computing the signal centroid are
more practical even in the case of the centroid that uses division arithmetic.
The interrogation system developed in this work implements two different peak detection
algorithms. The first one (method A) is based on the centroid computation, whereas the second one
(method B) uses FIR filtering. These methods have different characteristics [17], and can be used
depending on the application requirements, being selected by switches in the used development kit.
Brazilian Microwave and Optoelectronics Society-SBMO received 24 Feb 2014; for review 26 Feb 2014; accepted 24 July 2014 Brazilian Society of Electromagnetism-SBMag © 2014 SBMO/SBMag ISSN 2179-1074 such as to allow a freedom to change the FPGA without the need to rewrite or instantiate new
components for each used chip.
The method A identifies the spectral region belonging to each FBG sensor. The centroid of each
region is computed, estimating its peak wavelength. To avoid the noise and distortions in the light
spectrum to be erroneously detected as an FBG reflected spectrum, a rising and a falling threshold are
used. The falling threshold is equal to the mean level of the signal, with the rising threshold being the
falling threshold plus a constant value. A spectrum region is identified as an FBG reflection if its
amplitude passes the rising threshold and then goes below the falling threshold.
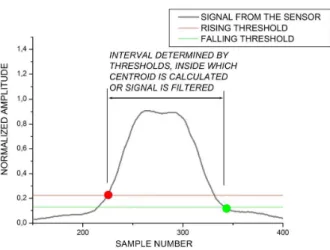
When a spectrum region is identified, its centroid is computed using all the points between the first
point where the signal passes the falling threshold and the last point where the signal is higher or
equal to the same falling threshold. An example of this procedure is shown in Fig. 3, where the rising
and falling threshold are identified by the two horizontal lines and the spectral regions identified as
FBG responses are marked with a distinguished wavelength interval. The thresholds are calculated
only once when the system is turned on.
The centroid of the recognized region is computed by using Eq. 3, where M is the number of
points in the spectral selected wavelength region between thresholds, i is the wavelength at the i-th
point and s[i] is the amplitude at the i-th point. The centroid has the same behavior of the peak
wavelength for the FBG sensor. This procedure continues to be performed on the remaining spectrum
points to detect any other FBG signal present in the spectrum.
Fig. 3Illustrative spectrum of an acquired signal and the process to establish the evaluated interval. The red mark indicates when the spectrum signal is high enough to be considered an FBG response, and the falling threshold (green mark) indicates when the signal is low enough to end the FBG calculated signal. The interval to be filtered is between these points.
= =
=
Mi M
i i
B
i
s
i
s
1 1
]
[
]
[
λ
Brazilian Microwave and Optoelectronics Society-SBMO received 24 Feb 2014; for review 26 Feb 2014; accepted 24 July 2014 Brazilian Society of Electromagnetism-SBMag © 2014 SBMO/SBMag ISSN 2179-1074 The method A was implemented in a digital circuit on the FPGA, by using a finite state machine
approach. The falling threshold was calculated as the mean level of the signal, and the rising threshold
was the falling threshold plus a constant.
For the method B, initially, the whole acquired light spectrum is filtered by an FIR filter, the FBG
responses are identified in the same manner as in method A, with the peaks being computed by a
search for the peak point with highest amplitude rather than with computing the centroid. In this work
a low-pass type I FIR filter was designed based on the Fourier analysis of the acquired signal
spectrum. The filter is recorded in a vector with 31 coefficients calculated by a least-squares design
technique [20] and is kept in the FPGA memory [21] by using a transposed parallel topology. The
vector of filter coefficients is symmetric such as to produce a linear phase [20], in a way that the
number of required multipliers in the FPGA could be halved by reusing all but the last multiplier of
the filter coefficients, ki, to the input samples, s[n].The filter output is mathematically calculated as
the convolution summation in the time domain as in Eq. 4:
y[n]=
∑
iN=−01s[n−i]ki
(4)
Where N = 31 is the order of the used filter, and y[n] is the resulting filtered sample of the spectrum
[17]. The peak detection is applied to the filter output samples.
C. Calibration procedures
It was noticed that the intrinsic behavior of the output signal from the employed DA converter was
distorted, preventing the generation of a linear tuning signal. This incorrect tuning signal increases the
system uncertainty if not properly compensated. And this is a problem that must be addressed in any
system that uses a sweeping signal to drive a tunable laser or filter. In this work a calibration
procedure that uses an additional lookup table (but no analog hardware) is proposed.
Firstly, the calibration procedure is composed of repeated iterations with a lookup table that
contains the original discrete-time signal (i.e., a rising ramp). The FPGA periodically generates a
digital ramp signal with the current lookup table contents that are then converted by the digital to
analog converter. The resulting signal is acquired by a high resolution oscilloscope and then compared
to the desired signal. The difference between those signals is multiplied by 0.7 (damping) and then
added to the lookup table to compensate the error. The procedure requires the computation of the error
at each point and tries to compensate it. The damping factor is needed to avoid an overshoot, as the
converter has a non-linear response. The procedure keeps performing iterations until a stop criterion is
satisfied. In this work, at the end of each iterating process, the mean absolute error (MAE) is
computed. If the difference between the current MAE and the one from the last iteration is smaller
than 1 least significant bit (LSB), or the MAE is itself less than 1, then convergence is reached and the
Brazilian Microwave and Optoelectronics Society-SBMO received 24 Feb 2014; for review 26 Feb 2014; accepted 24 July 2014 Brazilian Society of Electromagnetism-SBMag © 2014 SBMO/SBMag ISSN 2179-1074 D. Experiments
Two experiments have been performed. The first one exemplifies the proposed calibration
procedure, where the tuning signal generator is iteratively adjusted to attenuate the non-linearity
errors. It followed the exact same procedures described in Section II-C. The calibrated system was
then used in the second experiment. The second experiment consisted of using the developed system
to interrogate two FBG sensors, measuring the temperature of a calibrated water-bath. One sensor was
immersed into a recipient with at least 150 ml of water, and the other one was kept away at
environment temperature to serve only as a reference. This configuration is used to compensate
systematic errors. The water sample was heated to approximately 80 °C, and let to cool until reaching
the room temperature (±24.5 °C). During this cooling time, 9 measurements were performed along the
temperature range (cold water was added after each measurement to reduce the cooling time). The
differences between the FBG peaks, shown at the system display, were also recorded in a personal
computer using an open source scripting language, namely, Lua scripts [23], that acquired and process
the data for visualization. Additionally, 30 full spectra were recorded in a computer at each
measurement for later computation of the uncertainty. The room temperature was controlled at
24.5 °C, and two digital thermometers were used as references with uncertainty of ±0.2 °C, one to
measure the temperature of the sample and another to measure the room temperature. The changes in
the room temperature were compensated, as both FBGs have the same temperature sensitivity. The
centroid algorithm was used to compute the FBG reflection peaks. The whole procedure was repeated
3 times (intermediate precision condition), within four hours. By using the acquired data it was
possible to compute the system uncertainty following the procedures given in [15].
III. RESULTS
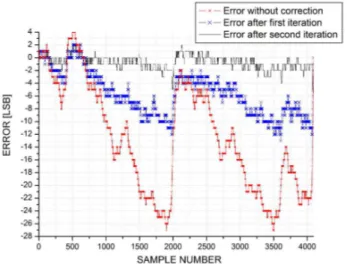
The error behavior in the calibration procedure can be seen in Fig. 4, where the MAE is reduced
after each iterating step until convergence is reached. Initially, the MAE is equal to 13.05 LSB. After
the first iteration it dropped to 5.84 LSB, reaching 0.99 LSB after the second iteration. The results of
the three full range temperature measurements are shown in Fig. 5, where the temperature read by the
digital thermometer is compared to the temperature estimated by the system. A line is fitted to the
measured points and then the temperature is estimated from the resulting curve. The system resolution
from these data is 0.33 °C. In the first measurement, the root mean square (RMS) of the residuals is
equal to 0.66 °C. In the second and third measurements, the RMS of the residuals is equal to 0.49 °C
Brazilian Microwave and Optoelectronics Society-SBMO received 24 Feb 2014; for review 26 Feb 2014; accepted 24 July 2014 Brazilian Society of Electromagnetism-SBMag © 2014 SBMO/SBMag ISSN 2179-1074
Brazilian Microwave and Optoelectronics Society-SBMO received 24 Feb 2014; for review 26 Feb 2014; accepted 24 July 2014 Brazilian Society of Electromagnetism-SBMag © 2014 SBMO/SBMag ISSN 2179-1074
Fig. 5. Results of the three temperature measurement experiments.
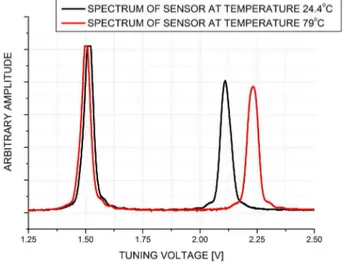
As an example, Fig. 6 shows two spectra acquired at different temperatures (24.5 °C) and (79 °C) in
the same experiment. These spectra were made accessible to a computer via serial communication.
Each spectrum in Fig. 6 is formed by the reflected signal from the reference FBG (peak close to
shorter wavelengths), and from the FBG immersed in the water sample (peak in longer wavelengths).
The change in the distance between the peaks of the reflected spectrum is proportional to the
temperature change.
The instrumentation characteristics of the system made by the developed optical interrogator and
the FBGs are shown in Table I, following the guidelines and terms in [15]. The uncertainties
enumerated in Table I have been combined, resulting in an expanded uncertainty of ±1.45 °C for a
68.26% confidence interval. The parameters that characterize the performance of the instrumentation
Brazilian Microwave and Optoelectronics Society-SBMO received 24 Feb 2014; for review 26 Feb 2014; accepted 24 July 2014 Brazilian Society of Electromagnetism-SBMag © 2014 SBMO/SBMag ISSN 2179-1074 and are also shown in Table I, where ν ν ν νis the number of degrees of freedom (number of repetitions
minus one for the statistical parameters). The statistical parameters are gathered in a type A set, and
engineering related parameters are classified as type B [15].From those calculations, the uncertainties
were combined, producing an expanded uncertainty.
Fig. 6. Sample spectra acquired in the temperature measuring experiment via serial communication.
If the resolution had been calculated based only on the DAC resolution, the minimum obtained
wavelength resolution value would be 3.3 pm, which was a consequence of the (12-bit) 4096
wavelength acquired points in the configurable wavelength range for the tuning voltage amplitude.
From the resolution obtained together with the evaluation of the sensor behavior, the metrological
characteristics are also depicted based on the temperature sensitivity for the used FBG, which was
13.6 pm/°C.
TABLE I. METROLOGICAL CHARACTERISTICS OF THE TEMPERATURE SENSING EXPERIMENT
Characteristic Type Uncertainty [°C and Wavelength(pm)] ν ν ν ν (degrees of freedom)
Resolution B 0.19°C (2.6pm)
Repeatability A 0.37°C (5.0pm) 29
Intermediate precision A 1.04°C (14.1pm) 2
Conformity B 0.58°C (7.9pm)
Calibration B 0.12°C (1.6pm)
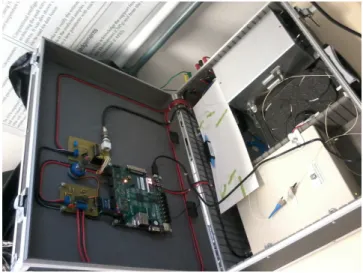
For illustration purposes of the implemented system, a photo of the interrogation system ready to be
used in the field is depicted in Fig. 7. The interrogation of an acetylene cell to determine the
wavelength reference of each sample point is depicted in Fig. 8. It is worth mentioning that due to
reflections at the FFP mirrors, the acetylene cell and connectors in the fiber optic circuit, the spectrum
obtained by the system is distorted. The interference from those reflective points deteriorates its
Brazilian Microwave and Optoelectronics Society-SBMO received 24 Feb 2014; for review 26 Feb 2014; accepted 24 July 2014 Brazilian Society of Electromagnetism-SBMag © 2014 SBMO/SBMag ISSN 2179-1074 distortions. The signal in Fig. 8 was processed with the adaptive filter in a Lua script and had its
wavelength scale converted to wavelength units by using tabulated values of the acetylene absorption
spectrum from the literature, also measured with an optical spectrum analyzer (ANRITSU
MS9740A).
Fig. 7. Picture of the interrogation system as in field operation, while interrogating the acetylene cell.
Fig. 8. Absorption spectrum obtained from the interrogating system while analyzing an acetylene cell. Dips in the acquired spectrum from an acetylene cell illuminated with the ASE source and the two dips in the signal (P7 and P9 Branch)
used as known wavelength references to calculate the P8 Branch of the gas [22] and convert the scale to wavelength units.
Brazilian Microwave and Optoelectronics Society-SBMO received 24 Feb 2014; for review 26 Feb 2014; accepted 24 July 2014 Brazilian Society of Electromagnetism-SBMag © 2014 SBMO/SBMag ISSN 2179-1074 The results seen on Fig. 5 show that the proposed calibration procedure reduces the non-linearity
errors that are initially present in the employed digital to analog converter. This error reduction allows
one to illustrate how important this compensation becomes when one observes the system uncertainty
using the original non-linearity error, which can reach about 25 LSBs that would correspond to8 °C
after conversion to the measurand units. The proposed method can be employed in other applications
that use DA converters, as is the case of most interrogation systems based on a DSP or an FPGA.
In the second experiment results, shown in Fig. 5, it can be seen that the system responds linearly
with the temperature change, as expected. Among the enumerated characteristics (Table I), the
intermediate precision condition resulted in the highest contribution to the computed uncertainty of
±1.45 °C. This can be explained partially by the lack of packaging in the FBG sensors, allowing them
to be sensitive to mechanical disturbances as well.
It is important to note that on the second experiment two FBG sensors are simultaneously
interrogated, one being used only as a reference. Most of the systematic errors caused by the heating
of the environment and analog circuits (D/A, A/D, and the photo-detection circuit) and other
phenomena are partially compensated, since they would shift the detected FBG spectra in the same
way. The shift in the FBGs signals seen in Fig. 6 shows the spectrum for two different temperatures.
Nevertheless, as both FBG sensors were not encapsulated, both of them were sensitive to
mechanical disturbances during the experiment. Besides, as the reference sensor is sensitive to
temperature changes, the room temperature had to be maintained constant, otherwise it would increase
the measurement errors. For field applications another interrogation scheme is needed, either by using
only one FBG sensor or by using a reference that is not sensitive to temperature changes.
The maximum number of multiplexed FBG sensors that can be interrogated in this project is not
limited by the data processing algorithms. In the experiments performed here the FFP filter is tuned to
interrogate a spectral range of 15 nm. Assuming that each FBG signal has an operating range of
2.5 nm in this configuration the system could interrogate up to 6 FBGs. This limit could be increased
by interrogating a wider wavelength range, limited by the converters resolution and by the employed
FFP. The system can currently perform a maximum of 50 full spectrum readings per second. This
interrogation rate is mainly limited by the D/A and A/D converters, and by the FFP filter. If the
converters could perform a conversion in a single clock cycle of the FPGA crystal and the FFP filter
should not impose a frequency restriction, by maintaining a resolution of 12 bits in the generation of a
triangular tuning signal, the system would be able to acquire up to 12000 spectra per second with a
wavelength tuning range equal to the free-spectral range of the used FFP. Users can apply the
available VHDL files to test it in different optical circuits, FFPs or different applications.
With respect to the commercial equipments, the interrogated band is within the telecommunications
Brazilian Microwave and Optoelectronics Society-SBMO received 24 Feb 2014; for review 26 Feb 2014; accepted 24 July 2014 Brazilian Society of Electromagnetism-SBMag © 2014 SBMO/SBMag ISSN 2179-1074 range of the FFP must also be configured for this interval. The wavelength resolution of commercial
equipments is usually in the range of 1pm, that is comparable to the resolution obtained with the
proposed equipment. The tuning frequency can reach higher values than the standard commercial
values in interrogation systems in the range of tens of Hertz up to kilohertz.
In the case of the optical spectrum analysis of an acetylene cell, the results allow one to determine
the wavelength references in the time scale of the acquired data, which would be otherwise
represented by sample points or time units. From those results, the system can operate with a proper
wavelength scale with an error depending on the electronics resolution and linearity of the DAC
component. The wavelength dips in the spectrum were measured in sample numbers and converted to
wavelength units by using two known and well defined dips [22], in this case P7 and P9 branches of
the absorption spectrum of the acetylene. The error between the calculated dips (P8 shown in Fig. 8)
and the tabulated P Branches measured by the absorption spectrum of the acetylene cell were kept
below 25 pm on average along the wavelength interval that the DAC has a linear response. The
published value for the P8 dip is 1529.7723 nm. Such results allow one to use the interrogation system
as a low cost optical spectrum analyzer with absolute wavelength references. It is also important to
notice that the wavelength interval that may be interrogated covers approximately 50nm, which
allows the user to interrogate fiber sensors like fiber Bragg gratings or long period gratings.
V. CONCLUSIONS
This work reported the development of an FBG interrogation system, based on digital circuits
implemented in an FPGA board. The system implements the tunable filter method by using an FFP
filter, combined with a broadband light source. By using this scheme and specialized peak detection
algorithms, the system can interrogate multiplexed FBG sensors. The full hardware description is
publicly available under an open source license (GPLv3+) [14].
Data processing algorithms were implemented in the FPGA, based on the centroid computation and
on FIR filtering. The implemented methods due to their nature, can process any number of sensors
without additional computation cost. Thus, the data processing does not affect the maximum number
of interrogated FBG sensors. It was detected that the employed D/A converter had non-linearity
errors. This fact led to the proposal of a new calibration system, allowing the non-linearity errors to be
iteratively reduced. This type of non-linearity errors can be found in other applications that involve
D/A converters, specially other optical interrogation systems that use the tunable filter method with
digital circuitry. The system was used to measure the temperature of a water sample. Repeated
measurements were conducted to verify the system operation and determine its uncertainty, based on
metrology guidelines. In this temperature sensing experiment, the system uncertainty was 1.45 C.
The addition to the system of a temperature insensitive wavelength reference, like the acetylene cell
Brazilian Microwave and Optoelectronics Society-SBMO received 24 Feb 2014; for review 26 Feb 2014; accepted 24 July 2014 Brazilian Society of Electromagnetism-SBMag © 2014 SBMO/SBMag ISSN 2179-1074 absolute wavelength reference and allowing its use as an optical spectrum analyzer.
VI. ACKNOWLEDGMENTS
The authors gratefully acknowledge the support received from the CNPq and CAPES.
REFERENCES
[1] G. Meltz, W. W. Morey, and W. H. Glenn, “Formation of Bragg gratings in optical fibers by a transverse holographic method,” Optics Letters, vol. 14, no. 15, pp. 823–825, Aug 1989. [Online]. Available: http://ol.osa.org/abstract.cfm?URI=ol-14-15-823
[2] J. Canning, “Fibre gratings and devices for sensors and lasers,” Laser and Photonics Reviews, vol. 2, no. 4, pp. 275– 289, 2008. [Online]. Available: http://dx.doi.org/10.1002/lpor.200810010
[3] W. W. Morey, J. R. Dunphy, and G. Meltz, “Multiplexing fiber Bragg grating sensors,” Fiber and Integrated Optics,
vol. 10, no. 4, pp. 351–360, 1991. [Online]. Available:
http://www.tandfonline.com/doi/abs/10.1080/01468039108201715
[4] A. Othonos and K. Kalli, Fiber Bragg Gratings: Fundamentals and Applications in Telecommunications and Sensing. Artech House, 1999.
[5] K. O. Hill, Y. Fujii, D. C. Johnson, and B. S. Kawasaki, “Photosensitivity in optical fiber waveguides: Application to reflection filter fabrication,” Applied Physics Letters, vol. 32, no. 10, pp. 647–649, 1978. [Online]. Available: http://link.aip.org/link/?APL/32/647/1
[6] A. D. Kersey, T. A. Berkoff, and W. W. Morey, “Fiber-optic Bragg grating strain sensor with drift-compensated highresolution interferometric wavelength-shift detection,” Optics Letters., vol. 18, no. 1, pp. 72–74, Jan 1993. [Online]. Available: http://ol.osa.org/abstract.cfm?URI=ol-18-1-72
[7] K. Schroeder, W. Ecke, R. Mueller, R. Willsch, and A. Andreev, “A fibre Bragg grating refractometer,” Measurement Science and Technology, vol. 12, no. 7, pp. 757–764, Jul. 2001. [Online]. Available: http://iopscience.iop.org/0957-0233/12/7/301 http://stacks.iop.org/0957-0233/12/i=7/a=301?key=crossref.f2660896ce285faccb053134e10b74ef [8] A. D. Kersey, T. A. Berkoff, and W. W. Morey, “Multiplexed fiber Bragg grating strain-sensor system with a fiber
Fabry - Perot wavelength filter,” Optics Letters., vol. 18, no. 16, p. 1370, Aug. 1993. [Online]. Available:http://www.ncbi.nlm.nih.gov/pubmed/19823386
[9] L. Zhang, Y. Liu, J. Williams, and I. Bennion, “Enhanced FBG strain sensing multiplexing capacity using combination of intensity and wavelength dual-coding technique,” IEEE Photonics Technology Letters, vol. 11, no. 12, pp. 1638 – 1640, dec. 1999.
[10]C. Shi, C. Chan, W. Jin, Y. Liao, Y. Zhou, and M. Demokan, “Improving the performance of a FBG sensor network using a genetic algorithm,” Sensors and Actuators A: Physical, vol. 107, no. 1, pp. 57 – 61, 2003. [Online]. Available: http://www.sciencedirect.com/science/article/pii/S0924424703003236
[11]W. R. Allan, Z. W. Graham, J. R. Zayas, D. P. Roach, and D. A. Horsley, “Multiplexed Fiber Bragg Grating Interrogation System Using a Microelectromechanical Fabry-Perot Tunable Filter,” IEEE Sensors Journal, vol. 9, no. 8, pp. 936–943, Aug. 2009. [Online]. Available: http://ieeexplore.ieee.org/lpdocs/epic03/wrapper.htm?arnumber=5153585 [12]S. Schultz, W. Kunzler, Z. Zhu, M. Wirthlin, R. Selfridge, A. Propst, M. Zikry, and K. Peters, “Full-spectrum interrogation of fiber Bragg grating sensors for dynamic measurements in composite laminates,” Smart Materials and Structures, vol. 18, no. 11, p. 115015, Nov. 2009. [Online]. Available: http://stacks.iop.org/0964-1726/18/i=11/a=115015?key=crossref.ebe9cc6df6a6e6680a4a8e679a74abac
[13]Z. Zhou, Q. Liu, Q. Ai, and C. Xu, “Intelligent monitoring and diagnosis for modern mechanical equipment based on the integration of embedded technology and FBGS technology,” Measurement, vol. 44, no. 9, pp. 1499–1511, Nov. 2011. [Online]. Available: http://linkinghub.elsevier.com/retrieve/pii/S0263224111001746
[14] “VFBI - VHDL FBG interrogation,” http://sourceforge.net/p/vhdloptical.
[15]G. R. C. Possetti, R. C. Kamikawachi, M. Muller, and J. L. Fabris, “Metrological Evaluation of Optical Fiber Grating-Based Sensors: An Approach Towards the Standardization,” Journal of Lightwave Technology, vol. 30, no. 8, pp. 1042–1052, Apr. 2012. [Online]. Available: http://ieeexplore.ieee.org/lpdocs/epic03/wrapper.htm?arnumber=6015513 [16]P. P. Chu, FPGA Prototyping By VHDL Examples. John Wiley and Sons, 2008.
[17]L. H. Negri, A. Nied, H. Kalinowski, and A. S. Paterno, “Benchmark for Peak Detection Algorithms in Fiber Bragg Grating Interrogation and a New Neural Network for its Performance Improvement,” Sensors, vol. 11, no. 4, pp. 3466– 3482, Mar. 2011. [Online]. Available: http://www.mdpi.com/1424-8220/11/4/3466/
[18]C. C. Chan, W. Jin, and M. Demokan, “Enhancement of measurement accuracy in fiber Bragg grating sensors by using digital signal processing,” Optics & Laser Technology, vol. 31, no. 4, pp. 299 – 307, 1999. [Online]. Available: http://www.sciencedirect.com/science/article/pii/S0030399299000717
Brazilian Microwave and Optoelectronics Society-SBMO received 24 Feb 2014; for review 26 Feb 2014; accepted 24 July 2014 Brazilian Society of Electromagnetism-SBMag © 2014 SBMO/SBMag ISSN 2179-1074 5, pp. 1039–1045, May 2006. [Online]. Available: http://stacks.iop.org/0957-0233/17/i=5/a=S17?key=crossref.392f288e94e491dd60d1f3899bb2c801
[20]J. G. Proakis and D. K. Manolakis, Digital Signal Processing, 4th ed. Prentice Hall, Apr. 2006.
[21]R. Woods, J. Mcallister, R. Turner, Y. Yi, and G. Lightbody, FPGA-based Implementation of Signal Processing Systems, Wiley Publishing, 2008.
[22]C-Band Wavelength Calibrator Acetylene Gas Cell – Datasheet C2H2-12-H(5.5)-200-FCPC, Wavelength References, Inc.