J. Microw. Optoelectron. Electromagn. Appl. vol.10 número1
Texto
Imagem
![Fig. 2. Principle of the Enhanced Maseng-Bakken model [9].](https://thumb-eu.123doks.com/thumbv2/123dok_br/18887519.424178/2.892.183.698.1014.1115/fig-principle-enhanced-maseng-bakken-model.webp)


Documentos relacionados
4 depicts the BER as function of the modulation index considering the transmission of two OFDM-UWB signals located in two different UWB sub-bands and for two different lengths of SSMF
This paper presents a dynamic model of a wind turbine equipped with a transverse flux permanent magnet generator connected to a direct-current power system using
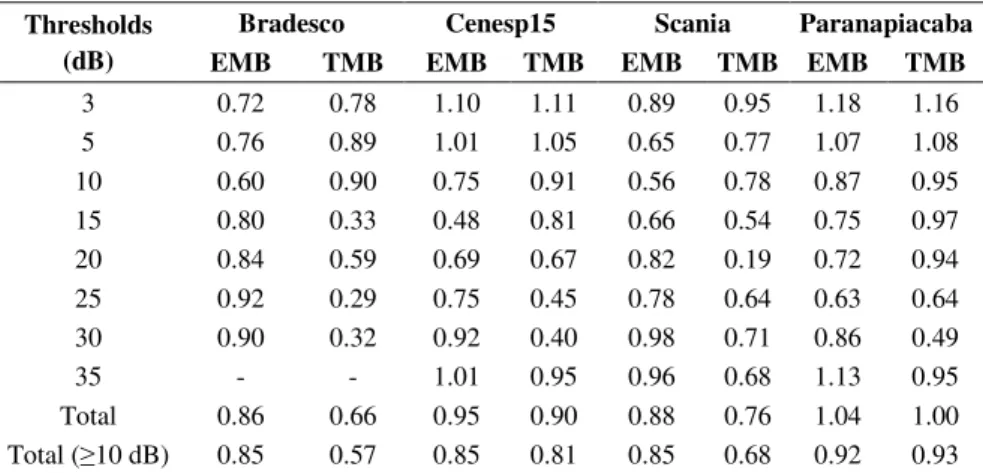
Comparison Between Known Propagation Models Using Least Squares Tuning Algorithm on 5.8 GHz in Amazon
Taken into account the critical current value of thick film as compared with the bulk sample, it was suggested that the procedure described here can be applied
Simulated (dashed line) and measured (continuous line) averaged 900 MHz vertically polarized power delay profile (LOS) The distance between antennas is 50 m. Simulated (dashed
Abstract — This paper presents a qualitative analysis of the impact caused by fiber propagation effects and by a cascade of optical filters, designed for 10 Gb/s NRZ
techniques for optical dual-polarization quadrature phase-shift keying (DP-QPSK) coherent receivers, using offline post-processing of experimental data.. In addition to
The proposed encoding scheme uses spline approximations in order to build softened refractive index profiles from few encoded parameters.. This approach is
