Abstract— In this paper, we propose a hybrid methodology based
on Graph-Coloring and Genetic Algorithm (GA) to solve the Wavelength Assignment (WA) problem in optical networks, impaired by physical layer effects. Our proposal was developed for a static scenario where the physical topology and traffic matrix are
known a priori. First, we used fixed shortest-path routing to attend demand requests over the physical topology and the graph-coloring algorithm to minimize the number of necessary wavelengths. Then, we applied the genetic algorithm to solve WA. The GA finds the wavelength activation order on the wavelengths grid with the aim of reducing the Cross-Phase Modulation (XPM) effect; the variance due to the XPM was used as a function of fitness to evaluate the feasibility of the selected WA solution. Its performance is compared with the First-Fit algorithm in two different scenarios, and has shown a reduction in blocking probability up to 37.14% when considered both XPM and residual dispersion effects and up to 71.42% when only considered XPM effect. Moreover, it was possible to reduce by 57.14% the number of wavelengths.
Index Terms— Cross-Phase Modulation, Dense Wave Division Multiplex, Evolutionary Computation, Wavelength Assignment Algorithms.
I. INTRODUCTION
Optical network based on Dense Wave Division Multiplex (DWDM) has been considered as a
mature technology to be used in the backbone of optical networks. However, finding an optical
solution for Routing and Wavelegnth Assintment (RWA) algorithm in the design and operation of the
networks remains an open issue. One of the ways to simplify the RWA problem is to decompose it
into two sub-problems: (i) Routing (R), and (ii) Wavelength Assignment (WA). RWA can be solved
either offline (static case) or online (dynamic case).
A static solution occurs during the Wave Division Multiplex (WDM) network design phase while a
dynamic RWA when the network is in operation. WDM network design is based on traffic forecasts
where the traffic matrix is known in advance. The most common objective for a static solution is to
minimize the network resources needed to support a given traffic matrix, e.g., the number of
Wavelength Assignment Using a Hybrid
Evolutionary Computation to Reduce
Cross-Phase Modulation
André M. L. Miranda1,2, Fabio de O. Lima3, Helder R. de O. Rocha3, Nadamudi Vijaykumar4, Carlos R. L. Francês1, Marcelo E. V. Segatto3 and João C. W. A. Costa1
1Federal University of Pará, Av. Augusto Correa, 01, CEP 66075-110, Belém, PA, Brazil 2Federal Institute of Pará, Av. João Paulo II , S/N, CEP 66610-770, Belém, PA, Brazil 3Federal University of Espírito Santo, Av. Fernando Ferrari, 514,CEP
29075-910, Vitória, ES, Brazil
4National Institute for Space Research, Av. dos Astronautas, 1758, CEP 12227-010, S.J. dos Campos, SP, Brazil
wavelengths used, or the number of fiber links traversed by the lightpaths. In the case of dynamic
solution, the main objective is to minimize the blocking probability at the arrival of a connection
request [1]. All these aspects make the RWA a NP-complete problem [2].
The algorithm has to consider another aspect which is the impact of physical layer impairments
(PLIs). These algorithms are known as IA-RWA (Impairment Aware Routing and Wavelength
Assignment) and their function is to ensure that the received signal quality is acceptable. The physical
impairments affecting the quality of signals in an optical network can be divided into linear and
nonlinear. Linear impairments affect each channel individually and do not depend on the signal
power. On the other hand, nonlinear impairments not only impact each channel individually but also
interfere with those channels with which they share the same optical fiber and/or optical component.
The effect of nonlinear impairments is crucial at high bit rates, i.e., above 10 Gbit/s, and/or at high
signal power [1].
Some of the most important linear impairments are: Amplified Spontaneous Emission (ASE) noise,
Chromatic Dispersion (CD) and Polarized Mode Dispersion (PMD) [3], [4], and the accumulation of
these impairments are directly proportional to the length of the link [5]-[8]. Hence, choosing the
shortest route can reduce these impairments. Conversely, the most important nonlinear physical
impairments are: Self-Phase Modulation (SPM), Cross-Phase Modulation (XPM) and Four-Wave
Mixing (FWM) [3], [4]. However, Ten et al. [9] compared FWM and XPM penalties for a 40 x 10
Gb/s system with channel spacing of 100 GHz where they found that the degradation of the optical
signal affected by XPM is several times greater than that of FWM [9]. This is the reason that our
proposal limits to minimize XPM effect, as this non-linear impact is the one that dominates the
scenario presented in our paper.
Literature presents several analytical models to compute XPM. In [10] the authors studied the
spectral characteristics of XPM in multi-span optical systems and found that per span dispersion
compensation is the most effective way to minimize its effect. In [11], a generalized model of the
XPM degradation in fiber links consisting of multiple fiber segments with different characteristics and
optical amplifiers is presented. It has also been shown that the total XPM-induced by intensity
modulation (IM) is smaller in systems employing distributed dispersion compensation than in systems
employing lumped dispersion compensation. An approach to minimizing setup times in an on-line
provisioning paradigm by using guard bands, i.e., leaving unused wavelength channels between
lightpaths in order to reduce the effect of XPM, is presented in [12]. In [13], a model that includes
statistical estimation of XPM is used instead of an analytical model. It accelerates the computation
time of XPM noise, but obtains an error of up to 6%. Even though analytical models are
computationally more time consuming than the statistical estimation model, in certain situations it is
preferable to use the analytical model because it is more accurate, as is the case when designing a
network where time is not a crucial factor.
physical topology and traffic matrix are known a priori. For the routing sub-problem, we used the
Dijkstra algorithm [14] to find the shortest-path between a given source and destination pair. This
algorithm uses the physical distance metric to evaluate the cost between two given nodes. We chose
this algorithm because a shorter route possibly reduces some effects of the physical layer, such as
ASE noise, PMD, chromatic dispersion and others.
With respect to wavelength assignment sub-problem, an approach to minimize the number of
necessary wavelengths consists in formulating it as a graph-coloring problem [15], [16].
Graph-coloring can be applied to the static case in which all connections and their routes are known in
advance [16]. After setting the number of necessary wavelengths, wavelength, in fact, has to be
assigned. Several heuristics for this purpose have been proposed in the literature. The simplest and
most commonly used among them are: Random, First-Fit (FF) and Most-Used (MU) [16]. However,
these do not always show satisfactory results, especially regarding the quality of transmission, but,
some studies have shown that metaheuristics are viable alternatives to efficiently solve the IA-RWA
problem. The metaheuristics offer near optimal solution, but require a high computation time.
Literature shows instances of works that use metaheuristics to solve the RWA problem taking into
account the linear physical layer impairments [8] and nonlinear physical layer impairments [17]. In
[8], Monoyios and Vlachos proposed genetic algorithms for solving the IA-RWA problem without
taking into account the nonlinear impairments. In [17], Bastos-Filho et al. presented a wavelength
assignment algorithm inspired by evolutionary concepts that considers FWM and residual dispersion,
but does not consider the XPM which can be a dominant nonlinear impairment [9]. Besides, some
other papers also use metaheuristics to attempt to solve the routing and wavelength assignment
problem [3], [18]-[22].
In this paper, the routing sub-problem was solved by Dijkstra algorithm, however, for the
wavelength assignment sub-problem, we decided to develop a new methodology, based on the use of
metaheuristics, since we did not find, in the investigated literature, any WA algorithm that seeks to
reduce the XPM effect. Our approach minimized the total number of wavelengths required for the
network and determined the wavelength activation order to reduce the XPM effect. The remainder of
this paper is organized as follows. In Section II, we present the routing algorithm. Section III presents
the XPM modeling. Section IV describes the proposed methodology and Section V presents the
scenarios description and simulations results. Finally, we present our conclusions and provide future
directions in Section VI.
II. ROUTING SUB-PROBLEM
For a scenario in which both the physical topology and traffic matrix are known a priori, the fixed
routing is one of the most straightforward approaches used for solving the routing sub-problem. In
this approach, the same pre-determined path is always selected as the route for all the connection
based on the shortest-path algorithm that computes the shortest route between a given
source/destination pair. The most used shortest path implementations are based on the Dijkstra
algorithm or Bellman-Ford algorithm [16].
In any shortest-path algorithm there is a cost parameter assigned to each network link. These
algorithms will find a path of a minimum overall cost based on this parameter, corresponding to, for
example: the length of the link, the number of hops, the load on the links or any physical impairment
[23]. In our paper, the length of the link was used as the cost parameter of the shortest-path algorithm,
since the accumulation of physical layer impairments are directly proportional to this metric.
III. CROSS-PHASE MODULATION MODELING
Cross-phase modulation (XPM) is a nonlinear phenomenon that occurs when two or more optical
channels having different wavelengths propagate simultaneously inside an optical fiber. The phase of
each channel is modulated by the intensity modulation (IM) of the other channels. XPM always
accompanies the Self-Phase Modulation (SPM) in a nonlinear multi-wavelength link and it is a result
of change in the effective refractive index of the fiber caused by the intensity of the all of
co-propagating channels [24].
The analytic model developed by Cartaxo et all [25] analyzes the XPM effect in WDM systems
based on intensity modulation and phase modulation. They are at the output of the transmission
system of the channel that is being analyzed, i.e., probe channel (Continuous Wave – CW) and are
caused by one or more interfering channels – pump channels (modulated carriers). The XPM-induced
phase modulations in the probe channel are converted into intensity modulations by GVD and SPM.
This model has been used to assess the influence of SPM and residual dispersion on the XPM-induced
degradation. Cartaxo et all [25] also demonstrated that the influence of SPM cannot be neglected in
the analysis of the XPM in dispersion compensated links but it can be significant.
According to [25] the Q factor is an important figure of merit to analyze XPM-induced power
penalty in Intensity Modulation/Direct Detection (IM-DD) systems and can be written as:
(1)
where is the average optical power at the receiver input, r = P1 / P0 is the extinction ratio , k and ksp
are constants dependent on the receiver type. The power penalty is defined as the ratio between the
required average power at receiver input with and without the influence of XPM and can be expressed
in decibels as [25]:
(2)
where is the variance of the XPM-induced IM normalized, normalized by the square of the power
to a bit-error ratio (BER) of 10-12.
In order to estimate the quality of the transmitted signal normalized, the variance of XPM-induced
IM is employed. The variance shows the statistical dispersion of the power penalty induced by XPM,
indicating how far are the values from the expected ones. can be written as the integral of the
power spectral density (PSD) of the probe channel IM, normalized by the square of the power at the
symbol “1”, as follows [25]:
(3)
where is the average optical power of the probe channel, M is the number of interfering channels,
Sp,j(f) is the power spectral density (PSD) of the j'th pump channel IM at the fiber input, HXPM,P,j(f) and
Hr(f) are the transfer functions of the equivalent linear model (ELM) of the XPM-induced IM
associated with the j'th pump channel and of the electrical receiving filter, respectively.
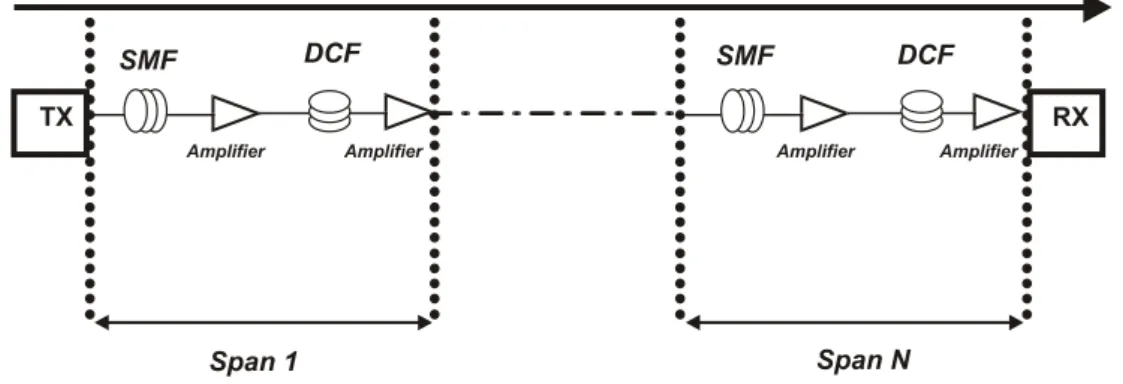
The analytical model for characterizing XPM in multi-span optical systems used in this article,
considers a transmission system, similar to that used in [25], where each section consists of a
single-mode fiber (SMF) segment, followed by a dispersion-compensating fiber (DCF) segment, as shown in
Fig. 1. An optical amplifier following each fiber segment is also considered, and the combined gain of
both amplifiers in each section compensates for the power loss in that section.
Fig. 1. Transmission system multi-span with dispersion compensation
Furthermore, also assumed are: the input power of the DCF segments is low enough to consider
linear transmission, and the average power of the input channels in a determined span have identical
values, regardless of being a probe or pump channel. The transfer functions of the equivalent linear
model of the XPM-induced IM, generated in each span, is given by:
(4)
where superscript (s) represents a span s, subscript (1) represents the first element of the resulting vector
that has size two, subscript (1,1) represents the first element of the matrix. is the product of
relative delays between pump channel j and the probe channel i, is the matrix that converts the
XPM-induced phase and intensity (due to pump channel) into phase and intensity in the probe
the matrix that converts phase and intensity of the pump channel (due to SPM and GVD) along the
optical path. The expressions for each of the described elements of equations (3) and (4), implemented
in our paper, to calculate normalized variance of XPM effect, can be found in [25].
IV. PROPOSED METHODOLOGY
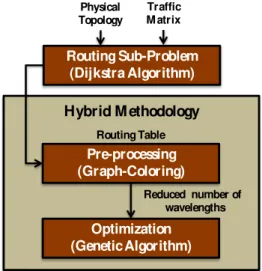
The proposed hybrid methodology consists of a graph coloring algorithm (used as a technique for
pre-processing), followed by a Genetic Algorithm (used as an optimization technique). This
methodology enables to assist in decision-making by network operators of optical transport, with
respect to the wavelength activation order on the wavelengths grid in a given optical network scenario
where the physical topology and traffic matrix are known a priori. However, this methodology should
only be applied after the route is set for each demand contained in the traffic matrix of the network, as
shown in Fig. 2.
Hybrid M ethodology
Optimization (Genetic Algorithm)
Pre-processing (Graph-Coloring) Routing Sub-Problem
(Dijkstra Algorithm) Physical
Topology
Traffic M atrix
Routing Table
Reduced number of wavelengths
Fig. 2. General flowchart of the Proposed Methodology
A. Pre-processing
The pre-processing is the first step of our hybrid methodology. This phase is initiated immediately
once the routes, that will meet the traffic matrix, are defined. The goal is to assist the wavelength
assignment process by minimizing the number of necessary wavelengths, and an appropriate solution
for this purpose is the graph-coloring algorithm [15],[16]. In this algorithm the vertices of the graph
represent the optical paths (routes) and the edges represent the physical connections. The nodes of the
graph must be colored so that each node is assigned to the first color not used by any of its adjacent
nodes, thus minimizing the total number of colors used. For each color, obtained from the resolution
of the graph, a distinct wavelength will be assigned. In our simulations, we could reduce this number
by up to 57.14%.
B. Genetic Algorithm
After reducing the number of wavelengths by graph-coloring algorithm, the genetic algorithm (GA)
is employed to perform an optimization iteratively evaluating the various candidate solutions. The
Chromosome Encoding
Creation of the I nitial Population
Evaluation (Fitness Function)
Crossover M utation
Selection of best chromosome
M aximum Generation
M aximum Cycle
List of best solutions
Yes
Yes No
No
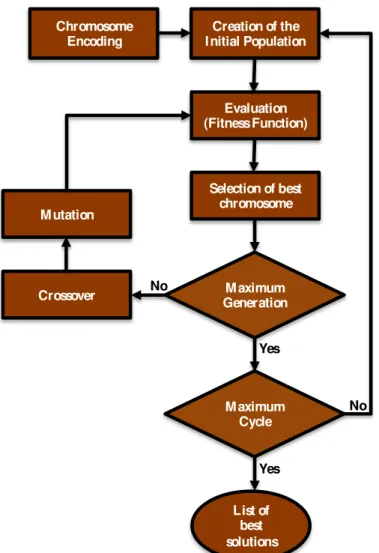
Fig. 3. Flowchart of Genetic Algorithm.
Figure 3 shows how GA works. It starts with the binary encoding of a chromosome followed by
randomly generating an initial population, the first generation. Each chromosome of the population
goes through an evaluation by means of a fitness function so that the best chromosome (solution) can
be selected. The next step verifies whether the established number of generations has been reached
which is when a given cycle terminates. If not, crossover and mutation operators are activated to
generate new chromosomes to yield a new generation, that has to go through the previous step of
evaluation and selection. In case the established number of generations is reached, a verification of
established number of cycles is done. If the number of cycles is not reached, a new cycle will begin by
creating a new initial population. This new initial population will also have to go through the steps of
evaluation, selection, crossover and mutation. If the established number of cycles is reached, the
optimization process is finalized resulting in list of chromosomes consisting of the best solution
within each cycle.
Some details of implementing GA follow:
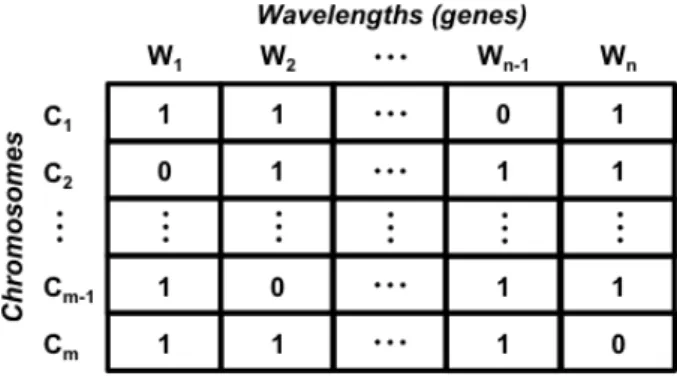
1) Chromosome encoding and initial population
A chromosome represents an encoded version of a wavelength activation order on the wavelengths
wavelength it represents will be activated, otherwise remains disabled. The total number of genes that
makes up the chromosome is the same as the number of channels in an optical link; however, the
number of wavelengths that are activated is determined in the previous phase (graph-coloring to
assign wavelengths).
The initial population consists of a set of chromosomes, where each individual is a potential
solution for the problem that will be evaluated by the fitness function. The structure of the
chromosome and of the initial population is depicted in Fig. 4, where each row represents one
chromosome (labeled with a number from C1 to Cm) and each column represents one wavelength
(labeled with a number from W1 to Wn according to its position on the wavelength grid).
Fig. 4. Chromosome and initial population representation.
2) Evaluation
The next step employs a fitness function to evaluate each candidate solution (chromosome) of the
population. This evaluation may: (i) identify the best solution; (ii) decide that a solution has to go
through a crossover and mutation operations; or (iii) may not even select a solution. It is worth
pointing out that the fitness function has been implemented based on the formulation described in
Section III. The formulation considers as a maximum limit of normalized variance of XPM effect
( ), the value of 2.6x10⁻³ [25].
As a final result, the fitness function for each chromosome returns the number of channels blocked
by XPM, residual dispersion or both. Residual dispersion is computed at the end of each route span,
soon after the Dispersion Compensating Fiber (DCF); for each lightpath. DCF length has been
adjusted to make the residual dispersion values negative in each span. This is because it has been
demonstrated in [26], that, dispersion map, characterized by negative residual dispersion value per
span, minimizes the degradation of XPM-induced degradation.
3) Selection of Best Chromosome and Maximum Generation
After evaluating each chromosome of a certain population, a chromosome that is fit is selected and
this process is repeated in each generation of a same cycle. Once the generations of a given cycle are
finalized, only the best out of the best solutions is stored.
Maximum Generation (Figure 3) is the criteria to terminate AG. In the performed simulations, it
was possible to verify that from 20 generations onwards, the fitness of the chromosomes converge to
4) Crossover
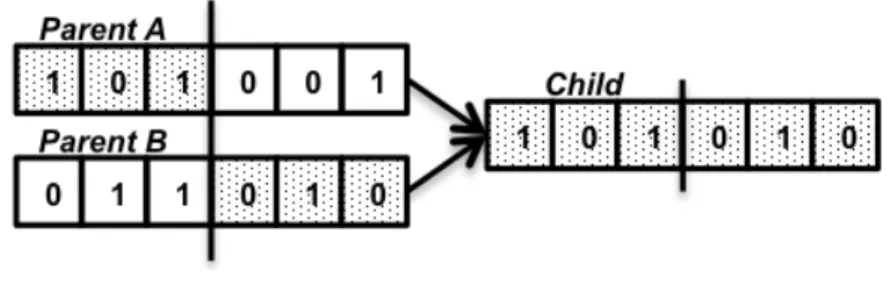
This operation transfers genes from parents to children [27]. In our paper, the number of crossover
operations performed to reproduce a new population, of the same size as the original population, is
equal to half of the original population. The parents are chosen on the conventional Roulette Wheel
selection scheme [17], and the crossing is conducted between pairs of chromosomes, where one has
the best fitness and the other has the worst. New chromosomes named children are generated as
shown in Fig. 5.
Fig. 5. Crossover phase.
5) Mutation
While crossover operations generate new combinations of existing gene values, mutation can
introduce entirely new genes values into the population [27]. We use this operation to randomly
modify some genes in each individual of the population in order to increase our search space and to
avoid premature convergence. Genes are always modified in pair so that the number of wavelengths,
defined in the Pre-processing (Graph-Coloring algorithm), is retained, as shown in Fig. 6.
Fig. 6. Mutation phase.
6) Maximum Cycle
When the algorithm reaches the value of 20 for Maximum Generation, Maximum Cycle is activated
so that it is verified whether the established number of cycles has been reached. In Maximum Cycle, a
new initial population is generated and the process, of evaluation, selection, crossover and mutation,
is repeated for 20 more generations. The number of cycles has been fixed to be 30 to enable
expanding the search space in different regions, thus increasing the chances of finding optimal
solutions. At the end of each cycle, the best solution found is stored so that the final result ends up in a
list with the best solution in each of the 30 cycles.
V. SCENARIOS DESCRIPTION AND SIMULATIONS RESULTS
Several papers were analyzed in the development of this proposal, but all were implemented in a
our experiments is that they were performed in an optical network very close to the actual situation in
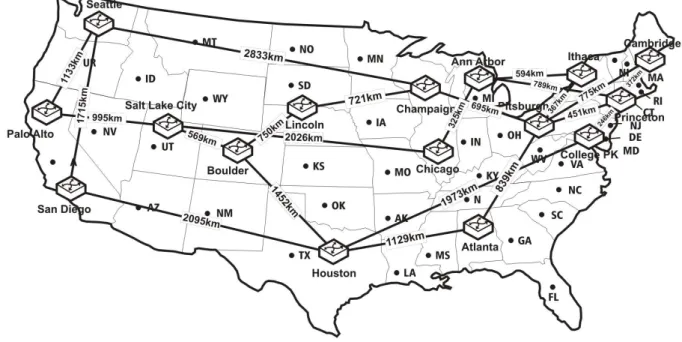
terms of distance between nodes, which provides more realistic results. Figure 7 shows the network
topology from the National Science Foundation network (NSF, U.S.) used to evaluate the
effectiveness of our proposal. It has 16 OXC’s (nodes origin and/or destination) nodes, 22 optical
links (all links above 100 km were randomly divided in spans with size ranging from 50 to 100 km),
and 302 passage nodes (nodes allocated in optical links, which may be used to add amplifiers and
dispersion compensators, for creation of spans).
The configuration of the employed network in our paper enables to easily find routes with number
of spans much above than one used in simulations by [25]. Nevertheless, studies on XPM-induced
degradation were conducted by [26] in which a scenario, with a high number of spans, few active
wavelengths and a dispersion management to reduce XPM (negative residual dispersion per span),
was simulated. This scenario is very close to that we employed and therefore, validates our proposal.
Fig. 7. NSFNET network topology.
The general configuration of the fiber link model, that we assumed, in each span consists of a
sequence of alternating ITU-T G.652 fiber (SFM – single-mode fiber) and dispersion compensation
fiber (DCF), as well as a set of amplifiers that can be: booster-, line- and/or pre-amplifier. One
possible configuration is shown in Fig. 8.
Our tests were performed with the number of connection requests ranging from 10 to 40, in two
different scenarios, S1 and S2. S1 scenario considered blocked connections only by XPM effect,
ignoring blocked lightpaths by residual dispersion, while S2 scenario considered blocked connections
by both XPM and residual dispersion effects. In the latter scenario we considered blocked all
lightpaths with residual dispersion values from 1175 ps/nm based on [28]. In both the scenarios we
used the parameters listed in Table 1. The optical channels in a determined span have equal power
values, but these values can be adjusted from -2 to 8 dBm depending on span length, in order to
guarantee a convenient power budget.
TABLE I. DEFAULT SIMULATION PARAMETERS
Parameter Values
Maximum number of wavelengths per path 40 DWDM grid spacing 100 GHz Lowest wavelengths of the grid 1529.55 nm Data rate per channel 10 Gbps Span length 50 km to 100 km Power of the pump and probe channels -2 to 8 dBm Amplifier noise figure 5.5 dB SMF loss coefficient 0.22 dB/km SMF dispersion coefficient for 1550.12 nm 17 ps/km.nm Dispersion slope of the SMF 0.08 ps/km.nm2 DCF loss coefficient 0.5 dB/km [29] DCF Dispersion coefficient for 1550.12 nm -100 ps/km.nm [29] Dispersion slope of the DCF -0.3 ps/km.nm2 [29] Fiber nonlinear coefficient 1.37 (W.km)-1
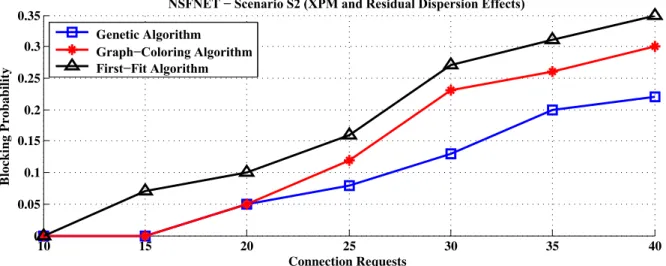
Figures 9 and 10 compare the blocking probability in our proposal with the First-Fit algorithm as a
function of the number of connection requests for two scenarios of the NSFNET topology. As can be
seen, the First-Fit algorithm, which is the most used WA algorithm in the literature, presents the worst
performance in all comparisons. This was expected since in this case adjacent channels were used,
fact that enhances the XPM effect.
10 15 20 25 30 35 40
0 0.05 0.1 0.15 0.2 0.25 0.3
0.35 NSFNET − Scenario S1 (Only XPM Effect)
Connection Requests B loc k ing P r o ba b il it y Genetic Algorithm Graph−Coloring Algorithm First−Fit Algorithm
10 15 20 25 30 35 40 0 0.05 0.1 0.15 0.2 0.25 0.3
0.35 NSFNET − Scenario S2 (XPM and Residual Dispersion Effects)
Connection Requests B loc k in g P r o b a bi li ty Genetic Algorithm Graph−Coloring Algorithm First−Fit Algorithm
Fig. 10. Blocking probability as a function of the connection requests for the different WA algorithms accounted XPM and residual dispersion effects.
One can also notice that only using preprocessing Graph-Coloring algorithm it is possible to
observe a significant improvement over traditional First-Fit algorithm, due to reduction the number of
wavelengths (channels) needed to meet traffic matrix. One should also note that the Graph-Coloring
algorithm shows a blocking probability acceptable when the number of connection requests is less
than 25 (scenario S2), in which case it is not necessary to use the GA, avoiding the time consumed for
its execution. However, the rate of blocking probability remained high when the number of demands
reached this limit.
The Genetic Algorithm shows an improvement of rate of blocking probability. This is expected
since GA tends to spread the wavelengths on the wavelengths grid, fact that minimizes the influence
among channels. Therefore, our proposal is efficient when the number of demands below 40, and we
considered only the XPM effect. When we also consider the residual dispersion our proposal presents
good results for maximum of 25 demands. Soon, it will be possible to find tunable dispersion
compensator, which may significantly reduce the effects generated by the residual dispersion [30],
and thus the data presented in Fig. 9 will be more realistic.
5 10 15 20 25 30 35 40 45
0 1 2 3 4 5 6 7
8 NSFNET − Both Scenarios
Connection Requests W a v el eng ht s Genetic Algorithm Graph−Coloring Algorithm
First Fit Algorithm
One other advantage of our proposal concerns the reduced number of wavelengths through the
graph-coloring technique, fact that not only impacts on network performance, but also on the cost of
deployment. In Fig. 11 it can be noticed that for higher demands, the reduction can reach 57.14%. The
number of wavelengths used in Genetic Algorithm is defined by Graph-Coloring Algorithm; the
difference is that the latter uses the First-Fit as a method of allocating wavelengths.
Analyzing Figures 10 and 11, one can see that in the case the First-Fit algorithm the blocking
probability reaches 7% for a demand of 15, which is attended by 4 wavelengths. While GA is able to
meet almost double (25 demands) with nearly the same blocking probability, but with only 3
wavelengths. Thus, one can notice the reduction not only in the cost with equipment but also with the
network energy consumption.
As expected, the performance and accuracy mainly depend on the population size, the number of
generations and cycles. We performed several experiments in order to find out the parameters, which
make the GA to achieve rapid convergence. So, we decided for the following configuration: the initial
population of 10 individuals, with 20 generations and 30 cycles. To avoid premature convergence we
used the operations of crossover and mutation rate of 0.8 and 0.01, respectively. The execution time
grew exponentially according to the number of demands required. In order to perform 10 demands the
optimization process took around 22 minutes, around 1 hour for 25 demands, and around 3 hours for
40 demands.
VI. CONCLUSIONS
In this paper we proposed a hybrid technique employing graph-coloring and genetic algorithm that
present a near optimal solution to the WA problem. We have developed an optimization process that
is able to significantly reduce the influence among channels by spreading wavelengths in the
wavelength grid. This optimization process is flexible and in future it will be extended to incorporate
other physical layer impairments, making the GA more efficient.
The results for GA showed the creation of multiple lists containing the best solutions in terms of
blocking probability. Each list created in offline phase was generated by a different traffic matrix and
could be used in the network operation phase according to the current network status. In all cases, it
was found that the list generated by GA presented better results than the First-Fit and the
Graph-Coloring algorithms. However in some situations the Graph-Graph-Coloring provides satisfactory results
without the need to perform GA. This work demonstrated the applicability of computational
intelligence and bio-inspired algorithms to solve different optimization problems involved in the
design of networks.
ACKNOWLEDGMENT
The authors would like to thank the Federal University of Pará (UFPA), the Federal Institute of
Pará (IFPA) and the Federal University of Espírito Santo (UFES) and the Brazilian Foundations, viz.
Ministry of Education (CAPES) and The National Council for Scientific and Technological
Development (CNPq).
REFERENCES
[1] A. Jirattigalachote, Provisioning Strategies for Transparent Optical Networks Considering Transmission Quality, Security, and Energy Efficiency, Doctoral Thesis in Microelectronics and Applied Physics, Royal Institute of Technology, Stockholm, Sweden, March 2012.
[2] I. Chlamtac, A. Ganz, and G. Karmi, “Lightpath Communications: An Approach to High- Bandwidth Optical WANs”, IEEE Transactions on Communications, vol. 40, no. 7, pp. 1171-1182, July 1992.
[3] U. Bhanja, S. Mahapatra, and R. Roy, “FWM aware evolutionary programming algorithm for transparent optical networks”, Photonic Network Communications, v. 23, issue 3, p. 285-299, June 2012.
[4] S. Azodolmolky, et al., “Experimental demonstration of an impairment aware network planning and operation tool for transparent/translucent optical networks”, Journal of Lightwave Technology, v. 29, n. 4, 439 – 448, February 2011. [5] F. Fidler, P. J. Winzer, M. K. Thottan, and K. Bergman, “Impairment-Aware Optical Networking Using Cross-Layer
Communication”, IEEE Journal of Optical Communications and Networking, v. 5, n. 2, p. 144-158, February 2013. [6] S. Pachnicke, T. Paschenda, and P. Krummrich, “Assessment of a constraint based routing algorithm for translucent 10
Gbits/s DWDM networks considering fiber nonlinearities”, Journal of Optical Networking, v. 7, n. 4, p. 365-377, April 2008.
[7] G. S. Pavani, L. G. Zuliani, H. Waldman, and M. F. Magalhães, “Distributed approaches for impairment-aware routing and wavelength assignment algorithms in GMPLS networks”, Computer Networks, v. 52, issue 10, 1905–1915, July 2008.
[8] D. Monoyios and K. Vlachos, “Multiobjective Genetic Algorithms for Solving the Impairment-Aware Routing and Wavelength Assignment Problem”, IEEE Journal of Optical Communications and Networking, v. 3, n. 1, p. 40-47, January 2011.
[9] S. Ten, K. Ennser, J. Grochocinski, S. Burtsev, and V. da Silva, “Comparison of four-wave mixing and cross phase modulation penalties in dense WDM systems”, in Optical Fiber Communication Conf. (OFC), 1999.
[10]R. Hui, K. Demarest, and C. Allen, “Cross-phase modulation in multispan WDM optical fiber systems, IEEE Journal of Lightwave Technology”, v. 17, issue 6, p. 1018–1026, 1999.
[11]A. Cartaxo, “Cross-phase modulation in intensity modulation-direct detection WDM systems with multiple optical amplifiers and dispersion compensators”, IEEE Journal of Lightwave Technology, v. 17, n. 2, p. 178-190, February 1999.
[12]N. Sambo, M. Secondini, F. Cugini, G. Bottari, P. Iovanna, F. Cavaliere, and P. Castoldi, “Modeling and distributed provisioning in 10–40–100-Gb/s multirate wavelength switched optical networks”, IEEE Journal of Lightwave Technology, v. 29, issue 9, p. 1248–1257, 2011.
[13]L. Velasco, A. Jirattigalachote, M. Ruiz, P. Monti, L. Wosinska, and G. Junyent, “Statistical Approach for Fast Impairment-Aware Provisioning in Dynamic All-Optical Networks”, IEEE Journal of Optical Communications and Networking, v. 4, v. 2, February 2012.
[14]Dijkstra, E. W. A Note on Two Problems in Connection with Graphs. In: Numerische Mathematik, vol. 1, pp. 269–271, 1959.
[15]B. Mukherjee, Optical Communication Networks, McGraw-Hill, New York, 1997.
[16]H. Zang, J. P. Jue, and B. Mukherjee, “A review of routing and wavelength assignment approaches for wavelength-routed optical WDM networks”, Optical Networks Magazine, v. 1, n. 1, p. 47–60, January 2000.
[17]C. J. A. Bastos-Filho, D. A. R. Chaves, F. S. F. e Silva, H. A. Pereira, and J. F. Martins-Filho, “Wavelength Assignment for Physical-Layer-Impaired Optical Networks Using Evolutionary Computation”, IEEE Journal of Optical Communications and Networking, v. 3, n. 3, p. 178-188, March 2011.
[18]U. Bhanja, S. Mahapatra, and R. Roy, “An evolutionary programming algorithm for survivable routing and wavelength assignment in transparent optical networks”, Journal of Information Sciences 222 (2013) 634–647.
[19]A. N. Patel, P. N. Ji, J. P. Jue, and T. Wang, “A Naturally-Inspired Algorithm for Routing, Wavelength Assignment, and Spectrum Allocation in Flexible Grid WDM Networks”, IEEE Globecom Workshop: Flexible Optical Networks, 2012.
[20]Y. S. Kavian, et al., “Routing and wavelength assignment in optical networks using Artificial Bee Colony algorithm”, Optik - Int. J. Light Electron Opt., 2012.
[21]C. Zhang, Z. L. Li, X. Zhang, and B. Zhang, “Two multi-objective genetic algorithms for the QoS based routing and wavelength allocation problem in WDM network”, Optik - Int. J. Light Electron Opt., 2012.
[22]A. Rubio-Largo, M. A. Vega-Rodríguez, J. A. Gómez-Pulido, and J. M. Sánchez-Pérez, “A Comparative Study on Multiobjective Swarm Intelligence for the Routing and Wavelength Assignment Problem”, IEEE Transactions on Systems, Man, and Cybernetics - Part C: Applications and Reviews, v. 42, n.6, p. 1644-1655, December 2012.
[23]S. Azodolmolky, M. Klinkowski, E. Marín, D. Careglio, J. Solé- Pareta, and I. Tomkos, “A survey on physical layer
impairments aware routing and wavelength assignment algorithms in optical networks”, Computer Networks, vol. 53, pp. 926–944, 2009.
[24]G. P. Agrawal, Nonlinear fiber optics, Academic Press, 2001.
[25]R. S. Luís and A. Cartaxo, “Analytical Characterization of SPM Impact on XPM- Induced Degradation in Dispersion-Compensated WDM Systems”, Journal of Lightwave Technology, v. 23, n. 3, p. 1503-1513, March, 2005.
[26]N. Costa and A. Cartaxo, “Influence of the Channel Number on the Optimal Dispersion Map Due to XPM in WDM
[27]El-Sayed M. El-Alfy, S. N. Mujahid, and S. Z. Selim, “A Pareto-based hybrid multiobjective evolutionary approach for constrained multipath traffic engineering optimization in MPLS/GMPLS networks”, Journal of Network and Computer Applications, February, 2013.
[28]International telecommunication union, “Optical fibers, cables and systems”, Geneva, 2009. [29]G. P. Agrawal, Fiber-optic communication systems, 3a ed. Wiley-Interscience, 2002.