Article
J. Braz. Chem. Soc., Vol. 22, No. 2, 286-291, 2011. Printed in Brazil - ©2011 Sociedade Brasileira de Química 0103 - 5053 $6.00+0.00
A
*e-mail: [email protected]
STD NMR Spectroscopy: a Case Study of Fosfomycin Binding Interactions in
Living Bacterial Cells
Cíntia D. F. Milagre, Luís Fernando Cabeça, Lucas G. Martins and Anita J. Marsaioli*
Instituto de Química, Universidade Estadual de Campinas, CP 6154, 13083-970 Campinas-SP, Brazil
O experimento de RMN STD (saturation transfer difference) foi empregado com sucesso na observação das interações de ligação entre fosfomicina e cepas bacterianas resistentes e não resistentes à fosfomicina, diretamente em suspensões celulares vivas sem necessidade de marcação isotópica do ligante ou receptor.
A saturation transfer difference (STD) NMR experiment was successfully employed to observe the binding interactions of fosfomycin resistant and non-resistant bacterial strains using living cell suspensions, without the need for isotopic labelling of the ligand or receptor.
Keywords: STD NMR in living bacterial cells, membrane-bound proteins, ligand-target interactions, fosfomycin, liposomes
Introduction
Saturation transfer difference (STD) is a 1H NMR
technique widely used to investigate ligand (small molecules) and macromolecular (proteins and peptides,1
carbohydrates,2 lipids3 and nucleic acids4) interactions.
This tool (a STD experiment) is appropriate to probe biological binding events at the molecular level5 and is
based on the nuclear Overhauser effect (nOe) transfer from the macromolecule to the ligand. It consists of applying a selective radio frequency pulse to the macromolecule at a resonance where no ligand signals are present. The magnetization is transferred to the entire macromolecule via intra-molecular spin diffusion and then this saturation is transferred intermolecularly to bound ligands and detected in the free-ligand solution. The ligand’s hydrogen most tightly bound to the macromolecule will receive the most intense magnetization-transfer and the amplitude of these signals will change accordingly to the nOe effects.5,6 Therefore, the degree of nOe effects relects
the proximity of these protons to the macromolecule, allowing direct observation of the ligand moiety involved in the macromolecule-ligand interaction. Among the vast literature covering biological interactions observed by STD NMR spectroscopy there are few examples in which the detection of those binding processes occurs directly
in whole living cells.7 The information obtained in such
investigation is rather important, especially when studying ligand-membrane-bound protein interactions as most biologically relevant proteins are membrane-bound8 and are
often dificult to deal with as they lose their structures and functionality when removed from their natural membrane environment.
Herein we show the use of STD NMR to obtain information about direct drug transport into a cell of living bacterial cell suspensions. As an example we used the well-known fosfomycin uptake by cells and the relationship between fosfomycin resistance in bacterial strains.9 Fosfomycin or phosphonomycin,
[(1R,2S)-1,2-epoxypropylphosphonic acid)] is a broad spectrum antibiotic against negative and Gram-positive bacteria and has become the irst choice for the treatment of certain infections, especially those caused by cephalosporin and penicillin-resistant Streptococcus pneumoniae and, methicillin- and vancomycin-resistant Staphylococcus aureus strains (Figure 1).10 It has been
shown that fosfomycin acts as a cell wall inhibitor by irreversibly inactivating UDP-N-acetyl-glucosamine-3-O-enolpyruvyltransferase (MurA) in the first step in peptidoglycan biosynthesis.11 Bacterial fosfomycin
In option ii, to reach a MurA target fosfomycin has to be transported into the cell via a fosfomycin-inducible bacterial transport system, often 3-glycerol-3-phosphate (GlpT) and/or a hexose phosphate transporter (UhpT), depending on the bacteria. However, when this penetration is defective or absent bacterial strains exhibit resistance to fosfomycin.9
Results and Discussion
A bioassay based on a toxicity selection system furnished fosfomycin resistant strains. This assay consisted in plating bacterial strains on a freshly made nutrient agar medium containing fosfomycin. Visual inspection of agar plates displaying growing and non growing bacterial colonies allowed the selection of resistant and non resistant strains, respectively. Serratia liquefaciens (CCT 7262) was used as a resistant strain while Escherichia coli (CCT 5050) and Pseudomononas oleovorans (CCT 1969) were used as non-resistant strains. Differentiating ligand binding events with bacterial membrane lipidic moieties and membrane-bound proteins is not obvious. This issue was addressed by analyzing model systems: phosphatidylcholine liposomes, a widely spread model for phospholipidic biomembranes,12
and HSA (human serum albumin) as a model for the proteic transport systems due to the outstanding ability of HSA to bind reversibly to an incredible variety of ligands.13
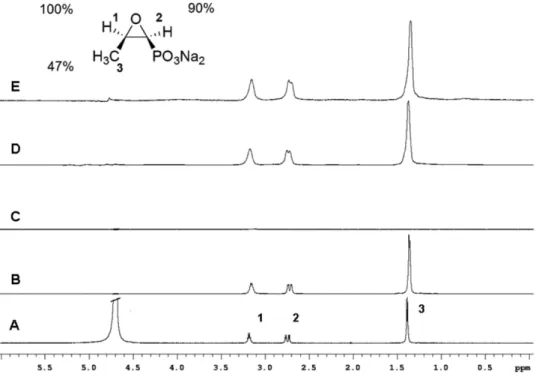
Figure 2 shows the different steps involved in the STD NMR experiment with model systems. The regular 1H NMR
spectrum of fosfomycin and its hydrogen chemical shifts assignments are seen in Figure 2A. Figure 2B depicts the STD NMR off resonance of fosfomycin-EPC liposomes (control experiment). In this experiment the radio frequency pulse is applied outside the spectral window (30 ppm), where there is no signal of either the macromolecule (EPC liposomes) or the ligand (fosfomycin). Consequently the spectrum displays all ligand signals as in a regular
1H NMR spectrum, with some line broadening due to the
presence of the macromolecule. Figure 2C corresponds to the STD NMR of the same sample recorded with on resonance irradiation. Thus, the macromolecule is selectively saturated by applying a radio frequency pulse on the macromolecule signals (−0.5 ppm) in a region where
no ligand signals are present. Spin diffusion transfers magnetization over all the macromolecule and to the ligands in close contact with the macromolecule. The STD
experiment with the fosfomycin-EPC liposome complex, saturating the liposome signal at 0.5 ppm, did not show any signal corresponding to fosfomycin, indicating no interaction. On the other hand, the STD NMR spectrum of the mixture fosfomycin-HSA (Figure 2E) showed nOe signal enhancements for fosfomycin suggesting that indeed fosfomycin’s irst binding event is on a membrane-bound protein. The degree of magnetization transfer from HSA to fosfomycin was H-1 and H-2 (100% and 90% respectively, normalized values) indicating that these protons are more saturated due to their close interaction with HSA while a weaker response was observed for the CH3 protons (47%), indicating that this moiety is further away from the protein receptor.
By extrapolating these results it is possible to conirm by STD NMR that fosfomycin penetration into the cell occurs with a proteic transport system and is not due to a passive transport through phospholipidic membrane moieties.9
Analogous experiments were carried out using bacterial cell suspensions incubated with fosfomycin. STD NMR experiments with resistant Serratia liquefaciens whole cell suspensions provided no signal enhancement, as shown in Figure 3C indicating a weak interaction between fosfomycin and Serratia liquefaciens membrane-bound proteins, thus corroborating the proposal that the absence of fosfomycin uptake by the cells is closely related to its resistance mechanism. STD NMR experiments carried out with two different non-resistant bacteria strains, E. coli and Pseudomonas oleovorans, showed that fosfomycin binds to both strains (Figure 3E and 3G, respectively). However the interactions are different, as suggested by the epitope mappings shown in Table 1. This result can be rationalized by the fact that GlpT is the only fosfomycin transporter in Pseudomonas oleovorans while in E. coli, besides GlpT, there is also UhpT.9
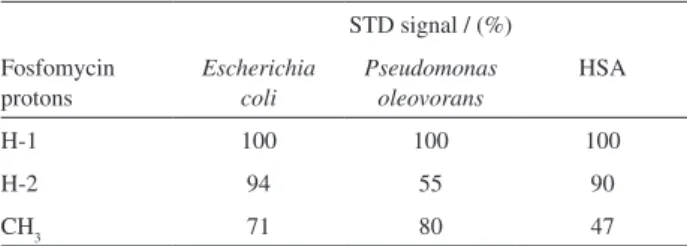
Table 1. Epitope mappings of fosfomycin with non-resistant bacterial cells and a model protein
STD signal / (%) Fosfomycin protons Escherichia coli Pseudomonas oleovorans HSA
H-1 100 100 100
H-2 94 55 90
CH3 71 80 47
The experiments were done at 298 K and pH 7.4 using 499.89 MHz in D2O. The residual HDO signal was used as reference at 4.68 ppm. The STD NMR spectrum provided epitope mapping with values obtained from the individual signal intensities in the STD NMR spectrum on resonance (Ion) and in the reference STD NMR spectrum off resonance (Ioff).The relative degrees of saturation were measured by A = (Ion - Ioff)/ Ioff and were normalized using the largest STD effect as reference.
Figure 2. Top: fosfomycin structure and the relative degree of saturation transfer (%) of its individual protons. Bottom: (A) 1H NMR spectra of fosfomycin;
B) The off resonance STD NMR spectrum of fosfomycin in EPC liposomes; C) The on resonance STD NMR spectrum of fosfomycin in EPC liposomes. D) The off resonance STD NMR spectrum of fosfomycin + HSA; E) The on resonance STD NMR spectrum of fosfomycin + HSA.
Figure 3. Top: fosfomycin structure and the relative degrees of saturation transfer (%) of the individual protons with two non-resistant bacteria strains. Bottom: A) 1H NMR spectra of fosfomycin; B) The off resonance STD NMR spectrum of fosfomycin + Serratia liquefaciens; C) The on resonance STD
A critical parameter that strongly influences the applicability of NMR experiments with whole cells is the cell survival rate in the NMR tube.14 The NMR samples with
bacterial cells must be freshly prepared since resistance to fosfomycin develops rapidly in Escherichia coli and Pseudomonas oleovorans under experimental conditions.
Saturation transfer difference NMR spectroscopy was successfully employed to observe fosfomycin-membrane-bound protein interactions directly in living bacterial cells. A relationship between fosfomycin resistance and the absence of its uptake by the cell was established and evidence of fosfomycin uptake due to a proteic transport system and not to a passive transport through the membrane was obtained. Using STD NMR experiments with living cells to study binding events between ligand-membrane-bound proteins in their natural environment at the molecular level opens new possibilities for pharmaceutical and medical research.
Experimental
Materials
Fosfomycin disodium salt and egg phosphatidyl choline (EPC) were purchased from Sigma-Aldrich. Deuterated water (D2O, 99.9%) was obtained from Acros Organics. HSA (fraction V) was purchased from Calbiochem and used without further puriication. The microorganisms were supplied by the Tropical Culture Collection (CCT) of the André Tosello Foundation, Campinas, SP, Brazil (http://www.fat.org.br).
Bacterial culture conditions
The pure cultures of the selected strains were inoculated with a loop into NB media. A working volume of 15 mL (NB media after inoculation) in 50 mL Erlenmeyer lasks was cultivated in an orbital shaker at 30 oC, 150 rpm. The
cells were harvested by centrifuging the overnight culture broth. The wet biomass was used for NMR experiments.
Liposomes preparation
Liposomes were obtained by evaporating stock chloroform solutions of EPC under a nitrogen stream. The samples were left under vacuum for 2 h to remove residual solvent.15 The lipids were then suspended in 0.4 mol L-1
phosphate/biphosphate buffer solution, pH 7.4, producing large EPC multilamellar vesicles (MLV). The EPC (MLV) was extruded through Nucleopore polycarbonate membranes of 0.4 µm pore diameters (12 cycles), to form
a suspension of 400 nm liposome vesicles. The total lipid concentration was 5 mmol L-1.
NMR sample preparation
Liposome experiment
A fosfomycin solution was prepared in phosphate/ biphosphate buffer solution in deuterated water (D2O, 99.9%) at pH 7.4 and added to the liposomes to reach 10 mmol L-1 as the inal concentration.
HSA experiment
A fosfomycin solution (10 mmol L-1) was prepared in
phosphate/biphosphate buffer solution in deuterated water (D2O, 99.9%) at pH 7.4. HSA (90 µmol L-1) was added
to the antibiotic solution and gently mixed to avoid foam formation.
Whole cell suspensions experiments
A fosfomycin solution (10 mmol L-1) was prepared in
phosphate/biphosphate buffer solution in deuterated water (D2O, 99.9%) at pH 7.4. Bacterial wet biomass (16 mg) was resuspended in this antibiotic solution (600 µL) and mixed.
Acquisition of NMR spectra
All NMR experiments were recorded at a temperature of 298 K with a spectral width of 10 ppm on a Varian INOVA-500 spectrometer operating at 11.74 Tesla, observing 1H at 499.89 MHz. The spectrometer was
equipped with a 5 mm penta resonance (15N, 13C, 1H, 31P
and a lock channel) inverse detection probe with gradient in z direction. The 1H NMR chemical shifts are given in ppm
related to the residual HDO signal at 4.68 ppm. The pulse sequence PRESAT, Water package from Varian was used to selectively suppress the water signal. In STD experiments, selective saturation of the protein was achieved by a train of Gaussian shaped pulses of 50 ms each, truncated at 1%, and separated by a 1 ms delay. The duration of the presaturation of 2.55 s was adjusted using n = 150 cycles. A T1ρ ilter,
30 ms spin lock pulse was utilized to remove residual protein resonances. The irradiation power of the selective pulse was (γ/2π)B1 = 86 Hz. The on-resonance irradiation
signal intensities in the STD NMR spectrum (Ion) and in the reference STD NMR spectrum (Ioff).
The STD amplification factor (A) was calculated according to the following equation and normalized using the largest STD effect as reference (100).16
Ioff – Ion A (STD) = –––––––
Ioff
where Ioff and Ion are the integral value in the off and on resonance spectrum, respectively. Note that both spectra have to be processed with the same vertical scale.
Acknowledgments
We thank the Brazilian Science Foundations FAPESP and CNPq for their inancial support. We acknowledge Prof. Carol Collins from IQ-Unicamp for text revision.
References
1. Mesleh, M. F.; Shirley, W. A.; Heise, C. E.; Ling, N.; Maki, R. A.; Laura, R. P.; J. Biol. Chem. 2007, 282, 6338; Takeuchi, K.; Wagner, G.; Curr. Opin. Struct. Biol.2006, 16, 109; Milton, M. J.; Williamson, R. T.; Koehn, F. E.; Bioorg. Med. Chem. Lett. 2006, 16, 4279; Megy, S.; Bertho, G.; Gharbi-Benarou, J.; Baleux, F.; Benarous, R.; Girault, J-P.; FEBS Lett.2006, 580, 5411; Gharbi-Benarou, J.; Bertho, G.; Evrard-Todeschi, N.; Coadou, G.; Megy, S.; Delaunay, T.; Benarous, R.; Girault, J-P.; Biochemistry 2004, 43, 14555.
2. Kaszowska, M.; Norgren; A. S.; Arvidson; P. I.; Sandstrom, C.; Carbohydr. Res. 2009, 344, 2577; Angulo, J.; Díaz, I.; Reina, J. J.; Tabarani, G.; Fieschi, F.; Rojo, J.; Nieto, P. M.; ChemBioChem 2008, 9, 2225; Brecker, L.; Schwarz, A.; Goedl, C.; Kratzer, R.; Tyl, C. E.; Nidetzky, B.; Carbohydr. Res. 2008, 343, 2153; Houliston, R. S.; Yuki, N.; Hirama, T.; Khieu, N. H.; Brisson, J. B.; Gilbert, M.; Jarrel, H. C.; Biochemistry 2007, 46, 36; Macnaughtan, M. A.; Avarez-Manilla, M. K. G.; Venot, A.; Pierce, J. G. J. M.; Prestegar, J. H.; J. Mol. Biol. 2007, 366, 1266; Haselhorst, T.; Blanchard, H.; Frank, M.; Krachnefski, M. J.; Kiefel, M. J.; Szyczew, A. J.; Dyason, J. C.; Fleming, F.; Holloway, G.; Coulson, B. S.; von Itzstein, M.; Glycobiology 2006, 17, 68; Haselhorst, T.; Oschlies, M.; Abu-Izneid, T.; Kiefel, M. J.; Tiralongo, J.; Munster-Kunhel, A. K.; Gerardy-Schahn, R.; von Itzstein, M.; Glycoconjugate J. 2006, 23, 371; Sandstrom, C.; Berteau, O.; Gemma, E.; Oscarson, S.; Kenne, L.; Gronenborn, A. M.; Biochemistry 2004, 43, 13926. 3. Soubias, O.; Gawrisch, K.; J. Am. Chem. Soc. 2005, 127, 13110;
Wang, J.; Schnell, J. R.; Chou, J. J.; Biochem. Biophys. Res. Commun. 2004, 324, 212.
4. Di Micco, S.; Bassarello, C.; Bifulco, G.; Riccio, R.; Gomez-Paloma, L.; Angew. Chem., Int. Ed. 2006, 45, 224.
5. Meyer, B.; Peters, T. Angew. Chem., Int. Ed. 2003, 42, 864; Mayer, M.; Meyer, B.; J. Am. Chem. Soc.2001, 123, 6108; Mayer, M.; Meyer, B.; Angew. Chem., Int. Ed. 1999, 38, 1784; Böhm, R.; Freiberger, F.; Stummeyer, K.; Gerardy-Schahn, R.; von Itzstein, M.; Haselhorst, T.; ChemBioChem 2010, 11, 170; Caraballo, R.; Dong, H.; Ribeiro, J. P.; Jiménez-Barbero, J.; Ramström, O.; Angew. Chem., Int. Ed. 2010, 49, 589; Ludwig, C.; Guenther, U. L.; Front. Biosci. 2009, 14, 4565; Ji, Z. S.; Yao, Z. X.; Liu, M. L.; Anal. Biochem. 2009, 385, 380; Yuan, Y.; Bleile, D. W.; Wen, X.; Sanders, D. A.; Itoh, K.; Liu, H.W.; Pinto, B. M.; J. Am. Chem. Soc. 2008, 130, 3157; Carlomagno, T.; Annu. Rev. Biophys. Biomol. Struct. 2005, 34, 245. 6. Pons, J.; Todeschi, N. E.; Bertho, G.; Benarous, J. G.; Tanchou,
V.; Benarous, R.; Girault, J. P.; Biochemistry2008, 47, 14; Figueiredo, I. M.; Marsaioli, A. J.; Quim. Nova 2007, 30, 1597. 7. Claasen, B.; Axmann, M.; Meinecke, R.; Meyer, B.; J. Am.
Chem. Soc.2005, 127, 916; Mari, S.; Serrano-Gómez, D.; Cañada, F. J.; Corbí, A. L.; Jiménez-Barbero, J.; Angew. Chem., Int. Ed. 2005, 44, 296; Benie, A. J.; Moser, R.; Baumi, E.; Blaas, D.; Peters, T.; J. Am. Chem. Soc. 2003, 125, 14.
8. Assadi-Porter, F. M.;Tonelli, M.; Maillet, E. L.; Markley, J. L.; Max, M.; Biochim. Biophys. Acta, Biomembr. 2010, 1798, 82; Maggioni, A.; von Itzstein, M.; Tiralongo, J.; Haselhorst, T.; ChemBioChem 2008, 9, 2784.
9. Castañeda-García, A.; Rodríguez-Rojas, A.; Guelfo, J. R.; Blázquez, J.; J. Bacteriol. 2009, 191, 6968; Nilsson, A. I.; Berg, O. G.; Aspevall, O.; Kahlmeter, G.; Andersson, D. I.; Antimicrob. Agents Chemother. 2003, 47, 2850; Minassian, M. A.; Williams, J. D.; Rev. Contemp. Pharmacother. 1995, 6, 45; Kahan, F. M.; Kahan, J. S.; Cassidy, P. J.; Kropp, H.; Ann. NY Acad. Sci. 1974, 235, 364; Kadner, R. J.; Winkler, H. H.; J. Bacteriol. 1973, 113, 895; Venkateswaran, P. S.; Wu, H. C. J.; J. Bacteriol. 1972, 110, 935.
10. Hendlin, D.; Stapley, E. O.; Jackson, M.; Wallick, H.; Miller, A. K.; Wolf, F. J.; Miller, T. W.; Chaiet, L.; Kahan, F. M.; Foltz, E. L.; Woodruff, H. B.; Mata, J. M.; Hernandez, S.; Mochales, S.; Science 1969, 166, 122; Woodyer, R. D.; Shao, Z.; Thomas, P. M.; Kelleher, N. L.; Biodgett, J. A. V.; Metcalf, W. W.; van der Donk, W. A.; Zhao, H.; Chem. Biol. 2006, 13, 1171; Higgins, L. J.; Yan, F.; Liu, P.; Liu, H.; Drennan, C. L.; Nature 2005, 437, 838; Tessier, F.; Quentin, C.; Eur. J. Clin. Microbiol. Infect. Dis. 1997, 16, 159. 11. Marquardt, J. L.; Brown, E. D.; Lane, W. S.; Haley, T. M.;
Ichikawa, Y.; Wong, C. H.; Walsh, C. T.; Biochemistry 1994, 33, 10646; Kim, D. H.; Lees, W. J.; Kempsell, K. E.; Lane, W. S.; Duncan, K.; Wash, C. T.; Biochemistry 1996, 35, 4923; Barbosa, M. D. F. S.; Yang, G.; Fang, J.; Kurilla, M. G.; Pompliano, D. L.; Antimicrob. Agents Chemother. 2002, 46, 943.
13. Richardson, J. S.; Nature 1977, 268; 495; Roda, A.; Cappelleri, G.; Aldini, R.; Roda, E.; Barbara, L.; J. Lipid Res. 1982, 23, 490; Savu, L.; Benassasyag, C.; Vallette, G.; Christeff, N.; Nuney, E.; J. Biol. Chem. 1981, 256, 9414; Yates, F. E.; Urguhart, J.; Physiol. Rev. 1962, 42, 359; Unger, W. G.; J. Pharm. Pharmacol. 1972, 24, 470; Kragh-Hansen, U.; Pharmacol. Rev. 1981, 33, 17. 14. Reckel, S.; Hänsel, R.; Löhr, F.; Dötsch, V.; Prog. Nucl. Magn.
Reson. Spectrosc. 2007, 51, 91.
15. Cereda, C. M. S.; Araújo, D. R.; Brunetto, G. B.; de Paula, E.; J. Pharm. Pharmaceut. Sci. 2004, 7, 235.
16. Seeger, K.; Lein, S.; Reuter, G.; Berger, S.; Biochemistry 2005, 44, 6208.
Submitted: June 14, 2010
Published online: September 30, 2010